


Over the past several decades, the consumption of food away from home (FAFH) has increased substantially(Reference Saksena, Okrent and Anekwe1,Reference Todd, Mancino and Lin2) . Foods acquired in these settings tend to be less healthful, more energy-dense and larger in portion size compared with items prepared in the home(Reference Duffey and Popkin3). The poor nutritional quality of FAFH is one of the many factors associated with poorer diets that has contributed to the increasing burden of diet-related diseases, such as obesity(Reference Hales, Carroll and Fryar4).
Several approaches have been used to increase access to healthier foods outside of the home. These include attempts to explicitly educate individuals about healthy choices, as well as more implicit approaches, such as nudging. Nudging strategies seek to alter individual behaviour without removing choice by appealing to cognitive biases(Reference Thaler and Sustein5). Specifically, the use of product sampling (i.e. taste testing food samples) and point-of-purchase prompting (i.e. verbal prompts and promotional signage) have shown promising results in community settings(Reference Wilson, Buckley and Buckley6–Reference Glanz and Yaroch13). Taste testing interventions have been used to promote healthful food products in supermarkets(Reference Heilman, Lakishyk and Radas14), sporting events(Reference Olstad, Goonewardene and McCargar15) and restaurants(Reference Schickenberg, Van Assema and Brug16,Reference Anzman-Frasca, Braun and Ehrenberg17) . Olstad et al. (Reference Olstad, Goonewardene and McCargar15) demonstrated increased sales of healthy food items when samples were provided in a recreational sport setting, with increases maintained at follow-up time points 8 d post-intervention. Taste is a strong motivator for food purchasing decisions away from home(Reference Anzman-Frasca, Braun and Ehrenberg17–Reference Glanz, Basil and Maibach20), and providing samples allows patrons to taste an item before committing to a food choice.
Point-of-purchase prompting interventions have also shown evidence of effectiveness in restaurants(Reference Nothwehr, Snetselaar and Dawson21,Reference McNally, Anzman-Frasca and Bowman22) and supermarkets(Reference Escaron, Meinen and Nitzke8–Reference Milliron, Woolf and Appelhans10,Reference Glanz, Bader and Iyer12) , along with school and hospital cafeterias(Reference Schwartz11,Reference Glanz and Yaroch13) . For instance, the use of verbal prompts in school cafeterias significantly increased the amount of fruit taken by children(Reference Schwartz11). Similarly, Nothwehr et al. (Reference Nothwehr, Snetselaar and Dawson21) implemented table and entryway signage to promote healthier meal ordering in a non-chain restaurant. Table signs were noticed by more than half of all adult patrons at each time point, with individuals who indicated that they were trying to lose weight or decrease fat or salt intake more likely to report the signs affecting their ordering decisions.
While there is evidence in support of both taste testing and point-of-purchase prompting’s effects on food purchasing across various community settings(Reference Escaron, Meinen and Nitzke8–Reference Anzman-Frasca, Braun and Ehrenberg17,Reference Nothwehr, Snetselaar and Dawson21,Reference McNally, Anzman-Frasca and Bowman22) , the extant research does not capture the growing variety of contexts in which people acquire FAFH. In the past decade, there has been a drastic growth in the number of operating food trucks in the USA. The industry has witnessed a 6·8 % annual increase since 2014 and is projected to surpass $US 1 billion in revenue by the end of 2019(23). Food truck events provide a novel location for assessing the feasibility of approaches used to promote healthier eating in other FAFH settings. While researchers have assessed interventions to increase fruit and vegetable intake from mobile produce markets(Reference Hsiao, Sibeko and Troy24), to our knowledge, no study has applied healthy eating interventions at a food truck event. To address this gap, the current study aimed to examine the feasibility of an intervention combining taste testing and point-of-purchase prompting to promote healthier food selections from food trucks. Feasibility components included the assessment of the intervention’s: implementation fidelity (execution of study procedures), acceptability (participant satisfaction; extent to which the intervention fits with the health attitudes of the study population) and initial effectiveness (degree to which the intervention produced an effect)(Reference Bowen, Kreuter and Spring25). We hypothesised that sales of promoted healthy options would increase with the implementation of the taste testing and point-of-purchase intervention, with increases maintained post-intervention.
Methods
Participants
Food trucks
Food truck owners already participating in a weekly event in Buffalo, New York, were invited to participate in the study. A total of eleven food trucks expressed initial interest in the study, with a final total of seven trucks agreeing to participate. Participating food trucks represented 14−19 % of the total trucks at the event each week. The requirements of the food truck event specified that each participating truck must offer at least one ‘healthy option’ (see criteria below). In addition, trucks participating in the current study were required to be present at one of the study’s intervention weeks at minimum and willing to promote their healthy option during the intervention phase. Participating food trucks were given a $US 150 Visa gift card for their participation and were reimbursed for the cost of provided samples. A list of the trucks and information as to which weeks each was present appear in Table 1.
Table 1 Weekly attendance of each participating food truck

The schedule of attending food trucks was based on a rotation determined by the study site; therefore, participating food trucks were not expected to be at the event all weeks of the study. Types of trucks that participated included the following: one cake/dessert truck, one grilled cheese truck, one American cuisine truck, one barbeque smokehouse truck, one Australian cuisine truck, one pierogi truck and one frozen dessert truck.
* Baseline period.
† Sales data not collected due to logistical issues: during week 1, Truck B did not have an operating point-of-sale system; during week 6, Truck D was unable to provide their healthy option to patrons due to logistical issues with their distributor. Baseline data for Truck B are still included in analyses, given this truck’s presence at the food truck event during both baseline weeks. Post-intervention data for Truck D are still included in analyses, given this truck’s presence at the food truck event during both post-intervention weeks.
‡ Intervention period.
§ Post-intervention period.
Event patrons
A convenience sample of adult patrons was recruited to complete a brief survey regarding the acceptability of the study intervention. Eligibility criteria included the following: at least 18 years of age, able to read and write in English, ordered from a participating food truck that day and had not previously enrolled in the study. In total, 418 patrons were screened, and 180 (43·9 %) were eligible and completed surveys. Ineligibility (58·0 %) was primarily due to patrons not purchasing items from a participating truck that day. In the case of one participant, nearly all responses were implausible values, resulting in a final sample size of 179. The university’s Institutional Review Board approved all human subjects procedures with a waiver of written informed consent. Participant characteristics appear in Table 2.
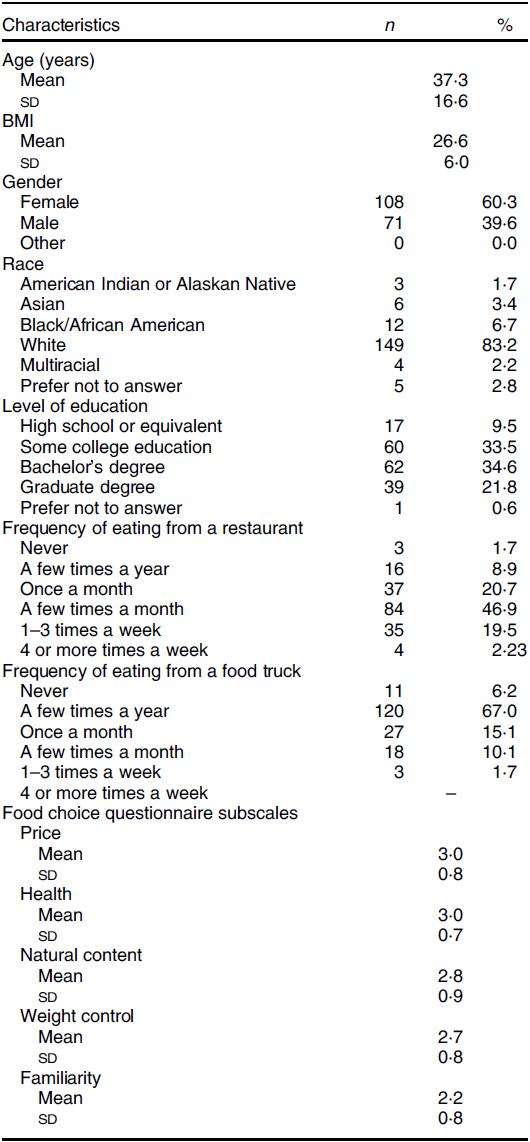
Table 2 Characteristics of survey participants (n 179)
Procedures
Data collection
Data collection occurred every Tuesday evening for 6 weeks, with 2 weeks of baseline, intervention and post-intervention data collection, respectively, at a recurring food truck event located in an urban region of Buffalo, New York. Each week, one lead researcher and 3–5 research assistants attended the food truck event for its full duration. The researchers’ table was in a centrally located pavilion that was accessible to all patrons. Each week, the research team (i) informed the food truck staff of the day’s procedures, (ii) collected sales data from food trucks and (iii) recruited and screened interested patrons. To be screened and enrolled in the study, patrons needed to express initial interest to the study team, given the no-soliciting policy at the study location. A member of the research team screened for eligibility using an offline survey application on an electronic tablet or with paper forms, if preferred. If eligible, participants proceeded, completing a self-administered survey and receiving a $US 5 cash payment. Data collection procedures with human subjects were identical during the entire study. The only differences between study periods pertained to the intervention protocol. This included the execution of the intervention during the intervention phase, the lead researcher’s communications with the food truck staff during this phase (e.g. reminding staff about the taste testings and inquiring if staff had any questions regarding the intervention procedures) and assessment of the intervention’s implementation fidelity (degree of execution and success/failure of execution).
Intervention
Intervention components were selected based on strategies used to promote healthy eating in other FAFH settings(Reference Schwartz11,Reference Olstad, Goonewardene and McCargar15,Reference Nothwehr, Snetselaar and Dawson21) . During the intervention phase, participating food trucks provided free samples of a healthy option that was part of their regular menu and used point-of-purchase prompting to promote the samples. Point-of-purchase prompting methods included signage promoting the healthy food items and use of the verbal cue, ‘Would you like to try a free sample of “X” today?’ before each patron placed an order. Healthy options were available at participating trucks during each week of data collection with free samples provided during the intervention phase only.
Promoted healthy options met the Independent Health Foundation’s ‘Healthy Options’ programme nutritional criteria. This programme was created in 2004 and works with local restaurants to create food options that contain reduced amounts of fat, saturated fat, cholesterol and sodium(26). All approved Healthy Option menu items are reviewed by a registered dietitian and are consistent with the USDA 2015–2020 Dietary Guidelines(27). The promoted item was always a food item, but the specific type varied: one truck promoted an appetiser (smoked watermelon), two trucks promoted a dessert (lemony fresh cheesecake bites, strawberry watermelon sorbet) and four trucks promoted a main dish (pesto grilled cheese, healthy ‘trash plates’ (a healthy version of a traditional Rochester, NY, main dish that includes sweet potatoes, lettuce, chicken breasts and garnishes), Sydney’s salad with chicken (a green salad with chicken) and Asian pork pierogis). Nutritional criteria for healthy options and nutrition information for full-size versions of promoted food items appear in Table 3.
Table 3 Nutritional criteria for ‘Healthy Options’ and specific nutrition information for items promoted by food trucks
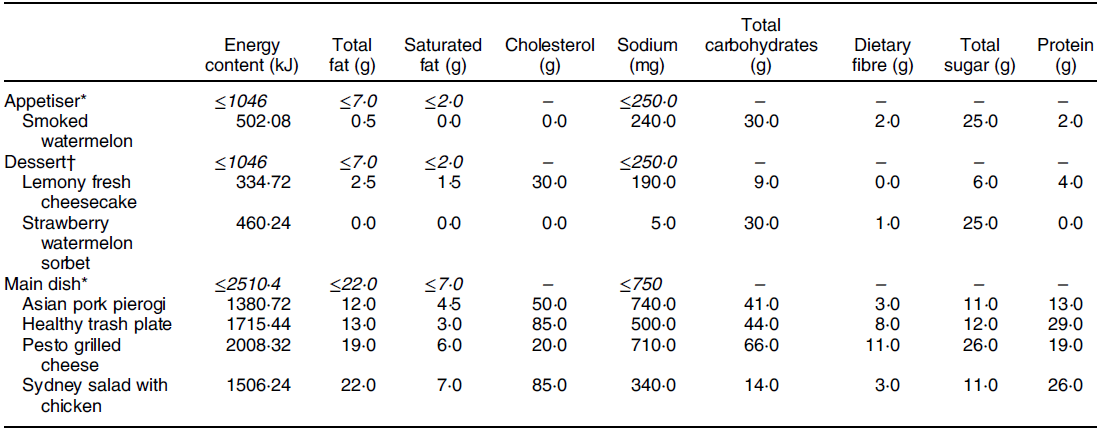
Italicised lines indicate the criteria for that item per Independent Health Foundation’s ‘Healthy Options’ programme; non-italicised numbers indicate the specific nutrition information for each promoted item. Programme guidelines also require added sugar values less than 3·0, 16·0 and 7·0 g for appetisers, desserts and main dishes, respectively. Added sugar values for the promoted items are not available as these items were approved as Healthy Options prior to the incorporation of added sugar guidelines. Energy requirements for the Independent Health Foundation ’Healthy Options’ programme were originally reported in kilocalories.
* Items must not be fried.
† Items must be fruit, low-fat dairy and/or whole-grain-based.
Measures
Implementation fidelity
Tracking methods were established to record the degree to which participating food trucks executed the intervention against manualised procedures. Namely, measures assessed the degree to which food trucks were successful at providing taste testings and implementing point-of-purchase prompting (visible signage and use of verbal cues). During intervention weeks, study staff unobtrusively observed each truck for visible signage, use of verbal cues and presence of food samples, noting hourly whether each of these intervention components was implemented with fidelity (yes/no, where ‘yes’ indicated successful execution of each intervention component).
Intervention acceptability and patron perspectives
Measures were developed or adapted from prior research to assess participants’ acceptability of the intervention(Reference Anzman-Frasca, Braun and Ehrenberg17) (see online supplementary material). Specifically, survey items assessed the uptake of the samples offered by each food truck and participants’ satisfaction with the samples. Survey items were also administered to characterise participants’ general food and health attitudes to inform the extent to which the present intervention aligns with the health attitudes of this population. Five validated subscales from the Food Choice Questionnaire were used to assess motivators for food choice: health, natural content, price, weight control and familiarity (Reference Steptoe, Pollard and Wardle28). For each question, participants were asked to indicate their importance on a four-point scale: not at all important, a little important, moderately important and very important, scored 1−4, respectively. Participant demographics were also assessed.
Intervention effectiveness
Initial effectiveness was assessed by examining changes in relative sales of promoted healthy options from baseline to intervention and post-intervention. Each week, participating food trucks provided sales data indicating the total number of each menu item sold per study day, including the healthy option promoted as part of the study. One truck was not able to provide item-level information, but still provided the number of healthy options sold and the total number of food items sold. Sales data were double entered and compared, with discrepancies resolved. Two instances in which sales data were not collected as planned are described in Table 1.
Statistical analysis
Statistical analyses were conducted using SAS version 9.4. Descriptive statistics were conducted on variables of interest, including an examination of distributions, central tendencies, variability and frequencies. To examine implementation fidelity and acceptability of the intervention, observational data were summarised, and means and standard deviations (for continuous variables) and frequencies (for categorical variables) were conducted for aforementioned survey items and subscales. To examine initial effectiveness, a linear mixed model with a random effect for subject (truck) and a fixed effect for time (baseline, intervention and post-intervention) was used to examine changes in relative sales of promoted healthy options. The percentage of food items sold that were the promoted healthy option was the dependent variable in this primary analysis, which was conducted using PROC MIXED. In addition to the overall test of whether relative sales of healthy options changed over time, we used the least square means estimate (LSMESTIMATE) statement to test for significant differences in the relative sales of healthy options at baseline v. intervention, intervention v. post-intervention and baseline v. post-intervention. Recognising the initial nature of the research and the small sample of seven trucks, effect sizes (Cohen’s d) were calculated as the primary indicator of change from baseline to intervention, intervention to post and baseline to post-intervention, with 0·2 considered a small effect, 0·5 considered a medium effect and 0·8 considered a large effect(Reference Cohen29).
Results
Implementation fidelity
Results indicated high levels of fidelity. All food trucks were compliant with manualised procedures and successfully executed the intervention components as desired. No food trucks withdrew before the end of the study, and generally, all provided sales data to the research team. Two specific instances in which sales data were unable to be collected as planned are described in Table 1. On each day of the intervention, all participating food trucks had free samples of the healthy options available to participants; only one truck (Truck B) ran out of samples during both intervention weeks. Most trucks displayed samples directly on the food truck (71·4 %); the two remaining trucks had samples displayed on a table next to the truck or had an employee hand out the samples. During hourly observations, all food trucks implemented the point-of-purchase prompting components of the intervention (visible signage and use of verbal cues) when samples were available to patrons.
Intervention acceptability and patron perspectives
The average time for participants to complete the survey was 4·7 min (sd = 1·7). Among the 179 participants surveyed, forty-seven participated during the baseline period, sixty-two participated during the intervention period and seventy participated during the post-intervention period. Within the survey sample, there were 192 items purchased from participating food trucks, as some individuals patronised more than one truck. When asked why they selected their purchased food item that day, the majority of patrons indicated taste as a motivator, both overall (60·3 % of responses) and during the intervention period specifically (55·4 %). During the intervention period, there were sixty-nine items purchased from participating trucks. In 10·8 % of these instances, free samples were listed as a reason for the selection of the purchased item. Participants during the intervention period reported receiving a free sample in 31·9 % of instances, and in the majority of these cases (77·3 %), the sample was rated positively, indicating high acceptability among patrons (Table 4). Overall, price and health were the most important factors motivating participants’ general food choices. On the 1–4 scale representing the importance of each factor, the mean response for the subscale price was 3·0 and the mean score for the subscale health was 3·0, both of which correspond to a response of ‘moderately important’ (Table 2).
Table 4 Patron-reported experiences purchasing foods from food trucks
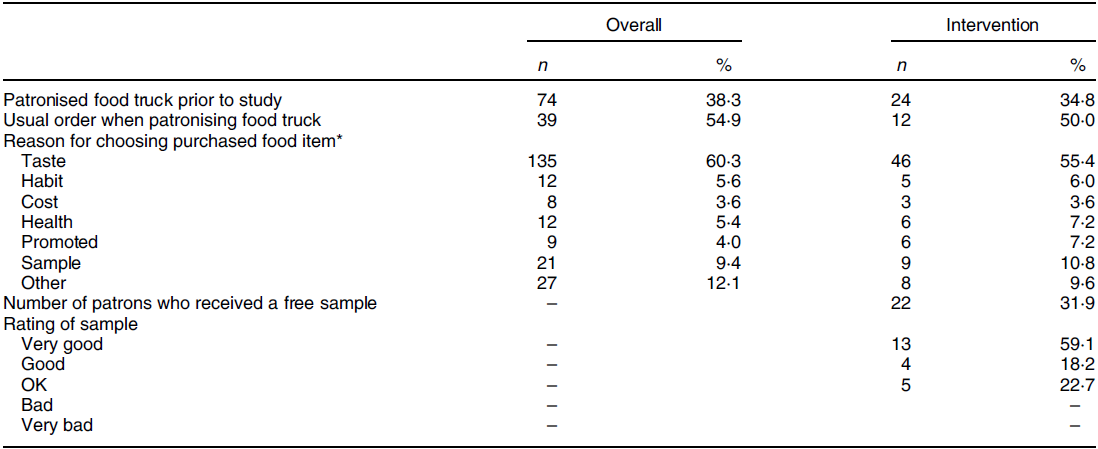
* Patrons were encouraged to select all reasons that influenced their food purchases; therefore, the total number of responses is greater than the study sample of n 179.
Intervention effectiveness
Overall, 4469 food items were sold by the participating food trucks during the 6-week study period. Among these, 471 (10·5 %) were promoted healthy options, ranging from 0·64 to 31·8 % by food truck. When examining changes in the relative sales of healthy options, there was no overall main effect of time (P = 0·32); however, comparisons of individual time points were consistent with hypotheses. During the intervention period, 13·93 % (se 0·04) of food sales were for the promoted healthy options, compared with 11·35 % (se 0·04) at baseline. This increase corresponded to a medium effect size (d = 0·51) and was maintained, with 14·08 % (se 0·04) of food sales for healthy promoted items at post-intervention (intervention to post-intervention, d = 0·03). Similarly, the change in relative sales of healthy options from baseline to post-intervention was in the expected direction and corresponded to a medium effect size (d = 0·55). None of these changes (baseline to intervention, intervention to post-intervention and baseline to post-intervention) reached statistical significance (P = 0·20, 0·93 and 0·18, respectively).
Discussion
Our study provides initial evidence supporting the continued investigation of taste testing and point-of-purchase prompting as strategies to promote the selection of healthier food options from food trucks. Effect sizes were consistent with the hypothesis that sales of promoted items would increase with the implementation of the taste testing and point-of-purchase prompting interventions, which generally appear feasible based on implementation fidelity and acceptability findings. Given that this is the first study evaluating taste testing and point-of-purchase prompting interventions in this setting, and given the small sample of food trucks, findings can be used to inform future research, with opportunities to build upon and address limitations of the current study.
Participating food trucks executed the intervention components as intended and successfully implemented point-of-purchase prompting and taste testings. While these findings support the use of taste testing and point-of-purchase prompting to promote healthier food selection from food trucks, our findings also highlight areas for future research. Only one truck ran out of samples during the intervention period; however, less than one-third of patrons reported receiving a sample. Although all food trucks were successful at executing intervention procedures (providing free samples, visible signage and use of verbal prompts), the limited reach of the samples is a finding warranting further examination. Given that the survey item asked whether each patron received a free sample and not whether she/he was offered one, it is likely that the observed rate of accepted samples reflects patron’s interest in the samples.
Future interventions in this setting could test more active strategies to increase the uptake of free samples. Further, studies could assess the palatability of different healthy options (e.g. using taste tests) to inform which items to promote; an idea that aligns with patrons’ reports that the primary determinant of food choices in this setting is taste. Survey responses also indicated that primary determinants of food selection more generally include price and health, which is consistent with past work(Reference Anzman-Frasca, Braun and Ehrenberg17–Reference Glanz, Basil and Maibach20,Reference Prescott, Young and O’neill30–Reference Markovina, Stewart-Knox and Rankin32) . Rather than placing an overt emphasis on the healthfulness of food items, emphasising taste could be a more effective strategy in this setting. The present intervention did not highlight the healthfulness of the healthy options, given the evidence that healthy foods are often perceived as unpalatable(Reference Raghunathan, Naylor and Hoyer33) but also did not have an explicit focus on taste. By broadening the appeal of promoted food items, healthy eating interventions could have the potential for larger effects in food trucks and other FAFH settings.
While the present results suggest initial effectiveness, the magnitude of change is smaller compared with previous literature exploring similar strategies(Reference Schwartz11,Reference Olstad, Goonewardene and McCargar15,Reference Schickenberg, Van Assema and Brug16) . Differences may be attributed to different study settings, as previous research exploring the use of taste testing and point-of-purchase prompting has primarily taken place in restaurant(Reference Schickenberg, Van Assema and Brug16,Reference Nothwehr, Snetselaar and Dawson21,Reference McNally, Anzman-Frasca and Bowman22) , supermarket(Reference Escaron, Meinen and Nitzke8–Reference Milliron, Woolf and Appelhans10,Reference Glanz, Bader and Iyer12,Reference Heilman, Lakishyk and Radas14) or cafeteria settings(Reference Schwartz11,Reference Glanz and Yaroch13) . In addition, compared with past work(Reference Gittelsohn, Dyckman and Frick9,Reference Milliron, Woolf and Appelhans10,Reference Heilman, Lakishyk and Radas14,Reference Olstad, Goonewardene and McCargar15) , our study had a relatively small sample size for statistical analysis. Future work in this area should test these strategies in a larger sample of food trucks with a randomised design to further understand the extent to which their effectiveness aligns with findings from other settings.
Compared with eating in more traditional FAFH settings such as restaurants, eating from a food truck appeared to be an infrequent behaviour among participants, as the majority of our sample indicated that they eat from a food truck only a few times a year. Although reported consumption of foods from food trucks was less frequent among this sample, the food truck industry is witnessing significant growth, illustrating that the consumption of foods in these settings is becoming more prevalent overall(23). The rapid growth of the food truck industry parallels that of various other FAFH settings, demonstrating that individuals consume foods from a wide variety of settings, whether that be from a restaurant or a food truck. From a public health perspective, it is possible that small changes across the variety of settings where individuals purchase and consume food could add up to have a meaningful impact across patrons and settings(Reference Hill, Wyatt and Reed34,Reference Hill35) . In addition, the effects of an intervention in one setting may affect the eating behaviours of individuals in other settings(Reference Hill, Wyatt and Reed34,Reference Hill35) . For example, if a patron at a food truck event orders a healthy option after receiving a free sample, that person may be more likely to make a healthy choice later on in a supermarket or restaurant or they may be more likely to eat less healthfully, having already made one healthy choice for the day. Future research following participants at the individual level could shed light on such possibilities, further elucidating to the effectiveness of taste testing and point-of-purchase prompting strategies.
The results of this initial study should be interpreted in the context of its limitations. First, the current study was conducted with a relatively small sample of food trucks from one location. Therefore, our intervention cannot be analysed by food type (e.g. appetiser, dessert or main dish), and results may not generalise to other food trucks or geographic locations. In addition, our study did not have a control group; consequently, we cannot be certain that the intervention caused observed changes in relative sales of healthy options. Convenience sampling is also a limitation of the survey portion but does not affect the sales data, which represented all food items sold from the participating trucks. The survey portion is also subject to the usual limitations of self-report measures, such as social desirability bias and potential under-reporting (e.g. of eating food from restaurants or food trucks). A lack of specificity in responses to open-ended questions about foods purchased precludes the examination of purchasing data within the survey sample specifically.
Conclusion
While previous research has assessed taste testing and point-of-purchase prompting in various settings, to our knowledge, this is the first study to test the feasibility of these strategies to promote healthy choices at a recurring food truck event. Findings from this initial study can inform future research that seeks to increase the consumption of healthier food items in novel FAFH settings. Additional research with food trucks can shed more light on the extent to which the effectiveness of these strategies in this setting is similar to or different from other FAFH settings, such as restaurants and supermarkets and can build upon initial evidence supporting the implementation, acceptability and initial effectiveness of taste testing and point-of-purchasing prompting interventions at food truck events. Other considerations for research and practice include the challenges of identifying healthy options that are feasible for food trucks to offer, meet nutritional criteria and are appealing to patrons.
Future work should examine the appeal of different food samples prior to enacting interventions, given the importance of taste as a motivator for food choice, offering the potential to reach more patrons with the free samples. In addition, examining the feasibility and effectiveness of the intervention without reimbursement for the cost of free samples would be of interest. Given the secular increases in FAFH, continued research in this area is important to identify ways to extend efficacious healthy eating intervention approaches to a wider variety of FAFH settings with an overarching goal to promote healthier eating in ways that fit with current lifestyles and offer the opportunity for cumulative effects across varied settings.
Acknowledgements
Acknowledgements: The authors thank the food trucks (The Cheesecake Guy, The Cheesy Chick, Chef’s Mobile Kitchen, Fat Bob’s Smokehouse, The Great Aussie Bite, Ru’s Pierogi and Sweet Melody’s) and event patrons for participating in the study, the research assistants for their assistance with study execution and the Larkin Square Development Corporation for use of the study location. In addition, the authors thank Dr Gregory Wilding for statistical consulting. Financial support: Funding for the current study was provided by the University at Buffalo Honors College and the Independent Health Foundation. Dr Gregory Wilding provided statistical consulting via the Clinical and Translational Science Institute at the University at Buffalo. As such, the research reported in this publication was also supported by the National Center for Advancing Translational Sciences of the National Institutes of Health under award no. UL1TR001412. The content is solely the responsibility of the authors and does not necessarily represent the official views of the NIH. Conflict of interest: There are no conflicts of interest. Authorship: J.B., A.G., K.K. and S.A.F. designed the study. J.B. and S.A.F. performed the research and analysed the data. J.B. drafted the manuscript and all authors provided critical feedback. Ethics of human subject participation: The current study was conducted according to the guidelines laid down in the Declaration of Helsinki, and all procedures involving study participants were approved by the University at Buffalo Intuitional Review Board. Verbal informed consent was obtained from all subjects/patients. Verbal consent was witnessed and formally recorded.
Supplementary material
For supplementary material accompanying this paper visit https://doi.org/10.1017/S1368980020002815


