


The role of food packaging in the current food system exceeds its original and basic functions related to containment, protection and convenience(Reference Pal, Devrani and Hadush1). According to CODEX Alimentarius, food packages should compulsorily include the following information: name of the food, list of ingredients, net content, name and address of the manufacturer, packer, distributor, importer, exporter or vendor, country of origin, lot identification, instructions for use when applicable, compulsory nutritional information and irradiated foods declaration(2).
Apart from compulsory information, food companies voluntarily include information to advertise products, set them apart from their competitors, attract consumers’ attention, shape product associations and influence purchase decisions(Reference Ares, Velázquez and Vidal3). Particularly, a wide range of textual and visual cues on food packages are included to raise health-related associations and convey the idea that products are healthful(Reference Christoforou, Dachner and Mendelson4,Reference van Buul and Brouns5) . Health claims are one of the most frequently included health-related cues. They can be defined as ‘any representation that states, suggests, or implies that a relationship exists between a food or a constituent of that food and health’(6). These claims include nutrient function claims, other function claims and reduction of disease risk claims(6). These claims are regulated in most countries to ensure that only substantiated claims are included on food packages(Reference van Buul and Brouns5,Reference Hieke, Kuljanic and Pravst7) .
In addition, research has shown that food companies also include other type of claims, known as nutrition marketing claims, at their own discretion, regardless of the nutritional composition of products(Reference Christoforou, Dachner and Mendelson4,Reference Schermel, Emrich and Arcand8) . Such claims include those related to nutrient content (e.g. ‘contains n 9’) or specific ingredients (e.g. ‘without preservatives’, ‘with natural probiotics’)(Reference Christoforou, Dachner and Mendelson4,Reference Hieke, Kuljanic and Pravst7,Reference Schermel, Emrich and Arcand8) . Other studies have shown that package design features (e.g. drawings, typography, colours) can also convey health-related associations(Reference Ares, Piqueras-Fiszman and Varela9–Reference Tijssen, Zandstra and De Graaf14). Images have been reported to be more influential than textual information due to their higher saliency and lower requirement of cognitive resources, as well as their ability to create more vivid associations(Reference Gil-Pérez, Rebollar and Lidón15,Reference Varela, Antúnez and Cadena16) .
There is evidence suggesting health-related cues can generate misperceptions about the nutritional quality of products, making them appear healthier than they actually are(Reference Kaur, Scarborough and Rayner17). Several studies have reported that the inclusion of nutrient claims, nutrition marketing claims, images of natural foods (e.g. fruits, vegetables or grains), references to home-made foods on food packages, as well as green colour, increases consumer perceived healthfulness as well as consumer purchase intention(Reference Ares, Velázquez and Vidal3,Reference Devia, Forli and Vidal18–Reference van Trijp and van der Lans24) . The inclusion of health-related cues on the packages of processed and ultra-processed products with excessive content of nutrients associated with non-communicable diseases (NCD) has stressed the need to develop stricter packaging regulations(Reference Ares, Velázquez and Vidal3,Reference Christoforou, Dachner and Mendelson4,Reference Devia, Forli and Vidal18,Reference Al-Ani, Devi and Eyles25) .
Uruguay is a high-income country with one of the highest rates of overweight and obesity in all age groups in South America: 65 % among adults, 39 % among school-aged children and 12 % among children aged 0–4 years(26). Consumption of processed and ultra-processed products with excessive content of sugar, fat and sodium has been identified as one of the primary causes of malnutrition(27). According to a report published by the Pan American Health Organization, Uruguay showed the largest increase in the sales of ultra-processed products in Latin America between 2000 and 2013 (146 %)(28). Local regulations establish that food packages should include the following information in Spanish (the official language): list of ingredients, nutrient declarations, country of origin, expiration date, net weight, the full name and address of the manufacturer and importer, and preparation instructions (if needed)(29). In addition, from February 2021 products with added sugars, fat and/or sodium that exceed pre-established limits for sugars, fat, saturated fat and sodium should include black octagonal warning labels on the front of the package(30). The inclusion of nutrition and health claims is regulated to assure that substantiated benefits of the products are highlighted by manufacturers(29). However, no regulations have been introduced on other health-related cues or on the type of products that can carry nutrition and health claims.
In this context, the present research aimed to explore: (i) the use of health-related cues on the packages of processed and ultra-processed products sold in the Uruguayan marketplace and (ii) the relationship between such cues and the nutritional composition of the products. Results are expected to contribute to an in-depth understanding of the strategies used by food companies to communicate the concept of health on packages to inform the development of public policies aimed at protecting consumers’ right to information and health.
Methods
Sampling
Four supermarkets corresponding to the four most important chains in terms of market share and number of units in the country were chosen as sites of data collection(31). These supermarkets were located in two cities: Montevideo, the capital city of Uruguay (1.318.755 inhabitants), and Maldonado (62.590 inhabitants).
Data collection
The survey took place between November and December 2020, with the participation of five data collectors. Focus was placed on processed and ultra-processed products, defined according to the NOVA food classification system as products added with sugars, fat and/or sodium(Reference Monteiro, Cannon and Moubarac32). The following thirty-four categories were considered: alfajor (traditional Uruguayan product which consists in a sweet cookie sandwich filled with a layer of dulce de leche – a traditional type of sweetened condensed milk – usually covered with chocolate or meringue), breakfast cereals and granola, canned food, cereals bars, cheese, chocolate and candies, cookies, dairy desserts, dressings and condiments, frozen foods (this category includes all frozen foods like ready-to-eat dishes, hamburgers, nuggets, pasta, fried potatoes, etc. with the exception of ice cream, desserts, vegetables or fruits), ice cream and popsicles, instant soups and bouillon, jams, juices, nuts and seeds, packaged dry or fresh pasta, plant-based milks, powder mix to prepare desserts and cakes, powdered drinks, salty baked goods, sausages and cold cuts, savory crackers, savory snacks, soft drinks, sweet baked goods, yogurt, doughs, cakes, tomato puree and sauces, coffee and cocoa, beverages, flavoured rice and instant puree, butter and margarine and flavoured milk.
Within each product category, all the available products were surveyed. Data from each product were collected using a cell phone app specially developed for this survey which scanned the barcode of products and registered three photographs: front of package, nutrition declaration and ingredient list (both compulsorily included on food packages according to Uruguayan legislation). A short training of data collectors was performed to ensure the standardisation of data collection procedures. The information was available during the survey in an online database. If the same product was available in more than one supermarket, it was included only once in the database.
For all products included in the sample, the product name, company name, brand name, net weight, ingredients, nutrition information as well as portion size were exported manually from the photographs in the web base to a spreadsheet by three of the researchers. The consistency of the database was checked using the recorded information of 5 % of the labels.
Data analysis
In order to organise the information, data analysis started by classifying the products scanned into the thirty-four categories considered. Products were considered unique if they differed in at least one of the following product characteristics: bar code, product name, company name, brand name and net weight. From the nutrition information of each product, the content of energy, protein, total fat, saturated fat, carbohydrates, sugar, fibre and sodium were calculated per 100 g or ml of product. Considering that the sugar content of products should not be compulsorily informed on the labels of food products in Uruguay, it was estimated using the algorithm developed by Scapin et al.(Reference Scapin, Yu Luoie and Pettigrew33). This algorithm establishes a series of criteria to estimate the added sugar content based on the information provided on the label of the product or similar products.
All the information included on the front-of-packages was manually coded using content analysis based on deductive–inductive coding(Reference Krippendorff34). Three coders with previous experience in content analysis independently coded the data. First, the following nine dimensions of health-related cues were deductively selected based on previous studies identifying visual and textual packaging cues associated with food healthiness: green colour, food pictures, references to naturalness, critical nutrient claims, other nutrition claims, nutrition marketing claims, ingredient claims, endorsement from non-governmental organisations (NGO) and references to tradition/homemade(Reference Ares, Piqueras-Fiszman and Varela9,Reference Karnal, Machiels and Orth12,Reference Machín, Antúnez and Curutchet35,Reference Duran, Zancheta and Mais36) . A description of each dimension and examples is shown in Table 1. An inductive approach was used to identify categories within each of the dimensions. The coders identified the categories as they emerged when examining the food labels. Binary variables were created for each of the categories denoting whether each of the labels contains elements related to the category or not (0/1). After the three coders independently coded the data, a meeting was held to define the final categories were established by consensus. Examples of the visual and textual images included in each category are shown in Table 2. The content analysis was performed in Spanish and dimensions, categories, as well as examples were translated into English for publication.
Table 1. Description of the type of elements included in each dimension considered in the content analysis of the front-of-packages

Table 2. Number and percentage of products featuring elements within the categories identified in the content analysis of products’ front-of-packages for the nine health-related cues dimensions

The number of products that included elements in the front of package label within each category was determined. The χ 2 test was used to compare the frequency of inclusion of elements within the categories of each of the dimensions across product categories. Additionally, correspondence analysis (CA) was used to obtain a simplified graphical representation of the association between product categories and health-related cues dimensions. This analysis provided a bi-dimensional representation of the similarities and differences between categories and dimensions.
In order to explore the relationship between the use of health-related cues on food packages and the nutritional composition of products, the content of sugar, fat, saturated fat and sodium of each product was classified into excessive or not according to the nutrient profile model underlying the Uruguayan front-of-package nutrition labelling regulation, which was not in force at the time of the study(30). With that aim, the following thresholds were considered for excessive content of nutrients for products with added sugar, fat and/or sodium: excess of sugar (>3 g/100 g and energy content from sugar > 20 %), excess of fat (energy content from fat > 35 %), excess of saturated fat (energy content from saturated fat > 12 %) and excess of sodium (>500 mg/100 g or sodium/ energy content > 1,9mg/kJ (8mg/kcal))(30).
Then, a new variable (y) indicating whether each product from the database was excessive in at least one of the critical nutrients associated with NCD (y = 0) or not (y = 1) was created. A gradient boosting model (GBM) was built to explore the association of the dimensions of health-related cues identified in the packages on the new variable y (Reference Hastie, Tibshirani and Friedman37). GBM are supervised machine learning models based on the combination of several decision trees, which enable to predict a response variable from several categorical and/or continuous explanatory variables. They are able to model both linear and non-linear responses, which make them suitable to explore complex processes and are not affected by the inclusion of irrelevant predictor variables(Reference Hastie, Tibshirani and Friedman37).
The analysis involved two main steps: optimisation and fitting. For this purpose, the dataset was randomly split into a training (75 %, n = 2861) and a test set (25 %, n = 952). A stratified partition was used to guarantee that both the training and the test sets had the same proportion of positive (y = 1) and negative (y = 0) cases as in the complete database. Using the training set, a set of hyper-parameters was optimised to improve the GBM model’s predictive performance while avoiding overfitting to the training data, as in most machine learning methods(Reference Hastie, Tibshirani and Friedman37,Reference Elith, Leathwick and Hastie38) . For this purpose, the following hyper-parameters were systematically varied for model optimisation: number of trees (total number of trees to fit in the model; nt = (30, 60, 90, 120, …, 6000)), learning rate (accounts for the contribution of each tree to the model; lr = (0·001, 0·005, 0·01, 0·05)), tree complexity (accounts for the model complexity in terms of the maximum interaction between predictive variables allowed; tc = (1, 2, 3, 5, 9)) and the minimum number of observations in the terminal nodes of the trees (nmon = (5, 10)). Several GBM models were fitted using the training set through a cross-validation approach considering the AUC as the metric indicating the predictive performance of the models. AUC ranges from 0·5 to 1, being 1 a perfect prediction while 0·5 means random performance(Reference Hanley and McNeil39). The best combination of hyper-parameters was the one that provided the largest cross-validation AUC value. After setting the hyper-parameters, the training set was used to fit the final model and its quality of the model was assessed using the AUC value. In order to interpret the final GBM model, variable importance (i.e. the contribution of each explanatory variable to the prediction of the response variable) and partial dependence plots (i.e. dependence of the response on a set of explanatory variables after accounting for the average effect of the rest of the predictor variables included in the model) were used(Reference Hastie, Tibshirani and Friedman37,Reference Elith, Leathwick and Hastie38) . A model-agnostic permutation method was used to compute variable importance of each explanatory variable(Reference Fisher, Rudin and Dominici40), and the relative contribution of each variable to the model was obtained by scaling the variable importances to sum up to 100.
All data analyses were carried out using R statistical software version 4.1.0(41). FactoMineR was used to run the CA(Reference Lê, Josse and Husson42). Packages gbm(Reference Greenwell, Boehmke and Cunningham43) and caret(Reference Kuhn44) were used to build the models and select the hyper-parameters. Package vivid(Reference Inglis, Parnell and Hurley45) was used to compute and visualise variable importance and partial dependence plots for the final GBM model.
Results
A total of 3813 unique products were surveyed across the thirty-four product categories (Table 3). Chocolate and candies was the category with the largest number of products (n = 438; 11·5 %), followed by cookies (n = 330; 8·7%), frozen foods (n = 237; 6·2%), canned foods (n = 216; 5·7%) and savory crackers (n = 195; 5·1%).
Table 3. Number of products identified in each product category

* Frozen foods: this category includes all frozen foods like ready-to-eat dishes, hamburgers, nuggets, pasta, fried potatoes, etc., with the exception of ice cream, desserts, vegetables or fruits.
** Alfajor is a traditional product in Uruguay. It is a sweet cookie sandwich filled with a layer of dulce de leche (a traditional type of sweetened condensed milk), usually covered with chocolate or meringue.
Health-related cues on food packages
Results showed that 2547 products presented at least one health-related cue on the package (67 % of all the surveyed products). Table 2 shows the percentage of products featuring elements within the categories and dimensions identified in the deductive–inductive coding.
Food pictures, involving culinary ingredients, natural and minimally processed foods, were the most frequent health-related cues, being identified in 39 % of the packages. Within this dimension, pictures of fruits and vegetables were the most prevalent, accounting for 17·1 % and 14·9 % of the packages, respectively. References to naturalness were found in 23 % of the products. In particular, botany elements (e.g. grass, flowers or leaves) were the most frequent within this dimension (12·5 %). Another common reference to nature and healthfulness was the use of green colour on the packages. This strategy was found on 13 % of the packages.
Nutrient claims were also frequently found on food packages (Table 2). Claims related to critical nutrients were identified in 16 % of the products. Within this dimension, claims referring to the absence of sugar (e.g. ‘0 % sugar’) and the absence of trans-fat (e.g. ‘0 % trans-fat’) were the most prevalent, followed by claims related to reduced energy and fat content (Table 2). In addition, claims related to other non-critical nutrients were found in 9 % of the products and were mainly related to the content of vitamins or fibre presence as well as the absence of cholesterol.
Nutrition marketing claims were found in 12 % of the products. Most of the claims were related to the absence of gluten in products (e.g. ‘gluten free’), followed by references to energy content (e.g. ‘only 30 kcal/toast’), explicit references to health (e.g. ‘healthy eating’), probiotics (e.g. ‘probiotics added’) and health-related brand names or slogans (e.g. ‘simply good’) (Table 2). Ingredient claims were found in 11 % of the packages. This dimension was mainly composed of claims related to the absence of food preservatives (6·3 % of products) followed by references to specific ingredients (e.g. ‘100 % fruit juice’) or the absence of colourings (e.g. ‘no artificial colour’).
The last two types of health-related cues were endorsement from NGO (e.g. ‘ACELU logo’ – the Spanish acronym for the Uruguayan Celiac Association), found on 8 % of products, and references to tradition/homemade (e.g. ‘traditional’, ‘homemade’), which appeared on 7 % of the products (Table 2).
Prevalence of health-related cues per product category
As shown in Fig. 1, the prevalence of health-related cues largely differed across product categories, ranging from 100 to 17 %. In particular, all products within the categories beverages, flavoured rice and instant puree, powdered drinks and plant-based milks included at least one health-related cue on front of package. Additionally, there were other product categories where the great majority of products featured health-related cues: juices (98·7 %), yogurt (96·3 %), tomato puree and sauces (96·3 %), instant soups and bouillon (95·7 %), salty baked goods (93·4 %), breakfast cereals and granola (91·7 %) and jams (91·7 %). On the other hand, the food categories cakes (16·7 %), alfajor (23·5 %), sweet baked goods (37·4 %) and ice cream and popsicles (38·0 %) showed the lowest percentage of products featuring health-related claims. The percentage of products featuring health-related cues within each of the dimensions identified in the deductive–inductive coding is shown in an online Supplementary Table S1.
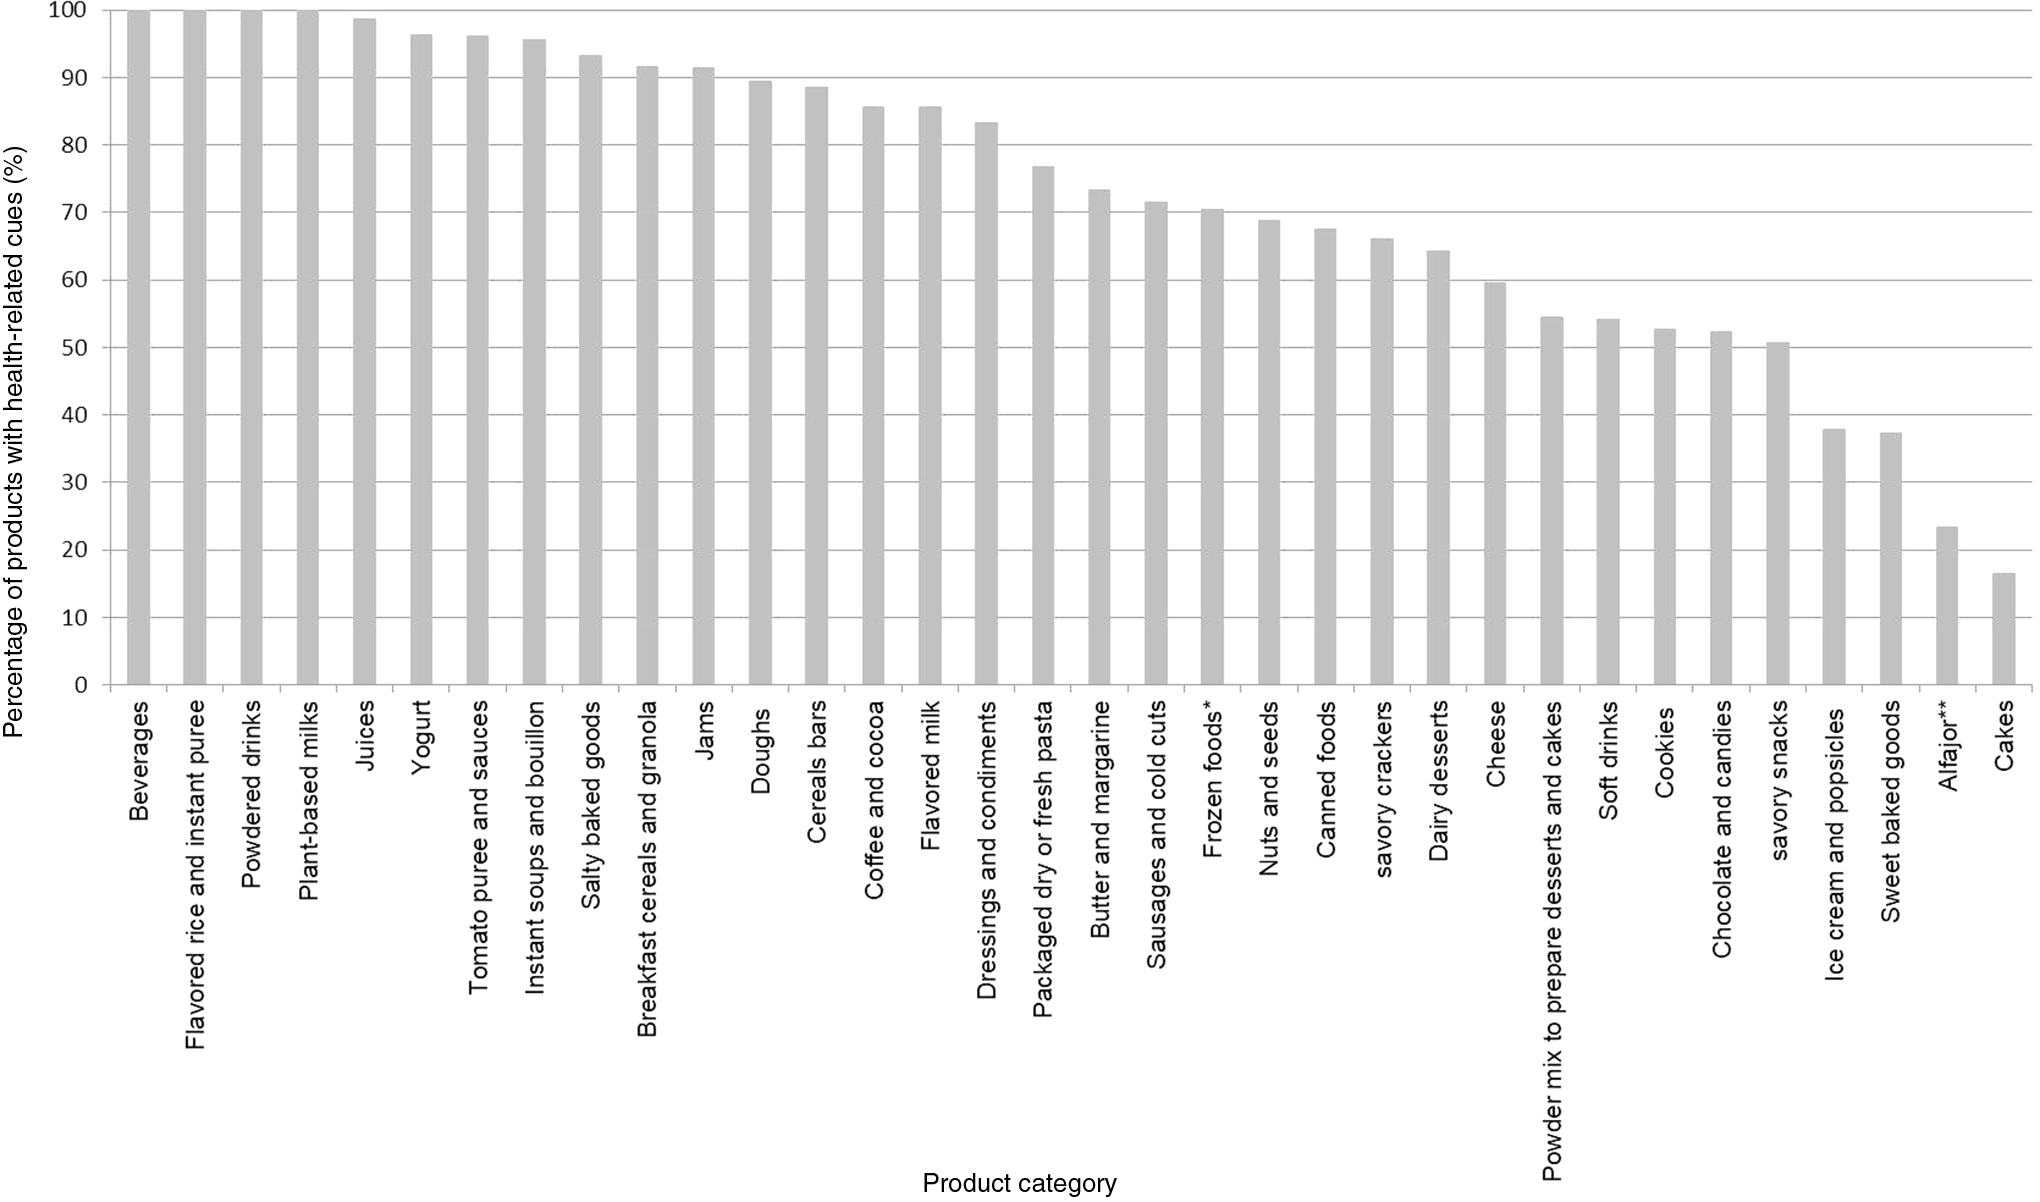
Fig. 1. Percentage of products with health-related cues per product category. *Frozen foods: this category includes all frozen foods like ready-to-eat dishes, hamburgers, nuggets, pasta, fried potatoes, etc., with the exception of ice cream, desserts, vegetables or fruits. **Alfajor is a traditional product in Uruguay. It is a sweet cookie sandwich filled with a layer of dulce de leche (a traditional type of sweetened condensed milk), usually covered with chocolate or meringue.
Results from the χ 2 test showed a significant association between product categories and the inclusion of the different types of health-related cues (χ 2 = 1889·2, P < 0·001). CA was used to visualise the relationship between product categories and the nine dimensions of health-related cues identified in the content analysis (Fig. 2). The first and second dimension of the CA explained 53·6 % of the inertia of the experimental data and showed an association between the inclusion of endorsements from NGO and several product categories: sausages and cold cuts, dairy desserts, flavoured milk, powder mix to prepare desserts and cakes, and butter and margarine. Additionally, these two dimensions also showed an association between categories such as savory crackers, salty baked goods and powdered drinks and the health-related cues critical nutrient claims and other nutrient claims.
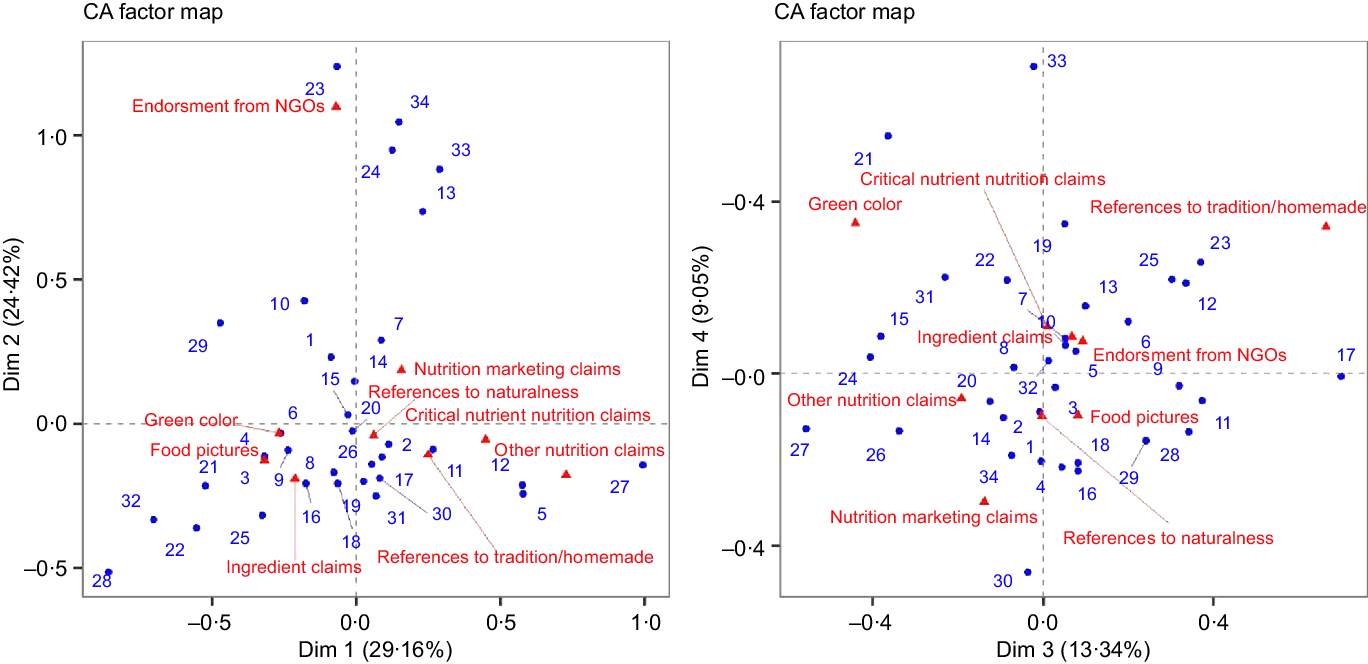
Fig. 2. Representation of the food categories and health-related cues included in the first four dimensions of the correspondence analysis. 1. Chocolate and candies; 2. Cookies; 3. Frozen foods*; 4. Canned foods; 5. Savory crackers; 6. Savory snacks; 7. Cheese; 8. Juices; 9. Dressings and condiments; 10. Ice cream and popsicles; 11. Sweet baked goods; 12. Salty baked goods; 13. Powder mix to prepare desserts and cakes; 14. Jams; 15. Yogurt; 16. Nuts and seeds; 17. Alfajor**; 18. Breakfast cereals and granola; 19. Soft drinks; 20. Cereals bars; 21. Instant soups and bouillon; 22. Packaged dry or fresh pasta; 23. Sausages and cold cuts; 24. Dairy desserts; 25. Doughs; 26. Plant-based milks; 27. Powdered drinks; 28. Cakes; 29. Tomato puree and sauces; 30. Coffee and cocoa; 31. Beverages; 32. Flavoured rice and instant puree; 33. Butter and margarine; 34. Flavoured milk. *Frozen foods: this category includes all frozen foods like ready-to-eat dishes, hamburgers, nuggets, pasta, fried potatoes, etc., with the exception of ice cream, desserts, vegetables or fruits. **Alfajor is a traditional product in Uruguay. It is a sweet cookie sandwich filled with a layer of dulce de leche (a traditional type of sweetened condensed milk), usually covered with chocolate or meringue.
The third and fourth dimensions of the CA also showed associations between some types of health-related cues and specific product categories (Fig. 2). The use of green colour was more prevalent for products within the instant soups and bouillon cubes category. In addition, references to tradition and homemade were associated with the categories alfajor, sausages and cold cuts, salty baked goods and doughs.
Association of health-related cues with product nutrition composition
Seventy-six percentage of the products in the database had excessive content of at least one critical nutrient according to the nutrient profile model underlying the Uruguayan front-of-package regulation. Results showed that 45 % of products had excessive content of sugar, 32 % excessive content of fat and 31 % excessive content of saturated fat, while 23 % showed excess of sodium.
The association of health-related cues on product packages with product nutrition composition was explored using a GBM model. A variable indicating whether each product was excessive in at least one of the critical nutrients associated with NCD (y = 0) or not (y = 1) was used as the response for the model. The set of hyper-parameters that yielded the best cross-validation predictive performance was nt = 5040, lr = 0·001, tc = 9 and nmon = 10. The final model presented an AUC computed on the independent test dataset of 0·702, meaning that its ability to predict if the products did not have excess of any of the critical nutrients associated with NCD or not was limited. In fact, from the observations in the test set that were predicted as not excessive in any of the critical nutrients ( ${{y}}\hskip-1.5{^{\hat}}$
= 1) only 20·6 % were correct.
${{y}}\hskip-1.5{^{\hat}}$
= 1) only 20·6 % were correct.
The relative variable importance of all the explanatory variables in the final model was computed. Critical nutrient claims were the health-related cues with the greatest importance for predicting if products did not have excessive content of any of the critical nutrients, followed by references to naturalness. The relative variable importance of these variables was 28·3 and 20·1 %, respectively. The partial dependence plots showed that the presence of both health-related cues increased the likelihood of not having excessive content of any of the critical nutrients associated with NCD (not shown). The relative importance of the dimensions green colour, food pictures, ingredient claims and nutrition marketing claims ranged between 13·1 % and 7·6 %, while the remaining three dimensions (endorsement from NGO, other nutrition claims and references to tradition/homemade) presented relative variable importance of less than 5 %.
Discussion
The information included on food packages has a crucial role in influencing consumer associations and purchase decisions(Reference Ares, Velázquez and Vidal3). In this context, the present work aimed at providing insights for policy making by exploring the use of health-related cues on the packages of processed and ultra-processed products sold in the Uruguayan marketplace. Results showed that these cues were frequently included on the food packages, in agreement with results reported by Christoforou et al. (Reference Christoforou, Dachner and Mendelson4) when analysing the packages of products commercialised in Canada.
The highest prevalence of health-related cues was found on beverages, flavoured rice and instant puree, powdered drinks and plant-based milks, followed by juices, yogurts, tomato puree and sauces, instant soups and bouillon, salty baked goods, breakfast cereals and granola and jams. Within these categories, most products were ultra-processed products with excessive content of nutrients related to NCD. Considering that these products are not recommended as part of a healthy diet by the Uruguayan dietary guidelines(27), stricter labelling regulations for processed and ultra-processed products with excessive content of nutrients associated with NCD are needed.
Food pictures, mostly depicting fruits and vegetables, were the most prevalent health-related cue. This kind of visual cue has been reported to increase healthfulness perception and purchase intention(Reference Ares, Aschemann-Witzel and Curutchet46–Reference Simmonds and Spence49). Results from the present work showed that pictures of fruit and vegetables were frequently included on food packages even if they only included flavourings. The analysis of the list of ingredients of products featuring pictures of fruits revealed that 25 % of these products did not include any fruit as ingredient but fruit flavourings and, 38 % of the products featuring a picture of vegetables did not include any vegetable as ingredient. This result is particularly relevant considering that most labelling regulations worldwide, including Uruguayan food packaging regulations, do not include specific requirements on the quantity of natural ingredients a product should contain to include pictures on the label(50). In recent years, some labelling regulations have changed in order to protect consumers from deceptive information(Reference Bergallo, Castagnari and Fernández51,Reference Zhang, Liu and Liu52) . For example, according to the European Quantitative Ingredient Declarations, when labels include a text or picture of an ingredient, the quantity of that ingredient should be declared in the list of ingredients(53). Although this regulation can provide consumers information about the quantity of the ingredients, it does not take into account the fact that consumers do not make an in-depth processing of the information included on the labels and rarely read the back-of-package at the point-of-purchase(Reference Machín, Curutchet and Gugliucci54). In this sense, in 2019 the Academy of Nutrition and Dietetics recommended to the Food and Drug Administration to introduce regulations on the inclusion of images of healthy ingredients on the labels of products that contain insignificant amount of such ingredients as part of its Nutrition Innovation Strategy(55).
Results also showed the frequent inclusion of health-related cues related to production methods, such as references to naturalness, home-made and traditional foods on the packages of processed and ultra-processed products. In particular, the highest prevalence of references to naturalness was found on product categories containing ingredients derived from fruits, vegetables and grains (e.g. jams, juices, plant-based beverages, powdered drinks and yogurt). Meanwhile, salty baked goods, savory crackers, juices and dressings and condiments were the categories with the highest prevalence of references to traditional and home-made foods. Similarly, Machado et al.(Reference Machado, dos Antos and Uggioni56) reported the frequent inclusion of terms such as ‘homemade’ and ‘traditional’ on the packages of processed products commercialised in the Brazilian marketplace. The inclusion of images and words related to small-scale or domestic production has also been reported in the European marketplace(50). The inclusion of these cues can be related to new public health recommendations related to the consumption of natural and minimally processed foods and home-made culinary preparations(27,Reference Monteiro, Cannon and Moubarac57) . A recent research by Devia et al. (Reference Devia, Forli and Vidal18) showed that the inclusion of references to home-made and images of natural foods on the labels of ultra-processed products can increase perceived healthfulness and purchase intention. This stresses the need to introduce changes in local and international labelling regulations to ensure that visual and textual information on food labels do not mislead consumers about the nature, composition or production method of processed food products. In this sense, although the European Food Information to Consumers refers to the inclusion of misleading information, only a few countries have introduced specific regulations about the inclusion of references to nature and home-made production(50,58) .
Food packages frequently included regulated nutrient claims: 16 % included nutrient claims related to critical nutrients, whereas 9 % included nutrient claims related to other nutrients (e.g. vitamins, fibre, minerals). Similar results have been reported by Hieke et al. (Reference Hieke, Kuljanic and Pravst7) and Schermel et al.(Reference Schermel, Emrich and Arcand8) for products commercialised in five European countries and Canada, respectively. In the present work, nutrient claims related to fat content (trans-fat, total fat and saturated fat) were the most frequent, followed by nutrient claims related to sugar. The relevance of claims related to fat is consistent with the emphasis given for decades to fat as dietary cause of CHD(Reference Kearns, Schmidt and Glantz59). Despite the emphasis on reducing sugar and sodium intake in the Uruguayan dietary guidelines(27), claims related to these nutrients were only found in a small proportion of products. In addition, disease risk reduction claims were not found despite the great attention given by the food industry to these claims(Reference Tollin, Erz, Vej, Bagchi and Nair60). Similar results have been reported in Europe and Canada(Reference Hieke, Kuljanic and Pravst7,Reference Schermel, Emrich and Arcand8) . Regarding Uruguay, some years before, Giménez et al.(Reference Giménez, de Saldamando and Curutchet61) showed similar results when focused on products targeted at children. The low prevalence of disease risk reduction claims can be related to the strong scientific evidence needed to substantiate them(Reference Domínguez Díaz, Fernández-Ruiz and Cámara62,Reference Kusar, Žmitek and Lähteenmäki63) .
Apart from regulated claims, 12 % of the packages included nutrition marketing claims, including references to energy content, explicit references to health, energy or hydration, as well as endorsements from NGO. These claims have also been shown to influence consumer healthiness perception(Reference Nobrega, Ares and Deliza19), which can increase purchase and consumption intention.
The exploration of the relationship between the inclusion of health-related cues on food packages and nutritional composition using GBM provided a model with limited predictive ability. This suggests that health-related cues are not a good predictor of the nutritional quality of processed and ultra-processed products across categories, stressing the need for stricter labelling regulations. Similarly, Maschkowski et al. (Reference Maschkowski, Hartmann and Hoffmann64) showed that the presence of health and/or nutrition claims did not have a significant effect on the nutrient profile of highly processed ready-to-eat cereals.
Among the different cues included in the model, critical nutrient claims had the greatest importance for predicting if products did not have excessive content of any of the critical nutrients according to the Uruguayan front-of-package regulation. This matches expectations as nutrient content claims are regulated in Uruguay(65). However, it is worth noting that these claims were also available on products with excessive content of nutrients related to NCD. In a previous study, Duran et al.(Reference Duran, Zancheta and Mais36) reported that products with high content of critical nutrients showed nutrition claims more frequently than products with low content of critical nutrients. Taken together, results from the present work and previous studies suggest the need to introduce restrictions on the use of nutrient claims according to the nutritional composition of products, as currently done in several countries across the globe, including Argentina, Mexico, Australia and New Zealand(50,66–69) .
In summary, results from present work stress the need for stricter labelling regulations for processed and ultra-processed foods with excessive content of nutrients associated with NCD. Regulations should consider limiting the use of visual and textual elements that convey positive health-related associations, such as references to natural foods like fruits or green colour, not regulated nutrition claims, nutrition marketing claims, references to home-made production or tradition, as well as any other element than can increase perceived healthfulness.
Strengths and limitations of the study
The present research provided a comprehensive overview of the prevalence of a wide range of health-related cues on the packages of processed and ultra-processed products. Results extend the existing literature on the prevalence of health and nutrition claims (e.g. Hieke et al.; Schermel et al.)(Reference Hieke, Kuljanic and Pravst7,Reference Schermel, Emrich and Arcand8) and references to homemade and traditional on food packages(Reference Machado, dos Antos and Uggioni56). Although this research evaluated a large number of products commercialised in the Uruguayan marketplace, some limitations must be considered. First of all, results only refer to the products commercialised in the Uruguayan marketplace. Second, although all processed and ultra-processed products sold in four of the largest supermarket chains in the country were surveyed, data collection was limited to Montevideo and Maldonado and thus may not be completely representative of all products commercialised in the country. However, it should be noted that food products are relatively standardised across the Uruguayan marketplace. Finally, the influence of health-related cues on consumer perceived healthiness and purchase intention was not assessed. Albeit extensive research on the influence of claims on consumer perception has been conducted(Reference Lähteenmäki70), experimental evidence on the influence of other cues, such as images and references to homemade, is still scarce. Future studies should address this research gap to identify priorities for policy making.
Conclusion
Health-related cues are widely used as a marketing strategy on processed and ultra-processed products commercialised in the Uruguayan marketplace, regardless of their nutritional composition. Although the inclusion of some cues is regulated worldwide, these results stress the need for stricter labelling regulations to protect consumers from misleading information and encourage healthy eating habits. The experience of anti-tobacco policies should serve as example for policy making.
Acknowledgements
Financial support was obtained from Comisión Sectorial de Investigación Científica (Universidad de la República, Uruguay), Espacio Interdisciplinario (Universidad de la República, Uruguay) and Instituto Nacional de Alimentación (Uruguay). The funding organisations were not involved in the design/conduct of the study, collection/analysis/interpretation of the data and preparation/review/approval of the manuscript.
F. A., L. V.: conceptualisation, methodology, data curation, formal analysis, writing – original draft, writing – review and editing; L. M.: methodology, formal analysis, writing – review and editing; L. A. and A. G.: conceptualisation, methodology, writing – review and editing; M. R. C.: conceptualisation, writing – review and editing; G. A.: conceptualisation, methodology, data curation, formal analysis, writing – original draft, writing – review and editing.
The authors declare no conflict of interest.
Supplementary material
For supplementary material referred to in this article, please visit https://doi.org/10.1017/S000711452200318X


