


Obesity has become a global epidemic health problem because it is a highly prevalent and major risk factor for CVD and chronic diseases including cancer( Reference Guh, Zhang and Bansback 1 ). The recent global estimates of the WHO revealed that about 13 % (11 % of men and 15 % of women) of the world’s adult population were obese in 2016, and the worldwide prevalence of obesity increased nearly by 30% between 1980 and 2013( 2 , Reference Ng, Fleming and Robinson 3 ). The prevalence of obesity has also been increasing in Asian countries, including Korea( Reference Yoon, Lee and Kim 4 ). The obesity prevalence in Korean adults increased from 26·0 to 36·3 % in men and from 26·5 to 27·6 % in women between 1998 and 2009( Reference Kang, Shim and Lee 5 ).
Diet is a major lifestyle factor contributing to the development of obesity, and it is modifiable if properly managed( Reference Stone and Kushner 6 ). Among various dietary factors, eating frequency (EF) has been suggested as a modifiable aspect of dietary behaviour that may influence the risk of obesity( Reference Holmback, Ericson and Gullberg 7 , Reference House, Shearrer and Miller 8 ). EF is usually defined as the sum of the number of meals and snacks consumed per day( Reference Holmback, Ericson and Gullberg 7 , Reference Bachman, Phelan and Wing 9 ). There have been many previous studies that have investigated the relationship between EF and obesity, but the results have been inconsistent thus far. A previous prospective study reported that decreased EF is predictive of greater 10-year increases in BMI and waist circumference (WC)( Reference Ritchie 10 ). A cross-sectional study also suggested that higher EF is associated with lower WC and reduced cardiometabolic risk factors, including fasting glucose, total cholesterol, LDL cholesterol and TAG, and that these associations are mediated by WC( Reference Smith, Blizzard and McNaughton 11 ). Another study revealed that increased EF is related to lower BMI and WC in overweight Hispanic youth( Reference House, Shearrer and Miller 8 ). In contrast, others reported the positive association between EF and obesity( Reference Murakami and Livingstone 12 ), or they could not detect any association( Reference Kant, Schatzkin and Graubard 13 , Reference Mills, Perry and Reicks 14 ). In particular, the body fat percentage (BF%) showed no association with EF( Reference Jennings, Cassidy and van Sluijs 15 ), or even a positive correlation with EF( Reference Yannakoulia, Melistas and Solomou 16 ). However, the factors that lead to such discrepancies between studies have not yet been clarified.
Previous studies have shown that a higher intake of fruits, vegetables, nuts and whole grains may play a protective role against obesity( Reference Fogelholm, Anderssen and Gunnarsdottir 17 ). In contrast, obesity results from a higher intake of sweets, refined bread and high-energy density food( Reference Fogelholm, Anderssen and Gunnarsdottir 17 ), which can induce an excessive energy intake (EI)( Reference Rolls, Bell and Castellanos 18 ). Korea has experienced a nutrition transition over recent years( Reference Lee and Cho 19 ). Consumption of traditional Korean diet, which is a low-fat and high-vegetable diet, has decreased, whereas consumption of bread, meat and seafood has increased, as Korea has become more westernised( Reference Lee and Cho 19 ). These changes have affected the increase of obesity prevalence( Reference Jung, Park and Choi 20 , Reference Popkin 21 ). Given that the diet quality may also play a role in the development of obesity( Reference Boggs, Rosenberg and Rodriguez-Bernal 22 , Reference Wolongevicz, Zhu and Pencina 23 ), it can be speculated that the relationship between EF and obesity might be modified by diet quality, but this issue has not been studied thus far.
Furthermore, few studies have covered the relationship between EF and obesity in Asian populations( Reference Kang, Ju and Park 24 , Reference Kim, Goh and Lee 25 ), although the typical Asian lifestyle, including diet and eating habits, differs from the typical Western lifestyle. Accordingly, the effect of EF on obesity may differ between Asian and Western populations. Therefore, in this study, we aimed to investigate the association between EF and obesity indicators including BMI, WC and BF% in a representative sample of the Korean adult population, and to determine whether the association between EF and the obesity indicators changes with diet quality.
Methods
Study population
This cross-sectional study was based on data from the 2nd and 3rd years of the Fourth Korea National Health and Nutrition Examination Survey (KNHANES IV), which was conducted by the Korean Centers for Disease Control and Prevention from 2007 to 2009. KNHANES IV is a nationwide representative study, and its target population is non-institutionalised civilians in the Republic of Korea. The sample frame was determined based on the 2005 population and housing census, and the representative households were selected using a stratified multistage clustered probability sampling design. However, family members younger than 1 year in the selected households were excluded from the survey. The survey was composed of four parts: the Health Interview Survey, the Health Behaviour Survey, the Health Examination Survey and the Nutrition Survey. All participants signed an informed consent form and the protocol was approved by the Institutional Review Board of the Korean Centers for Disease Control. The details regarding survey design and methods are specified elsewhere( 26 – Reference Lee and Park 30 ).
In the 2008 and 2009 KNHANES IV, 9744 and 10 533 individuals participated, respectively. Of the 20 277 participants, we sequentially excluded 5206 subjects younger than 19 years old; 4480 subjects without measurements for BF%, WC or BMI; 1293 subjects without nutritional data including meal frequency, snack frequency and nutrient intake; 261 subjects without data for socio-economic or lifestyle variables such as household income, education level, smoking status, frequency of alcohol consumption, physical activity, frequency of resistance exercise, stress level and depressed mood; and 2086 subjects who answered that their meal frequency was zero or that they did not eat a meal or a snack as per usual on the survey day. The data of the remaining 6951 participants (aged 19–93 years) were analysed in this study (Fig. 1).
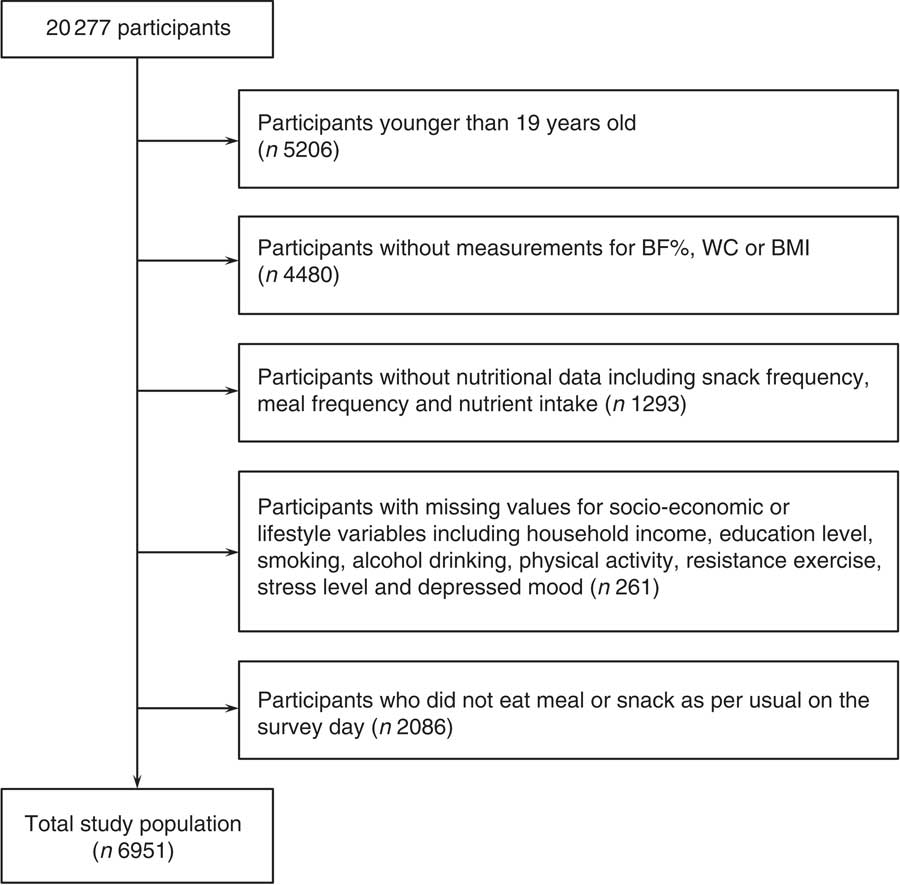
Fig. 1 Study population. BF%, body fat percentage; WC, waist circumference.
Measurement of variables
Measurement of obesity indicators
As indices of obesity, we used BF% measured by dual-energy X-ray absorptiometry (DXA), as well as WC and BMI. Trained medical staff measured height and weight by 0·1-cm units and 0·1-kg units, respectively, according to the standardised procedures at mobile examination centres. BMI was calculated as weight divided by height squared (kg/m2). WC was measured according to the WHO guideline to the nearest 0·1 cm in a horizontal plane at the level of the midpoint between the iliac crest and the costal margin at the end of a normal expiration( 31 ). Body composition status (i.e. BF%) was measured by DXA (Discovery-WTM; Hologic).
Eating frequency and nutritional measurements
EF was defined as the sum of the number of meals and snacks eaten per day as previously described( Reference Kim, Park and Yang 32 , Reference Murakami and Livingstone 33 ). Meal frequency was assessed using the following question: ‘Did you eat breakfast/lunch/dinner yesterday?’ Snack frequency was estimated using the following question: ‘How many times do you eat snacks a day?’ Although these questions have not been formally validated as measures of snack and meal frequency, similar questions have been used in other studies( Reference Kim, Park and Yang 32 , Reference Abdel-Megeid, Abdelkarem and El-Fetouh 34 , Reference Vik, Overby and Lien 35 ). Meal frequency was classified as one, two or three meals per day; snack frequency was classified as none, one, two or three snacks per day; and EF was categorised as less than three, three, four and five or more per day, as previously described( Reference Kim, Park and Yang 32 ). Categories of EF were determined by considering the distribution of each measure in the study population, ensuring adequate number in each group.
Daily energy and nutrient intake, including total EI (kJ/d (kcal/d)), fat intake (g/d), carbohydrate intake (g/d) and protein intake (g/d), were assessed on the basis of the results of the nutrition survey of KNHANES IV( 36 ). The nutrition survey was conducted in person by trained dietary interviewers, who visited participants’ homes and asked the respondents to remember in detail all the food and drinks they consumed during a period of time in the recent past (usually in the previous 24 hours). The 24-h recall method is a cost-effective and applicable dietary assessment for characterising the average population intake( Reference Karvetti and Knuts 37 ). Plastic food models, a set of measuring guides (including bowls, plates, earthen pots, jars, measuring spoons, glasses, mugs and coffee cups), shape charts (circle, ellipse, wedge, triangle and rectangle) and rulers were used to help the respondent report the volume and dimensions of dishes consumed, which was converted to weight using the food portion/weight database( 38 ). Next, the amount of each food ingredient included in a dish was estimated using the recipe database by Korea Health Industry Development Institute( Reference Kim 39 ). Finally, the energy and nutrient intake was calculated using the seventh edition of the food composition table from the Korean National Academy of Agricultural Science( 40 ). The results of these calculations are provided on the website of the Korea Centers for Disease Control and Prevention( 41 ).
Estimated average requirement (EAR) of daily energy was obtained from Dietary Reference Intakes for Koreans 2010 (online Supplementary Table S1)( 42 ). The nutrient adequacy ratio (NAR) was calculated for each of nine nutrients (protein, Ca, P, Fe, vitamin A, thiamine, riboflavin, niacin and vitamin C) using the following formula: NAR=subject’s daily intake of a nutrient/recommended nutrition intake according to sex and age of that nutrient. The nine NAR values were then averaged to yield a mean adequacy ratio (MAR)( Reference Madden, Goodman and Guthrie 43 ). The MAR provides an index of the overall diet quality. A high MAR implies a high-quality diet( Reference Kant 44 ).
Measurement of demographic, socio-economic and lifestyle-related variables
Data on the age group (categorised as 19–29, 30–39, 40–49, 50–59, 60–69 and 70 or more years), sex (male/female), smoking status (categorised as never, past (had smoked ≥100 cigarettes during their lifetime but not smoking currently) and current smoker (had smoked ≥100 cigarettes and still smoking)), alcohol drinking frequency (less than once per month, once per month, two to four times per month, two to three times per week and four times or more per week), education level (elementary school/middle school/high school/university), resistance exercise frequency (none, once per week, twice per week, three times per week, four times per week and five times or more per week) and physical activity assessed by the International Physical Activity Questionnaire scores (metabolic equivalent of task-min per week)( Reference Craig, Marshall and Sjostrom 45 ) were acquired by the Health Interview Survey. The household income was estimated using the following question: ‘What is the approximate total household income for the past 1 year, including wages, real-estate income, pensions, interest, government subsidies, allowances for relatives or children and so on?’ Thereafter, the study population was divided into quartiles (low/mid-low/mid-high/high) on the basis of the total household income. The depressed mood (yes/no) was determined using the following question: ‘Have you ever felt sad or desperate for 2 consecutive weeks during the past 1 year so that your daily life is hindered?’ The stress level (rare/a little/much/too much) was assessed using the following question: ‘How stressed out do you feel in your daily life?’
Statistical analysis
All statistical analyses were conducted using statistical software R version 3.3.1 (The R Foundation for Statistical Computing). As the KNHANES IV adopted a stratified multistage clustered probability sampling design, the survey package for R was used to account for cluster effects and sampling weights( Reference Lumley 46 , Reference Lumley 47 ). The study data included a total of 307 clusters, and three to 45 subjects were included in each cluster. All of the results are presented as weighted values. The general characteristics of the study population are presented as means with their standard errors (SE) for continuous variables and percentages (%) with their standard errors for categorical variables. The nutritional characteristics are also presented as mean values with their standard errors. We explored the association between EF and each obesity indicator (BF%, BMI and WC) using multiple linear regression analyses for complex survey design( Reference Lumley and Scott 48 ). To prevent multicollinearity between variables, we confirmed that all variance inflation factors are smaller than 10. Because the distributions of BF%, BMI and WC were not symmetric, the Box–Cox power transformation was used to make them more normally distributed. The parameters for the transformation of BF%, BMI and WC were 1·124397, −0·04895731 and 0·4656249, respectively. The design effects for the transformed variables from BF%, BMI and WC were 2·6549, 1·7001 and 2·7373, respectively. The transformed variables were used as dependent variables in the multiple regression analyses, and the predicted marginal means and 95 % CI for the dependent variables were estimated in each EF group. From those, the adjusted means and 95 % CI for BF%, BMI and WC were calculated as inverses of the Box–Cox transformation. We also tested for a linear trend of the dependent variables across EF groups after adjusting for potential confounders. The confounding variables were chosen on the basis of the results of previous studies, and included age group( Reference Molarius 49 ), sex( Reference Garawi, Devries and Thorogood 50 ), smoking status( Reference Dare, Mackay and Pell 51 ), alcohol drinking frequency( Reference Molarius 49 ), resistance exercise frequency( Reference Lee, Bacha and Hannon 52 ), physical activity( Reference Molarius 49 ), MAR (quartile)( Reference Yoon and Jang 53 ), EI:EAR ratio( Reference Chamieh, Moore and Summerbell 54 ), depressed mood( Reference Simon, Von Korff and Saunders 55 ), household income( Reference Drewnowski 56 ), education level( Reference Molarius 49 ) and stress level( Reference De Vriendt, Moreno and De Henauw 57 ). The same methods were also used to assess whether snack frequency and meal frequency were significantly associated with each obesity indicator. To determine whether the association between obesity indicators and EF, snack frequency and meal frequency changes according to diet quality, we analysed further multiple linear regression models that included all variables listed above and additional interaction terms between diet quality index (MAR quartiles) and EF, snack frequency or meal frequency. Then, the multiple linear regression analyses were repeated for the subgroups stratified by MAR quartile. Statistical significance was defined by a two-tailed P<0·05.
Results
General and nutritional characteristics of study participants according to eating frequency groups
EF ranged from 1 to 6, and it was classified as less than three (EF<3: 9·60 %), three (EF=3: 33·99 %), four (EF=4: 36·55 %) and five or more per day (EF≥5: 19·87 %). Mean values of obesity indicators and demographic, health behavioural and socio-economic characteristics according to EF groups are presented in Table 1. Table 2 summarises mean daily intakes of energy, macronutrients and micronutrients, and mean MAR values according to EF groups.
Table 1 General characteristics of the study population (Mean values and percentages with their standard errors)
EF, eating frequency; MET, metabolic equivalent of task.
* Means and standard errors using sampling weight for complex sample.
† Percentages and standard errors using sampling weight for complex sample.
Table 2 Nutritional characteristics classified according to eating frequency (Mean values with their standard errors)
EF, eating frequency; EAR, estimated average requirement; NAR, nutrient adequacy ratio; RE, retinol equivalents; NE, niacin equivalents.
* EAR was obtained from Dietary Reference Intakes for Koreans 2010.
† Mean adequacy ratio: average of NAR for nine nutrients (protein, Ca, P, Fe, vitamin A, thiamine, riboflavin, niacin, vitamin C). NAR=the subject’s daily intake of a nutrient/Korean recommended nutrition intake of that nutrient. All NAR values are truncated at 1·0.
Association between eating frequency and obesity indicators (body fat percentage, BMI and waist circumference)
In the multiple linear regression analyses for survey design with adjustment for covariates, the adjusted means of BF%, BMI and WC were all decreased as EF increased from the low-EF group (EF<3) to the high-EF group (EF≥5), showing a significant linear trend (P<0·001 for BF%, BMI and WC) (Table 3). The highest-EF group (EF≥5) showed statistically significant differences in all obesity indicators (BF%, BMI and WC) compared with all other EF groups (Table 4). As snack frequency increased from zero to three per day, the adjusted means of BF%, BMI and WC were also significantly altered (P=0·001 for BF%, 0·002 for BMI and 0·001 for WC). The group having snack twice a day showed significantly lower BF%, BMI and WC compared with the group having snack once a day or the group having no snack. Each obesity indicator was also significantly changed according to meal frequency (P=0·002 for BF%, <0·001 for BMI and 0·036 for WC). The group having meals three times a day showed significantly lower BF%, BMI and WC compared with the group having meals twice a day.
Table 3 Body fat percentage, BMI and waist circumference according to eating frequency (Adjusted means and 95 % confidence intervals)
* Adjusted for age group, sex, smoking status, alcohol drinking frequency, physical activity, resistance exercise frequency, household income, education level, stress level, mean adequacy ratio (quartile), energy intake:estimated average requirement ratio and depressed mood.
† Adjusted for same variables as in * plus meal frequency.
‡ Adjusted for same variables as in * plus snack frequency.
Table 4 P values for pairwise comparisons for body fat percentage, BMI and waist circumference according to eating frequency
* Adjusted for age group, sex, smoking status, alcohol drinking frequency, physical activity, resistance exercise frequency, household income, education level, stress level, mean adequacy ratio (quartile), energy intake:estimated average requirement ratio and depressed mood.
† Adjusted for same variables as in * plus meal frequency.
‡ Adjusted for same variables as in * plus snack frequency.
Change in the association between eating frequency and obesity indicators according to diet quality
To assess the diet-quality-associated alteration of the relation between obesity indicators and EF, snack frequency and meal frequency, we analysed multiple linear regression models that included the same variables as above and additional interaction terms between diet quality index (MAR quartiles) and EF, snack frequency or meal frequency. The results showed that the association between EF and each of the three obesity indicators was significantly altered according to diet quality (P value of the interaction term EF×MAR quartile=0·008 in the regression model for BF%, <0·001 for BMI and 0·043 for WC). In addition, the associations between snack frequency and both BMI and WC were significantly changed according to diet quality, but that between snack frequency and BF% was not (P value of the interaction term snack frequency×MAR quartile=0·036 in the regression model for BMI, 0·004 for WC and 0·105 for BF%). The interaction term meal frequency×MAR quartile was statistically significant only in the regression models for WC (P=0·013 in the regression model for WC, 0·100 for BMI and 0·080 for BF%). Thus, further subgroup analyses were performed to examine the association between EF, snack frequency and meal frequency and obesity indicators for which the interaction terms were significant in each group stratified by MAR quartile.
In the stratified multiple linear regression analyses according to diet quality group, EF showed significant inverse associations with every obesity indicator (BF%, BMI and WC) after adjusting for potential confounders in two higher diet quality groups (the third and fourth quartile of MAR), but not in two lower diet quality groups (the first and second quartile of MAR). In the highest and the second-highest diet quality groups, the adjusted means of BF%, BMI and WC were all decreased as EF increased from the low-EF group (EF<3) to the high-EF group (EF≥5), showing a significant linear trend. However, in the lowest and the second-lowest diet quality groups, there was no significant linear trend between EF and obesity indicators. The snack frequency was significantly associated with both BMI and WC in the highest diet quality group, with only WC in the second-highest diet quality group and with neither in the lower diet quality groups (the first and second MAR quartile). There was a significant association between meal frequency and WC only in the highest diet quality group, but not in the lower three diet quality groups (Table 5). Table 6 summarises the results of pairwise comparisons for BF%, BMI and WC according to EF in the subgroup analyses stratified by diet quality index.
Table 5 Body fat percentage, BMI and waist circumference according to eating frequency stratified by diet quality index (Adjusted means and 95 % confidence intervals)
MAR, mean adequacy ratio.
* Adjusted for age group, sex, smoking status, alcohol drinking frequency, physical activity, resistance exercise frequency, household income, education level, stress level, energy intake:estimated average requirement ratio and depressed mood.
† Adjusted for same variables as in * plus meal frequency.
‡ Adjusted for same variables as in * plus snack frequency.
Table 6 P values for pairwise comparisons for body fat percentage (BF%), BMI and waist circumference (WC) according to eating frequency stratified by diet quality index
MAR, mean adequacy ratio.
* Adjusted for age group, sex, smoking status, alcohol drinking frequency, physical activity, resistance exercise frequency, household income, education level, stress level, energy intake:estimated average requirement ratio and depressed mood.
† Adjusted for same variables as in * plus meal frequency.
‡ Adjusted for same variables as in * plus snack frequency.
Discussion
In this study, we found that EF, snack frequency and meal frequency are inversely associated with obesity indicators, namely BF%, BMI and WC, in Korean adults, but some of those relations were altered according to diet quality. When stratified by diet quality, these inverse associations between EF and the obesity indicators were significant in the higher two diet quality groups, but not in the lower two diet quality groups.
The pathway between EF and obesity has not yet been fully clarified. However, it had previously been indicated that increased EF is associated with reduced insulin concentration, postprandial lipid levels and lipogenesis( Reference Jenkins, Ocana and Jenkins 58 , Reference Jenkins, Wolever and Vuksan 59 ). Increased EF can decrease the postprandial surge of glucose and thus decrease the amount of insulin released in response( Reference Poston, Haddock and Pinkston 60 ). Insulin inhibits lipolysis in adipocytes, primarily through inhibition of lipase enzyme activity, and increases fat deposition( Reference Ma, Bertone and Stanek 61 , Reference Saltiel and Kahn 62 ). Thus, EF may contribute to the development of obesity.
However, despite these theoretical bases, previous clinical studies have shown mixed results. Several studies have revealed the inverse relationship between EF and obesity( Reference Ma, Bertone and Stanek 61 , Reference Ruidavets, Bongard and Bataille 63 ). A study of 499 US adults reported that an EF of four or more was associated with a lower risk of obesity in comparison with an EF of three or fewer( Reference Ma, Bertone and Stanek 61 ). Another study of 330 middle-aged men in France reported a significant inverse relationship between EF and BMI and waist:hip ratio( Reference Ruidavets, Bongard and Bataille 63 ). In contrast, a cross-sectional study of British adults reported a positive association between EF and BMI and between EF and WC( Reference Murakami and Livingstone 12 ). Meanwhile, some clinical trials reported no association between EF and weight loss( Reference Bachman and Raynor 64 , Reference Cameron, Cyr and Doucet 65 ), despite key limitations, namely small sample size and an insufficient follow-up time for making substantive conclusions( Reference Bachman and Raynor 64 , Reference Cameron, Cyr and Doucet 65 ).
The reason for this inconsistency remains unclear, but the controversy with regard to the association between EF and obesity in previous studies might arise from differences in the diet quality. The type of food eaten along with an increased EF may be important in determining the nature of the relationship between EF and obesity risk. A previous study of Australian adults suggested that higher EF is associated with lower WC and reduced fasting glucose and lipid profile in men, but not in women. They hypothesised that the different results between men and women might be owing to the difference in snacking quality. That is, Australian women who ate more often might eat unhealthy snacks( Reference Smith, Blizzard and McNaughton 11 ). In our study, diet quality was also a possible effect modifier on the relationship between EF and obesity indicators. Increased EF with low diet quality might countervail the metabolically positive effect of higher EF, and thus not be helpful in reducing obesity. However, previous studies did not consider diet quality, which might play a role in the discrepancy. The mechanism by which diet quality alters the association between EF and obesity has not been sufficiently clarified. However, previous studies suggested that poor diet quality is accompanied by greater insulin resistance and lower adiponectin levels, which is an adipokine that decreases insulin resistance and inflammation( Reference Johnson-Down, Labonte and Martin 66 – Reference Mojiminiyi, Abdella and Al Arouj 68 ). This might counterbalance the advantage of high EF on the development of obesity.
The nutrition transition process in Korea has resulted in dietary changes including an increase in the animal food consumption and a decrease in total cereal intake( Reference Kim, Moon and Popkin 69 ). In this study, we could not find significant differences in EF according to income and education levels. However, the proportions of women were higher in higher-EF groups. A study on Americans also showed no association between diet quality and socio-economic status( Reference Hiza, Casavale and Guenther 70 ). However, the diet quality was improved with income level in adults, and women showed better diet quality. Better diet quality was observed in children and older adults compared with younger and middle-aged adults.
This study has some limitations. First, this is a cross-sectional study, which limited our ability to reveal the causal relationship between EF and obesity. Second, there may be potential recall bias because lifestyle factors, including diet, were based on data retrospectively collected by self-reported questionnaires. Third, dietary variables were estimated by a single 24-h dietary recall instead of three 24-h dietary recalls. This might not reflect the usual diet at the individual level, as day-to-day variation was not considered. Therefore, we only included study subjects who answered that they ate as per usual on the survey day to avoid this bias as much as possible. Finally, the participants of this study were of a single ethnic origin, and thus generalisation of the study results must be undertaken with caution. For all its limitations, the strength of this study is that it is the first to identify the potential effect modification of diet quality on the association between EF and obesity indicators using a representative sample of the Korean population.
In conclusion, we revealed that EF is inversely associated with obesity indicators including BMI, WC and BF%, and the association between EF and these obesity indicators is altered according to diet quality in Korean adults. EF is inversely associated with BMI, WC and BF% when diet quality is high, but not when it is low. Further prospective studies are needed to verify the causal relationship between EF and obesity.
Acknowledgements
This study was supported by the Clinical Research Center of Kangwon National University Hospital (grant of 2010 Research Support Project for Newly Appointed Clinical Professors).
G.-H. P. and S. K. conceived the study and had primary responsibility for final content, and G.-H. P. and J. H. Y. helped design the study. S. K. analysed data, performed statistical analyses and drafted the manuscript, and G.-H. P. helped with the revision of the manuscript. All authors read and approved the final manuscript.
The authors declare that there are no conflicts of interest.
Supplementary material
For supplementary material/s referred to in this article, please visit https://doi.org/10.1017/S0007114518000557


