


Over several recent decades, vitamin D has been identified as one of the key nutrients that contributes to the development and maintenance of optimum bone mass. Vitamin D primarily enhances intestinal Ca and phosphate absorption and promotes bone mineralisation, thus supporting optimal skeletal growth and development from the very early life stages( Reference Braegger, Campoy and Colomb 1 , Reference Misra, Pacaud and Petryk 2 ). Over the last 15 years, the attention on vitamin D and health has increased considerably( Reference Taylor, Thomas and Aloia 3 , Reference Cashman and Kiely 4 ), mainly due to the discovery of vitamin D receptors in most body tissues and cells, which generated new hypotheses on the potential impact of vitamin D on several health outcomes beyond its known metabolic actions on bone and mineral metabolism( Reference Theodoratou, Tzoulaki and Zgaga 5 ).
Wide variations in the prevalence of poor vitamin D status have been reported across countries throughout the world, which appear to be dependent on latitude, seasonality, the characteristics of the populations under study, the vitamin D food fortification policy in each country, as well as the thresholds of serum 25-hydroxyvitamin D (25(OH)D) concentrations used to define deficiency or insufficiency( Reference van Schoor and Lips 6 – Reference Lips 8 ). Although the serum thresholds as proposed by the Institute of Medicine (IOM) (i.e. 25(OH)D <30 and 50 nmol/l) have been most commonly used to represent deficiency and insufficiency, respectively( 9 ), a higher threshold of 75 nmol/l has also been proposed by the Endocrine Society( Reference Holick, Binkley and Bischoff-Ferrari 10 ). Based on these thresholds, the prevalence of low vitamin D status among European populations is characterised by a high degree of variability across studies and countries( Reference van Schoor and Lips 6 , Reference Hilger, Friedel and Herr 11 ). In this context, the ‘Healthy Lifestyle in Europe by Nutrition in Adolescence’ study reported a range in the prevalence of vitamin D insufficiency from 25·7 to 62·9 % among adolescents from nine European countries( Reference Gonzalez-Gross, Valtuena and Breidenassel 12 ).
Despite the fact that the major natural source of vitamin D in humans is its endogenous synthesis via exposure of the skin to solar UVB radiation, according to country-specific regional data there is a higher prevalence of low vitamin D status recorded among children and adolescents from southern Europe compared with their counterparts from central and northern Europe. For example, recent data suggested that children and adolescents living in Italy and Turkey( Reference Karaguzel, Dilber and Can 13 , Reference Vierucci, Del Pistoia and Fanos 14 ), had a similar or higher prevalence of vitamin D insufficiency (at 57·4 and 93 %, respectively) compared with children and adolescents from Northern Ireland, the Netherlands and Great Britain (46, 51·3 and 53 %, respectively) during winter and/or spring months( Reference Voortman, van den Hooven and Heijboer 15 – Reference Hill, Cotter and Mitchell 17 ). These findings warrant further investigation, especially for populations with very limited data. Further to variations within the wider European region, the prevalence of low vitamin D status may also vary considerably even within the same country and season, as highlighted by the findings of two different studies conducted among Turkish children and adolescents that reported a prevalence of serum 25(OH)D concentrations <50 nmol/l of 8 and 98·7 %, respectively, during winter( Reference Aypak, Turedi and Yuce 18 , Reference Akman, Tumer and Hasanoglu 19 ). However, it should be noted that serum 25(OH)D levels in these two studies were measured with two different assays (i.e. chemiluminescence immunoassay and HPLC respectively). Considering the well-recognised method-related differences in the measurement values for circulating 25(OH)D( Reference Sempos, Vesper and Phinney 20 , Reference Carter, Carter and Jones 21 ), this wide variation could be at least partly due to a lack of a standardisation between the methods applied to determine serum 25(OH)D levels in these two studies.
In light of this, the aim of the current study was to report the prevalence of vitamin D deficiency and insufficiency in a representative sample of 2386 children living in four prefectures covering the northern, southern, eastern and central parts of Greece and to further examine the role of sex, degree of urbanisation and seasonality on the vitamin D status of these children. As the first 806 children in the Healthy Growth Study (HGS) were analysed for serum 25(OH)D in 2013 and the remaining 1580 samples were analysed in 2016, it was important to standardise the serum 25(OH)D data as per the Vitamin D Standardization Program (VDSP) protocols( Reference Binkley and Sempos 22 ) before combining the two data sets.
Methods
Study design and population
The HGS was a large-scale cross-sectional epidemiological study initiated in May 2007 and completed in June 2009. Approval to conduct the study was granted by the Greek Ministry of National Education and the Ethical Committee of Harokopio University of Athens (Reference code: 16/19-12-2006). The population under study comprised of schoolchildren aged 9–13 years attending the fifth and sixth grades from primary schools located in municipalities within the counties of Attica, Aitoloakarnania, Thessaloniki and Iraklio. The study population was representative of the 9–13-year-old schoolchildren living in the four counties under study, which are scattered throughout the Greek territory, covering the northern (i.e. Thessaloniki), central (i.e. Attica), western (i.e. Aitoloakarnania) and southern (i.e. Iraklio-Crete) parts of Greece (indicating potential representativeness also at a national level). The sampling of schools participating in the HGS was random, multistage and stratified by parents’ educational level and total population of students attending schools within municipalities of these counties( Reference Moschonis, Tanagra and Vandorou 23 ). A detailed letter, explaining the aims of the current study and a consent form for conducting full measurements, was provided to all parents or guardians having a child in these schools. Parents, who responded positively, had to sign the consent form and provide their contact details. Signed parental consent forms for full measurements were collected for 2655 out of 4145 children (response rate 64·1 %).
Measurements
Socio-economic and demographic indices
Data on the socio-economic and demographic background of the families having at least one child participating in the study were collected from the parents (most preferably from the mother) during scheduled face-to-face interviews at the school-site. For those parents, who were not able to attend the meetings (approximately 5 % of the total sample), data were collected via telephone interviews. All interviews were conducted by researchers that were rigorously trained to minimise interviewer’s effect, with the use of a standardised questionnaire. More specifically, the data collected during the interviews included parental educational level (years of education), origin and nationality.
Dietary intake
Dietary intake data were obtained by trained dieticians and nutritionists, via morning interviews with children at the school sites. Dietary intake data were obtained for 2 consecutive weekdays and 1 weekend day, using the 24-h recall technique. To ensure quality, food models and portion measures (such as cups and spoons) were used to specify serving sizes, a trained dietitian checked the food records for any mis-recorded or missing information, whereas a random 10 % of all records was re-entered in the food database by a different person than the one entering the original data. The data were then compared with the original to ensure inter-researcher reliability. Food intake data were analysed with Nutritionist V diet analysis software (version 2.1, 1999; First Databank), which was extensively amended and updated to include traditional Greek foods and recipes, as described in Food Composition Tables and Composition of Greek Cooked Food and Dishes( 24 , Reference Trichopoulou 25 ). Furthermore, the databank was updated with nutrition information of chemically analysed commercial food items, most usually consumed by children in Greece.
Physical activity levels
To assess physical activity, study participants were provided with and instructed to wear a waist-mounted pedometer (Yamax SW-200 Digiwalker; Yamax Corporation) for 1 week (i.e. from Monday to Sunday). The pedometer was positioned in accordance with the manufacturer’s instructions on the right waistband, vertically aligned with the patella. The pedometer used in the present study displayed the cumulative number of steps from the time it was worn in the morning until the time it was removed, just before bedtime. Participants were provided with a diary template and instructed to record the total number of daily steps displayed by the pedometer at bedtime and then zero the pedometer. Participants were also instructed to take off the pedometers when bathing or swimming and to record these activities in the diary.
Physical examination
All children underwent a physical examination by an experienced female paediatrician that assessed pubertal maturation (i.e. by using the Tanner stage) after a visual inspection of breast development in girls and genital development in boys( Reference Tanner 26 ).
Anthropometric indices
Anthropometric measurements were conducted by two trained members of the research team. The protocol and equipment used were the same in all schools. Body weight was measured to the nearest 10 g using a Seca Alpha (model 770) digital scale (Seca North America, Medical Measuring Systems and Scales). Children were weighed without shoes in the minimum clothing possible. Height was measured to the nearest 0·1 cm using a commercial stadiometer (Leicester Height Measure; Invicta Plastics), with the pupil standing barefoot, keeping shoulders in a relaxed position, arms hanging freely and head aligned to Frankfort horizontal plane. Body weight and height measurements were subsequently used to calculate BMI according to Quetelet’s equation (body weight (kg)/height (m)2).
Biochemical indices
Blood samples were obtained from all children during morning visits at schools, between 08.30 and 10.30 hours and following a 12-h overnight fast. Reminders were distributed the previous day to both parents and children, in order to ensure compliance with fasting. Professional staff performed venepuncture for all children. Blood was collected in plain test tubes for the preparation of serum, which was divided into aliquots and stored at −80°C. Serum 25(OH)D and intact parathyroid hormone (PTH) levels were measured in all samples using chemiluminescence assay (Elecsys Roche Diagnostics) in a Cobas e411 Elecsys 2010 analyser (Hitachi-Technologies Corp.). The serum 25(OH)D analysis was conducted in two batches within the HGS (806 samples in 2013 (referred to as HGS I) and 1580 in 2016 (referred to as HGS II)).
Standardisation of 25-hydroxyvitamin D levels
The VDSP( Reference Binkley and Sempos 22 ) protocol for standardisation of serum 25(OH)D values from past surveys was applied to serum 25(OH)D data arising from the two separate sets of chemiluminescence immunoassay analysis (i.e. HGS I and II). The VDSP protocol and its application has been outlined in detail elsewhere( Reference Binkley and Sempos 22 , Reference Cashman, Kiely and Kinsella 27 – Reference Cashman, Dowling and Skrabakova 29 ), but in brief, for each set of serum 25(OH)D data separately, a subset of bio-banked serum samples were selected by a specific VDSP statistical algorithm, retrieved from the freezers and sent to University College Cork for re-analysis of 25(OH)D levels by their Centre for Disease Control and Prevention-certified liquid chromatography-tandem MS (LC-MS/MS) method, which is traceable to the Reference Measurement Procedures. The results were used to develop a master regression equation for each wave, which allowed recalibration of the existing 25(OH)D data set for the entire survey sample. The 806 serum samples were standardised as part of the ‘Food based solutions for Optimal vitamin D Nutrition and health through the life cycle’ (ODIN) project( Reference Cashman, Dowling and Skrabakova 29 ), whereas the remaining 1580 serum samples were standardised as part of the present work and once both data sets (HGS I and II) were standardised they were combined. The two master regression equations for the HGS serum 25(OH)D data are shown in the online Supplementary Table S1.
Categorisation of vitamin D status
Standardised serum 25(OH)D concentrations were used to categorise children according to their vitamin D status, using the cut-off values proposed by the US IOM Dietary Reference Intake committee’s recent definitions: persons are at risk of deficiency at serum 25(OH)D concentrations <30 nmol/l, whereas serum 25(OH)D concentrations >30 but <50 nmol/l is indicative of insufficiency, as 50 nmol/l is consistent with that needed by the 97·5 % of individuals aged >1 year to support bone health( 9 ). To promote transparent reporting and international comparisons, we have also reported the percentage of children with 25(OH)D concentration between 50 and 75 nmol/l, as designated by the Endocrine Society to denote insufficiency( Reference Holick, Binkley and Bischoff-Ferrari 10 ).
Statistical analysis
Categorical variables are expressed as percentages, whereas continuous variables as means and standard deviations. The χ 2 test was used to explore the association between categorical variables, using the two-sample z test for proportions for post hoc multiple comparisons. The Kolmogorov–Smirnov test was used to determine normality of distribution of the examined continuous variables. All continuous variables examined in the present study were found to be normally distributed and as such the Student’s t test was used for the comparison of mean values between groups. Multivariate logistic regression analysis was also performed in order to assess the associations of sex, surbanisation degree (i.e. urban, semi-urban or rural) and seasonality with vitamin D deficiency and insufficiency respectively. OR and 95 % CI were also derived from these analyses after adjusting for several potential confounding factors. All statistical analyses were performed with the SPSS statistical analysis software version 23.0. All P values reported were two-tailed and the level of statistical significance was set at P<0·05.
Results
Table 1 summarises the descriptive characteristics of the study population, in the total sample and by sex (49·8 % females). The mean age of study participants was 11·2 (sd 0·7) years. Their mean dietary vitamin D intake, physical activity levels and PTH concentrations were 1·55 μg/d, 13 276 steps/d and 35·2 pg/ml, respectively. In addition, 36·5 % of participants were measured in autumn and 68·1 % resided in large urban/metropolitan areas, particularly Attica/Athens (57·2 %), with both their parents having <14 years of education (52·2 %). Almost all (98·1 %) were Caucasian and of Greek origin (83·9 %). The prevalence of obesity was higher in boys compared with girls (P=0·001), whereas more girls were categorised at higher pubertal maturation stages (P<0·001) and had higher prevalence rates of vitamin D deficiency and insufficiency compared with boys (P<0·001 respectively).
Table 1 Descriptive characteristics of study participants (Mean values and standard deviations; percentages and numbers)
25(OH)D, 25-hydroxyvitamin D; PTH, parathyroid hormone.
* P values indicate sex differences and were derived from Student’s t test in the case of continuous variables and Pearson’s χ 2 test in the case of categorical variables.
Table 2 presents the differences in the mean standardised serum 25(OH)D concentrations (derived by the use of the LC-MS/MS method), among different sub-groups of the study population. More specifically, mean serum 25(OH)D concentrations were found to be significantly higher in boys compared with girls (P<0·001), during autumn months compared with winter and spring months (P<0·001), in southern (Iraklio-Crete) and central (Attica) compared with western (Aitoloakarnania) and northern (Thessaloniki) Greece (P<0·001), in rural compared with large urban and semi-urban areas (P<0·001), for children whose parents had >14 years of education compared with those whose one or both their parents had <14 years of education, for children of Greek compared with those of non-Greek origin (P=0·011), for children categorised at lower compared with higher pubertal maturation stages (P<0·001) and for children with lower compared with higher PTH concentrations (P<0·001).
Table 2 Serum 25-hydroxyvitamin D (25(OH)D) concentrations (nmol/l) in sub-groups of the study population (n 2353)Footnote * (Mean values and standard deviations)
PTH, parathyroid hormone.
a,b,c,d,e Mean values sharing the same superscript letter are significantly different between groups as derived from pairwise (post hoc) comparisons using the Bonferroni rule for Type 1 error correction.
* All P values were derived from Student’s t test or ANOVA.
Regarding seasonal differences, the highest prevalence rates of 25(OH)D<30 and 50 nmol/l (9·1 and 73·1 %, respectively) were observed post-winter during spring months (from April to June), whereas the lowest (1·5 and 31·9 %, respectively) were post-summer during autumn (from October to December) (Fig. 1(a) and (b)). The increasing trend observed in the prevalence of low vitamin D status, from autumn to winter and spring months, was statistically significant (P<0·05).
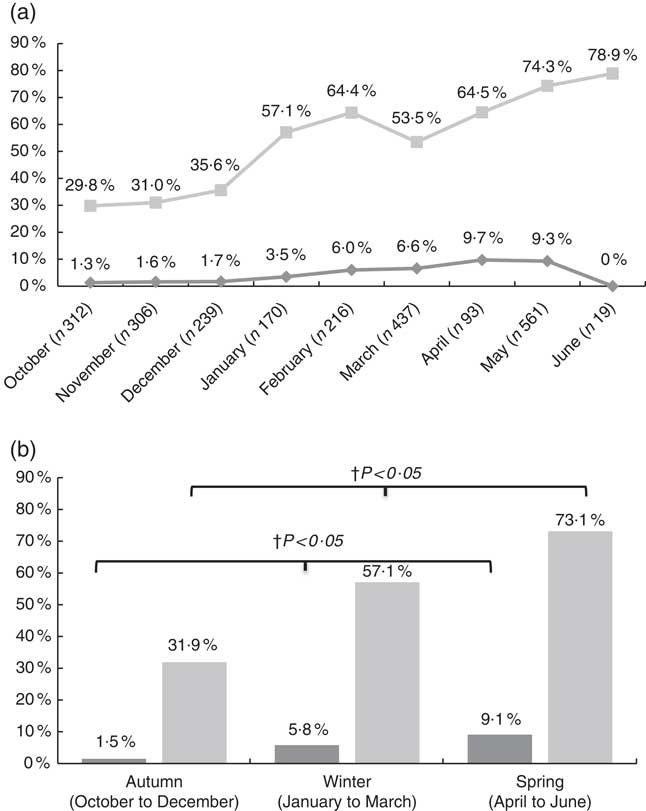
Fig. 1 Prevalence of vitamin D deficiency (25-hydroxyvitamin D (25(OH)D) <30 nmol/l) and insufficiency (25(OH)D <50 nmol/l) by month (a) and by season (b). a: ![]() , 25(OH)D<30 nmol/l;
, 25(OH)D<30 nmol/l; ![]() , 25(OH)D<50 nmol/l; b:
, 25(OH)D<50 nmol/l; b: ![]() , 25(OH)D<30 nmol/l;
, 25(OH)D<30 nmol/l; ![]() , 25(OH) D<50 nmol/l. † P values indicate seasonal differences and have derived from the Pearson’s χ
2 test, using the two-sample test for proportions for post hoc multiple comparisons.
, 25(OH) D<50 nmol/l. † P values indicate seasonal differences and have derived from the Pearson’s χ
2 test, using the two-sample test for proportions for post hoc multiple comparisons.
According to the data presented in Fig. 2, the prevalence rates of vitamin D deficiency and insufficiency were higher among children from urban and semi-urban regions examined during autumn (2 v. 0 % and 33·8 v. 25·0 %, respectively; P≤0·05) and spring (9·6 v. 0 % and 74·6 v. 47·2 %, respectively; P<0·05), compared with children from rural regions examined during the same time periods. No statistically significant urban/rural differences were observed during winter months. It should be noted that as the current study was school-based, blood samples were not collected from mid-June to mid-September due to the summer break. As such, no data on vitamin D status are available for the summer period.
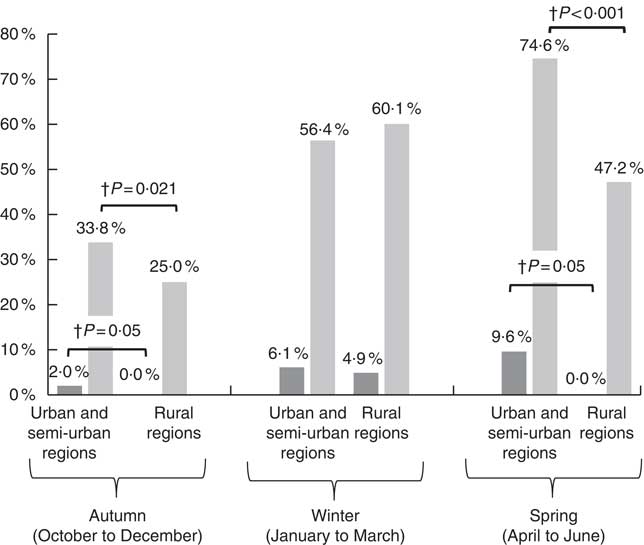
Fig. 2 Prevalence of vitamin D deficiency (25-hydroxyvitamin D (25(OH)D) <30 nmol/l, ![]() ) and insufficiency (25(OH)D<50 nmol/l,
) and insufficiency (25(OH)D<50 nmol/l, ![]() ) by urbanisation degree in the three seasonally-stratified sub-groups. † P values indicate regional differences and have derived from the Pearson’s χ
2 test, using the two-sample test for proportions for post hoc multiple comparisons.
) by urbanisation degree in the three seasonally-stratified sub-groups. † P values indicate regional differences and have derived from the Pearson’s χ
2 test, using the two-sample test for proportions for post hoc multiple comparisons.
The OR and 95 % CI for vitamin D deficiency and insufficiency in schoolchildren, stratified by sex, degree of urbanisation and seasonality (and after adjusting for several potential confounding factors) are shown in Table 3. Based on this data, girls were found to be 1·79 (95 % CI 1·15, 2·80) and 1·24 (95 % CI 1·02, 1·52) times more likely to be vitamin D insufficient and deficient, respectively, compared with boys. In addition, children measured during winter and spring months had the highest odds for vitamin D insufficiency (4·53; 95 % CI 1·93, 10·6 and 7·47; 95 % CI 3·23, 17·3 respectively) and deficiency (2·38; 95 % CI 1·81, 3·13 and 5·14; 95 % CI 3·84, 6·89 respectively), compared with children measured during autumn months. Lastly, large urban and semi-urban region of residence of children was associated with increased likelihoods for vitamin D insufficiency (2·88; 95 % CI 1·28, 6·51) and deficiency (1·49; 95 % CI 1·16, 1·93), compared with children living in rural regions.
Table 3 Multivariate logistic regression analyses examining the associations of vitamin D deficiency and insufficiency (i.e. 25-hydroxyvitamin D levels <30 and 50 nmol/l, respectively) with sex, seasonality and urbanisation degreeFootnote * (Odds ratios and 95 % confidence intervals)
* Multivariate logistic regression analyses were also adjusted for region of residence, parental educational level, race, origin, children’s body weight status, pubertal maturation status and serum parathyroid hormone levels.
Discussion
The available literature on vitamin D status in populations of children and adolescents in Europe is characterised by a high degree of variability among countries and by relatively high prevalence rates of vitamin D deficiency and insufficiency, even in southern European countries( Reference van Schoor and Lips 6 , Reference Hilger, Friedel and Herr 11 , Reference Cashman, Dowling and Skrabakova 29 ). This high degree of variability observed among European countries is partly explained by the different biochemical assays and thresholds used to assess vitamin D status( Reference Cashman, Dowling and Skrabakova 29 – Reference Wallace, Gibson and de la Hunty 31 ). This is the largest analysis of vitamin D status among primary schoolchildren in Greece. The overall prevalence of 52·5 % for vitamin D insufficiency reported for children in Greece by the present study is intermediate to the relevant prevalence rates of 45·9 and 82·3 % recorded for children and adolescents living in two other Mediterranean countries, namely Italy and Turkey respectively( Reference Karaguzel, Dilber and Can 13 , Reference Vierucci, Del Pistoia and Fanos 14 ). However, this prevalence remains higher or very similar to the relevant proportions of vitamin D insufficiency reported by other studies on children and adolescents in central and northern European countries( Reference Voortman, van den Hooven and Heijboer 15 – Reference Hill, Cotter and Mitchell 17 , Reference Sioen, Mouratidou and Kaufman 32 ).
Although Greece is a Mediterranean country with adequate sunshine and UVB availability in most months over the year( Reference O’Neill, Kazantzidis and Ryan 33 ) and despite the fact that the major source of vitamin D is its endogenous synthesis via skin exposure to solar UVB radiation, several environmental, personal and lifestyle factors can substantially affect vitamin D status. In this regard, the current study reported sex, regional and seasonal differences in the prevalence of vitamin D status among children. More specifically, our data showed that mean serum 25(OH)D concentrations were significantly higher in boys compared with girls (i.e. by a mean difference of 3·8 nmol/l) and furthermore the prevalence rates of both vitamin D deficiency and insufficiency were significantly higher in girls compared with boys. The lower vitamin D status observed in the present study for girls in comparison with boys is also confirmed by several other studies conducted with children and/or adolescents in other European countries, but also in the USA, Australia and New Zealand( Reference Hill, Cotter and Mitchell 17 , Reference Kolokotroni, Papadopoulou and Yiallouros 34 – Reference Rockell, Green and Skeaff 39 ). Although dietary vitamin D intake was not exceeding the recommended Estimated Average Requirement (EAR) value in both sexes, the present study showed a higher mean dietary intake of vitamin D in boys compared with girls, which could partly explain the relevant sex differences observed in vitamin D status. In the same context, as indicated by the Third National Health and Nutrition Examination Survey (NHANES III)( Reference Kumar, Muntner and Kaskel 37 ), the lower dietary intake of vitamin D recorded for girls compared with boys in the USA could be one factor supporting the sex differences in vitamin D status. In addition to diet, the lower levels of physical activity usually reported for girls compared with boys in childhood and adolescence may also explain the sex differences observed in the present and other studies, with regards to the prevalence of vitamin D deficiency and insufficiency. Physical activity executed outdoors is usually a proxy measure of sunlight exposure and as such of cutaneous synthesis of vitamin D. However, in the present study female sex remained positively associated with vitamin D deficiency and insufficiency, even after adjusting for children’s dietary intake of vitamin D and physical activity levels but also for other potential confounding factors, such as BMI, pubertal maturation, socio-demographic characteristics and serum PTH concentrations( Reference Rockell, Green and Skeaff 39 – Reference Gutierrez Medina, Gavela-Perez and Dominguez-Garrido 41 ), thus implying the possible role of additional factors that might mediate this association.
Regarding seasonal differences, as expected the highest and lowest prevalence rates of vitamin D deficiency and insufficiency were observed during typical post-winter (April to June) and post-summer (October to December) months, respectively. This is indicative of a clear and most likely independent effect of season on children’s vitamin D status, considering the increased likelihood of vitamin D deficiency and insufficiency observed in the present study during winter and spring months, even after adjusting for several potential confounding factors. In this regard mean serum 25(OH)D concentrations usually follow a sinusoidal pattern throughout the year, reaching their zenith at the post-summer period/beginning of autumn and their nadir at the post-winter period/beginning of spring in populations of the northern hemisphere( Reference Shoben, Kestenbaum and Levin 42 ). These findings are consistent with several other relevant studies available in the literature, conducted with children from other Mediterranean countries( Reference Karaguzel, Dilber and Can 13 , Reference Vierucci, Del Pistoia and Fanos 14 , Reference Kolokotroni, Papadopoulou and Yiallouros 34 , Reference Tolppanen, Fraser and Fraser 35 ).
One recent study conducted with adults living in the island of Crete in southern Greece( Reference Katrinaki, Kampa and Margioris 43 ), showed much higher serum 25(OH)D during spring months, compared with the present study. Possible explanations for this inconsistency could stem from the differences between the two studies, in terms of the examined age groups and latitude. In this regard, the study in Crete examined mainly adults, 34 % of whom were inpatients in local hospitals, whereas the southern latitude of the island Crete facilitates skin exposures to sunlight for more months throughout the year compared with the northern latitudes of mainland Greece. On the contrary the present study was conducted with children, who spend a great proportion of their daily time indoors as they have to attend school until mid-June (thus probably explaining the lowest serum 25(OH)D levels observed in the present study from April to mid-June), whereas the study population was recruited from four different regions, covering the southern, central, western and northern parts of Greece. Last but not least, as the present study was school-based, measurements were not conducted during typical summer months in Greece (i.e. mid-June to mid-September) when a gradual increase in mean 25(OH)D levels should be expected in agreement with the data reported by the study performed in Crete.
As far as the role of urbanisation degree on vitamin D status is concerned, the present study showed higher prevalence rates of vitamin D deficiency and insufficiency for children living in urban/semi-urban regions compared with their counterparts from rural regions, especially during autumn and spring months. These differences in vitamin D status among children living in areas of different urbanisation degree could mainly be attributed to the particularities of the physical environment in urban compared with rural regions of Greece, as determinant of behaviours also affecting vitamin D status. More specifically, the physical environment in rural regions can be more supportive of increased outdoor physical activity levels and consequently greater sun exposure compared with urban and semi-urban regions( Reference Lucas, Ponsonby and Dear 44 ). Typical examples of how physical environment can facilitate optimal 25(OH)D levels in rural compared with urban areas are the higher availability of and accessibility to open-space areas, less traffic and more neighbourhood safety supporting active transportation, shorter buildings and less or no air pollution, which can inhibit endogenous/cutaneous synthesis of vitamin D by blocking direct sun exposure. These regional differences in vitamin D status were mainly seen at post-summer and post-winter time periods, when prevailing weather conditions in Greece are more supportive for outdoor playing and activities. On the other hand, no regional differences on vitamin D status were observed during typical winter months (January to March), as at this time period children from both urban and rural regions usually spent more time indoors, due to the colder weather conditions and shorter daytime, whereas at the same time sun exposure during this period is not efficient enough in stimulating endogenous vitamin D synthesis( Reference Holick 45 ).
The findings of the current study should be interpreted in light of its strengths and limitations. Regarding strengths, the current study was a large-scale epidemiological study conducted in a representative sample of children from four prefectures within the wider region of Greece. Furthermore, standardisation of serum 25(OH)D concentrations based on the VDSP protocols is a novel approach that sets the basis for more consistent and valid comparisons with current and all future studies that will use the ‘gold standard’ LC-MS/MS assay to assess vitamin status. Regarding limitations, the low dietary vitamin D intake reported by the present study could reflect the weaknesses in the method used to record children’s dietary intake (i.e. 24 h recall) and/or in the dietary intake analysis software and the food composition tables in terms of the actual food sources of vitamin D.
In conclusion, the prevalence of low vitamin D status reported in the present study for schoolchildren in Greece is considerably high and is comparable to, or in many cases exceeds, the relevant prevalence reported for children and adolescents in other European countries. Girls, children living in urban regions and post-winter months were found to significantly increase the likelihood of vitamin D deficiency and insufficiency thus highlighting specific sub-groups living in certain physical environments and under specific conditions that might benefit the most from population-based strategies aiming to tackle the actual problem of low vitamin D status. Among such strategies, dietary intake of vitamin D from fortified foods could be considered as the one with probably the widest population reach for maintaining sufficient levels of vitamin D in children. This is further supported by the fact that vitamin D food fortification in Greece is optional and as a consequence dietary intake of vitamin D has been repeatedly reported to be inadequate, not only for children but for adults too( Reference Manios, Moschonis and Mavrogianni 46 ).
Acknowledgements
The authors would like to thank all research members involved in the data collection of the Healthy Growth Study.
The biochemical analyses for determining serum 25-hydroxyvitamin D concentrations were partly funded by Kellogg Company Europe and partly by Roche Diagnostics SA. The standardisation of serum 25-hydroxyvitamin D concentrations was supported in part by funding received from the European Commission under its Seventh Framework Programme (FP7) ODIN (grant agreement no. 613977). Roche Diagnostics SA had no role in the design, analysis or writing of this article.
Y. M. and G. M. contributed in designing and monitoring the study, in collecting and managing the data and in leading the statistical analyses with the contribution and input from T. H. and A.-S. B.; G. L. J. H. and K. G. D. conducted the LC-MS/MS re-analysis of sera for VDSP standardisation. K. D. C. and M. E. K. performed the uniform sampling as per VDSP procedures to identify serum samples for re-analysis and developed the master regression equations. All authors contributed to the writing, critical review and approval of the final version of the manuscript for publication.
M. E. K. and K. D. C. are joint coordinators of the European Commission-funded ODIN integrated project (contract 613977). T. H. is and A.-S. B. was an employee at Kellogg Company. Any opinions, findings, conclusions or recommendations expressed in the current study are those of the authors and do not necessarily reflect the views of Kellogg Company.
Supplementary material
For supplementary material/s referred to in this article, please visit https://doi.org/10.1017/S0007114517002422


