


Adolescence is an important period in life that includes multiple physiological and psychological changes that have a considerable effect on dietary habits( Reference Von Post-Skagegwård, Samuelson and Karlström 1 , Reference Lake, Mathers and Rugg-Gunn 2 ). Unhealthy food consumption patterns during childhood and adolescence are linked with both the occurrence of obesity in youth and the later risk of developing diseases such as cancer, obesity and CVD in adulthood( Reference Niemeier, Raynor and Lloyd-Richardson 3 ).
Dietary habits are influenced by individual, social and environmental factors, including food choice decisions, food choice motivations, religious adherence, food cravings, taste, hunger, time and effort required for food preparation and consumption, cost, body image and socio-economic status( Reference Furst, Connors and Bisogni 4 – Reference Hulshof, Brussaard and Kruizinga 8 ). Dietary habits are also influenced by cultural traditions, which differ between countries( Reference Slimani, Fahey and Welch 9 , Reference Agudo, Slimani and Ocké 10 ). Family and peers are considered important sociocultural influences that have a strong impact on dietary habits during adolescence( Reference Pedersen, Grønhøj and Thøgersen 11 – Reference Rasmussen, Krølner and Klepp 17 ). Previous studies have consistently demonstrated the importance of parents to healthy eating habits during adolescence, specifically vegetable and fruit consumption( Reference Fitzgerald, Heary and Kelly 13 , Reference Kristjansdottir, De Bourdeaudhuij and Klepp 16 , Reference Rasmussen, Krølner and Klepp 17 ). Previous studies of both encouragement and engagement have also found that friends influence the intake of healthy foods such as vegetables, energy drinks, snacks, desserts, fruits, whole grains and biscuits( Reference Fitzgerald, Heary and Kelly 13 – Reference Croll, Neumark-Sztainer and Story 15 ). However, previous studies have not included the influence of siblings’ encouragement and engagement in terms of the diet. Moreover, the aim of previous research was to compare the social influence of parents and friends on eating attitudes of adolescents by focusing specifically on particular food groups( Reference Pedersen, Grønhøj and Thøgersen 11 – Reference Rasmussen, Krølner and Klepp 17 ). To our knowledge, no previous studies have examined the influence of family and peers on diet quality taking account into quality, diversity, equilibrium and meal frequency in adolescents.
Therefore, the aim of the present study was to examine the associations between adolescents’ diet quality and their perceived relatives’ and peers’ (father, mother, brother, sister and best friend) diet engagement and encouragement.
Methods
Study design
The present study is a secondary data analysis of the Healthy Lifestyle in Europe by Nutrition in Adolescence (HELENA) Study (www.helenastudy.com) performed in European adolescents (2006–2007). The aim of the HELENA Study was to obtain a broad range of standardized, reliable and comparable nutrition- and health-related data from a random sample of European adolescents aged 12·5–17·5 years.
The random selection of schools and classes was performed centrally. The first step of the recruitment strategy consisted of telephone contact with the director/principal of the school. During the call, a meeting with the director/principal and main/principal teachers of selected classes was organized to present the study aims and procedures and obtain consent to participate. The second step consisted of a meeting with adolescents from selected classes and their main/principal teacher. During this meeting, the study aims, procedures and tests were explained. Information and consent forms were then distributed, and the adolescents were asked to return the written/signed consent form (including the signatures of the adolescent and both parents) within a maximum of two weeks after the meeting. Table 1 presents an overview of the participation rate of the different sampling units for the whole study and for each centre individually. In total, 3528 adolescents were included in the HELENA Study, 83 % of whom completed the dietary habits questionnaire and were therefore included in the present study. The participants’ characteristics are presented in Table 2. No significant differences were observed between the included and excluded adolescents’ characteristics.
Table 1 Number of approached/participating classes and adolescents in the Healthy Lifestyle in Europe by Nutrition in Adolescence (HELENA) StudyFootnote †
† Data were collected from 2006 to 2007.
‡ Percentage calculated to reflect the ratio of selected adolescents for statistical analysis to adolescents approached in all approached classes.
Table 2 Characteristics of the study population of adolescents (n 2943) aged 12·5–17·5 years from ten European cities, Healthy Lifestyle in Europe by Nutrition in Adolescence (HELENA) Study
DQI-A, Diet Quality Index for Adolescents.
* P<0·05 for comparison between the two samples, without and with missing data on DQI-A.
† Nutritional status: underweight (UW), normal weight (NW), overweight (OW), obese (O).
‡ Education level: lower education (I); higher secondary education (II); higher education or university degree (III).
The local ethics committee for each country approved the HELENA Study, and all procedures were performed in accordance with the ethical standards of the Helsinki Declaration of 1975, as revised in 2008, and the European Good Clinical Practices.
Measurements
Assessment of relatives’ and peers’ diet engagement and encouragement
A self-administered questionnaire was used to assess healthy diet determinants. A paper version of the questionnaire was administrated in a classroom under the supervision of a HELENA fieldworker. Two questions on engagement and encouragement were extracted for the present study( Reference Vereecken, De Henauw and Maes 18 ). The adolescents were asked about the perceived diet quality engagement of their relatives and peers (father, mother, brother(s), sister(s) and best friend(s)) using the following question: ‘How healthy is each of the following persons’ diet: father, mother, sister(s), brother(s), best friend(s)?’ The adolescents’ perceived engagement of their relatives and peers was classified as low if the answer to the question was ‘very unhealthy’ or ‘not very healthy’, medium if ‘average’ or ‘quite healthy’, and high if ‘very healthy’. The adolescents were also asked about the perceived diet encouragement provided by their relatives and peers using the following question: ‘How often does each of the following persons encourage you to eat a healthy diet: father, mother, sister(s), brother(s), best friend(s)?’ The answers were classified as low if the answer to the question was ‘not at all’ or ‘not much’, medium if ‘sometimes’ or ‘often’, and high if ‘very often’. These questions regarding perceived relatives’ and peers’ diet engagement and encouragement were extracted from a healthy diet determinants questionnaire that has been found to be valid and reliable( Reference Vereecken, De Henauw and Maes 18 ).
Dietary habits
Dietary intake was assessed by two non-consecutive 24 h recalls performed on two convenient weekdays one week apart. The 24 h recalls were recorded using the self-administered, computer-based HELENA Dietary Intake Assessment Tool (HELENA-DIAT), which has been validated in European adolescents( Reference Vereecken, Covents and Sichert-Hellert 19 ). The HELENA-DIAT tool is based on intake assessments at six meal occasions (breakfast, morning snack, lunch, afternoon snack, evening meal and evening snack) on the previous day. Trained dietitians assisted the adolescents to complete the 24 h recalls when needed. To calculate energy and nutrient intakes, data from HELENA-DIAT were linked to the German Food Code and Nutrient Database (Bundeslebensmittelschlüssel, version II.3.1)( Reference Dehne, Klemm and Henseler 20 ). The Multiple Source Method was used to estimate the usual energy, nutrient and food intakes.
The Diet Quality Index for Adolescents (DQI-A) is composed of four components – quality, diversity, equilibrium and meal frequency – that were previously validated in the HELENA population( Reference Béghin, Dauchet and De Vriendt 21 – Reference Vyncke, Cruz-Fernandez and Fajo-Pascual 24 ). Daily diet was divided into nine recommended food groups: (i) water; (ii) bread and cereal; (iii) potatoes and grains; (iv) vegetables; (v) fruits; (vi) milk products; (vii) cheese; (viii) meat, fish and substitutes; and (ix) fats and oils. Dietary quality indicated whether an adolescent made optimal food quality choices within a food group and was represented by a ‘preference group’ (i.e. the healthiest foods: cereal/brown bread, fresh fruit and fish), an ‘intermediate group’ (e.g. white bread, minced meat) and a ‘low-nutrient, energy-dense group’ (i.e. the unhealthiest foods: soft drinks, sweet snacks and chicken nuggets) using predefined criteria. The dietary quality score was then calculated by multiplying the amount of the food consumed (in grams) by a weighting factor (+1 for the preference group, 0 for the intermediate group and –1 for the low-nutrient, energy-dense group) and dividing by the total amount of food (in grams). The diet quality score was expressed as a percentage, meaning that it could vary between –100 and 100 %. The diversity component corresponds to the degree of variation in the diet. The score was obtained by assigning 1 point for each food group that had at least one serving at the preference level, dividing by 9 (which represents the maximum score), and then expressed as a percentage between 0 and 100 %. Dietary equilibrium was calculated as the difference between the adequacy component (the percentage of food groups with intake above the minimum recommended value) and the excess component (the percentage of food groups exceeding the upper level of the recommended intake) and ranged between 0 and 100 %. Meal frequency was scored as 0 when no food was consumed and 1 when some food was consumed at each of the three main meal occasions. The scores for the three occasions were summed and expressed as a percentage; the possible scores were thus 0 % (no consumption at any of the main meals), 33 % (consumption at only one main meal), 66 % (consumption at two main meals) and 100 % (consumption at all three main meals).
The four DQI-A components are presented as percentages. The quality component ranged from –100 to 100 %, whereas the diversity, equilibrium and meal frequency components ranged from 0 to 100 %. The DQI-A was computed as the arithmetic mean of these four components; hence, the DQI-A ranged from –25 to 100 %, with higher scores reflecting a higher-quality diet. The score was calculated for each day and the mean daily score was taken as the individual’s overall index.
Participants’ characteristics
Body weight was measured with the participant wearing light clothes and without shoes to the nearest 0·1 kg using an electronic scale (model 871; SECA, Hamburg, Germany). Height was measured without shoes to the nearest 0·1 cm using a telescopic height-measuring instrument (model 225; SECA). BMI was calculated as [weight (kg)]/[height (m)]2. The nutritional status was assessed using the International Obesity Task Force scale( Reference Cole, Bellizzi and Flegal 25 ). An extended and detailed manual of operations was designed for and thoroughly read by every researcher involved in fieldwork before the data collection started( Reference Nagy, Vicente-Rodriguez and Manios 26 ). In addition, a workshop training week was carried out before the study began to standardize and harmonize the data collection methods. The instructions given to the participants for every measurement were standardized for all cities and translated into the local language.
Parental educational level was classified into one of four categories using a specific questionnaire adapted from the International Standard Classification of Education (ISCED; http://www.uis.unesco.org/Library/Documents/isced97-en.pdf). Parental educational level was scored as 1 for primary and lower education (levels 0, 1 and 2 in the ISCED classification); 2 for higher secondary (levels 3 and 4 in the ISCED classification); and 3 for tertiary (levels 5 and 6 in the ISCED classification).
Statistical analyses
The data are presented as percentages for qualitative variables and as means and standard deviations for quantitative variables. Normality of distribution was checked graphically and by using the Shapiro–Wilk test.
To assess the potential bias related to missing or incomplete data for the DQI-A, the main adolescent characteristics were compared between adolescents with and without DQI-A data using Student’s t test for quantitative variables, the χ 2 test for categorical variables and the Mantel–Haenszel trend test for ordered categorical variables (Table 1).
We examined the associations between the DQI-A (overall index and each component) and each perceived relative’s and peer’s diet engagement and encouragement levels using linear mixed models adjusted for prespecified confounding factors, including age, sex and parental educational level as fixed effects, and city, city×school and city×school×class as random effects( Reference Béghin, Dauchet and De Vriendt 21 , Reference Wuenstel, Wądołowska and Słowinska 27 , Reference Winkvist, Hultén and Kim 28 ). The adjusted means for the DQI-A and their standard errors were calculated using the least-square means. Because the perceived relatives’ and peers’ diet engagement or encouragement levels were classified into three ordered levels, we used linear contrasts to perform the trend test. Comparisons of overall DQI-A between the ten perceived relatives’ and peers’ diet engagement or encouragement levels (main objective) were adjusted for multiple comparisons using the false discovery rate controlling method( Reference Benjamini and Hochberg 29 ).
To avoid case deletion in the analyses, missing data were imputed by multiple imputations using the regression-switching approach (chained equations with m=20 imputations obtained using R statistical software version 3.03)( Reference Van Buuren and Groothuis-Oudshoorn 30 ). The imputation procedure was performed under the missing-at-random assumption using all adolescents’ characteristics, relatives’ and peers’ diet engagement and encouragement levels and DQI-A components with the predictive mean-matching method for quantitative variables, logistic regression for binary variables and ordinal logistic regression for ordered categorical variables. Rubin’s rules were used to combine the estimates derived from multiple imputed data sets( Reference Molaison, Connell and Stuff 31 ). We performed a key subgroup analysis according to sex for the associations of overall DQI-A and meal frequency component with each perceived relative’s and peer’s diet engagement and encouragement levels. Inclusion of the corresponding interaction term into the multivariable linear mixed model was used to assess heterogeneity.
All statistical tests were done at the two-tailed α level of P<0·05. Data were analysed using the statistical software package SAS version 9.3.
Results
Physical characteristics of the adolescents are presented in Table 2.
The adolescents’ overall DQI-A score was positively and significantly associated with their perceived mother’s, brother’s and sister’s diet engagement (Table 3). Having a high level of perceived mother’s, brother’s and sister’s engagement resulted in 6, 5 and 4 % higher diet quality scores, respectively, compared with the low level (Table 3). We found also significant positive associations between perceived sister’s diet engagement and the adolescents’ quality component (39·5 (se 2·8) v. 43·2 (se 1·8) v. 48·1 (se 2·6) for low, medium and high, respectively; P=0·004; +21·7 %; Fig. 1). Similarly, a significant positive association was observed between perceived brother’s diet engagement and adolescents’ diversity component (72·4 (se 1·1) v. 73·9 (se 0·9) v. 76·2 (se 1·3) for low, medium and high, respectively; P=0·003; +5·2 %); between perceived father’s diet engagement and adolescents’ balance (40·1 (se 0·6) v. 41·0 (se 0·3) v. 41·5 (se 0·5) for low, medium and high, respectively; P=0·047; +3·5 %) and diversity components (72·7 (se 1·1) v. 73·6 (se 0·9) v. 75·1 (se 1·1) for low, medium and high, respectively; P=0·003; +3·3 %); and between perceived mother’s diet engagement and adolescents’ balance component (39·3 (se 0·9) v. 40·8 (se 0·3) v. 41·9 (se 0·4) for low, medium and high, respectively; P=0·005; +6·6 %; Fig. 1). Similar findings were observed for the adolescents’ diversity (71·2 (se 1·4) v. 73·4 (se 0·9) v. 75·3 (se 0·9) for low, medium and high, respectively; P=0·005; +5·7 %) and meal frequency components (89·8 (se 1·0) v. 91·7 (se 0·7) v. 92·6 (se 0·8) for low, medium and high, respectively; P=0·023; +3·1 %; Fig. 1) with perceived mother’s diet engagement.
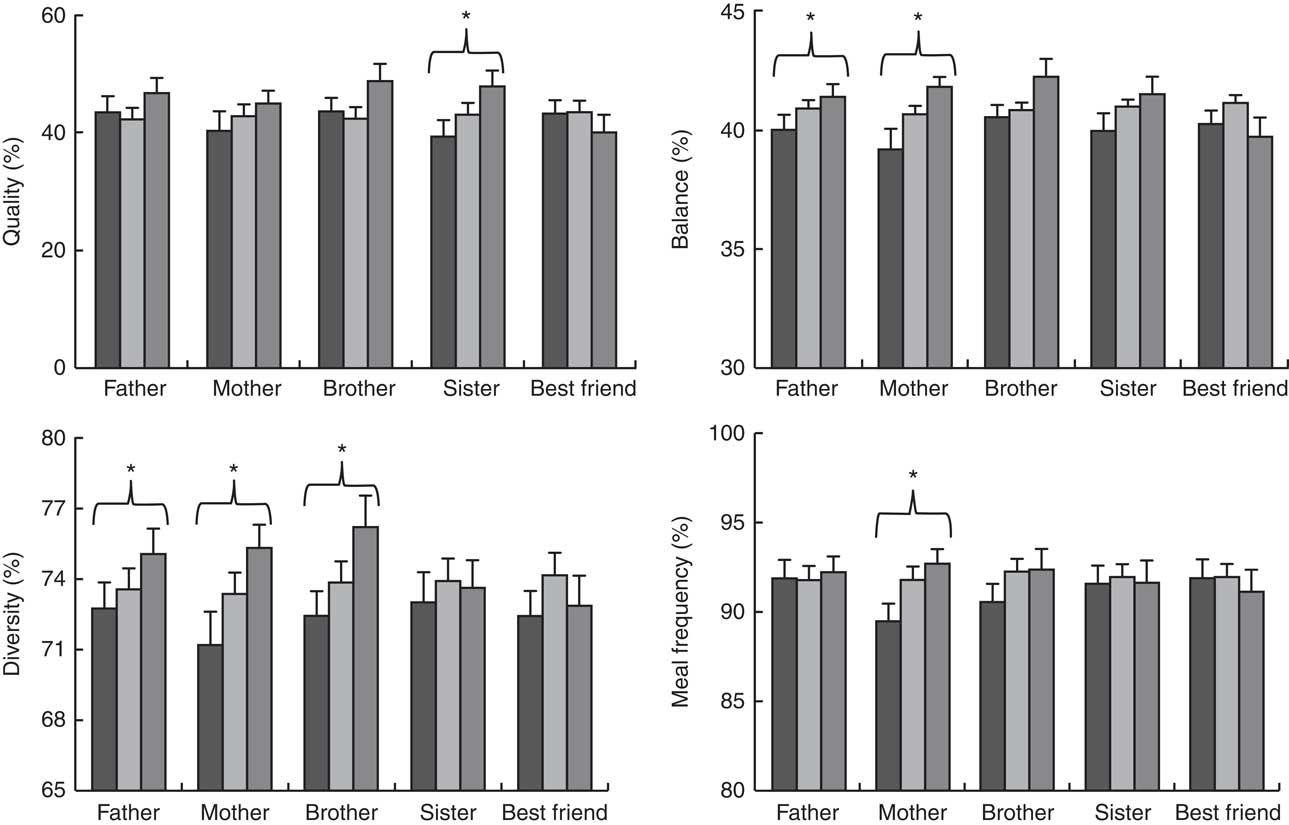
Fig. 1 Diet quality components, scored using the Diet Quality Index for Adolescents (DQI-A), according to relatives’ and peers’ diet engagement (![]() , low;
, low; ![]() , medium;
, medium; ![]() , high), among adolescents (n 2943) aged 12·5–17·5 years from ten European cities, Healthy Lifestyle in Europe by Nutrition in Adolescence (HELENA) Study. Values are means (with their standard errors represented by vertical bars) of each component, calculated using linear mixed models including age, sex and parental educational level as fixed effects and city, city×school and city×school×class as random effects after handling missing data by multiple imputation. *Adjusted P for trend<0.05 across the relatives’ engagement
, high), among adolescents (n 2943) aged 12·5–17·5 years from ten European cities, Healthy Lifestyle in Europe by Nutrition in Adolescence (HELENA) Study. Values are means (with their standard errors represented by vertical bars) of each component, calculated using linear mixed models including age, sex and parental educational level as fixed effects and city, city×school and city×school×class as random effects after handling missing data by multiple imputation. *Adjusted P for trend<0.05 across the relatives’ engagement
Table 3 Overall diet quality scores according to their relatives’ and peers’ diet engagement among adolescents (n 2943) aged 12·5–17·5 years from ten European cities, Healthy Lifestyle in Europe by Nutrition in Adolescence (HELENA) StudyFootnote †
DQI-A, Diet Quality Index for Adolescents.
† Number, adjusted mean, se and P value for trend across relatives’/peers’ diet engagement were calculated using linear mixed models including age, sex and parental educational level as fixed effects and city, city×school and city×school×class as random effects after handling missing data by multiple imputation.
‡ Controlled for multiple comparisons using the false discovery rate method.
The overall DQI-A score was significantly negatively associated with the perceived best friend’s encouragement and positively associated with the perceived father’s and mother’s encouragement (Table 4). Having a high level of perceived best friend’s, father’s and mother’s encouragement resulted in 4·0 % lower, and 4·4 and 4·4 % higher, diet quality scores, respectively, compared with the low level (Table 4). The perceived father’s encouragement level was positively and significantly associated with the quality, diversity and balance components (Fig. 2). The difference observed in the diet quality score between the low and high levels of perceived father’s encouragement was 13·4, 3·9 and 3·2 % for the quality, diversity and balance components, respectively (Fig. 2). Positive associations were also found between the perceived mother’s encouragement and the quality, balance and diversity components. The difference observed in the diet quality score between the low and high levels of perceived mother’s encouragement was 13·0, 4·0 and 5·5 % for the quality, balance and diversity components, respectively (Fig. 2). Another positive association was found between the perceived sister’s diet encouragement and the adolescents’ balance component, with a difference of 4·6 % in diet quality score between the low and high perceived encouragement levels (Fig. 2). The perceived best friend’s encouragement was negatively associated with the meal frequency component, with a difference of 3·7 % in the diet quality score between the low and high perceived encouragement levels (Fig. 2).
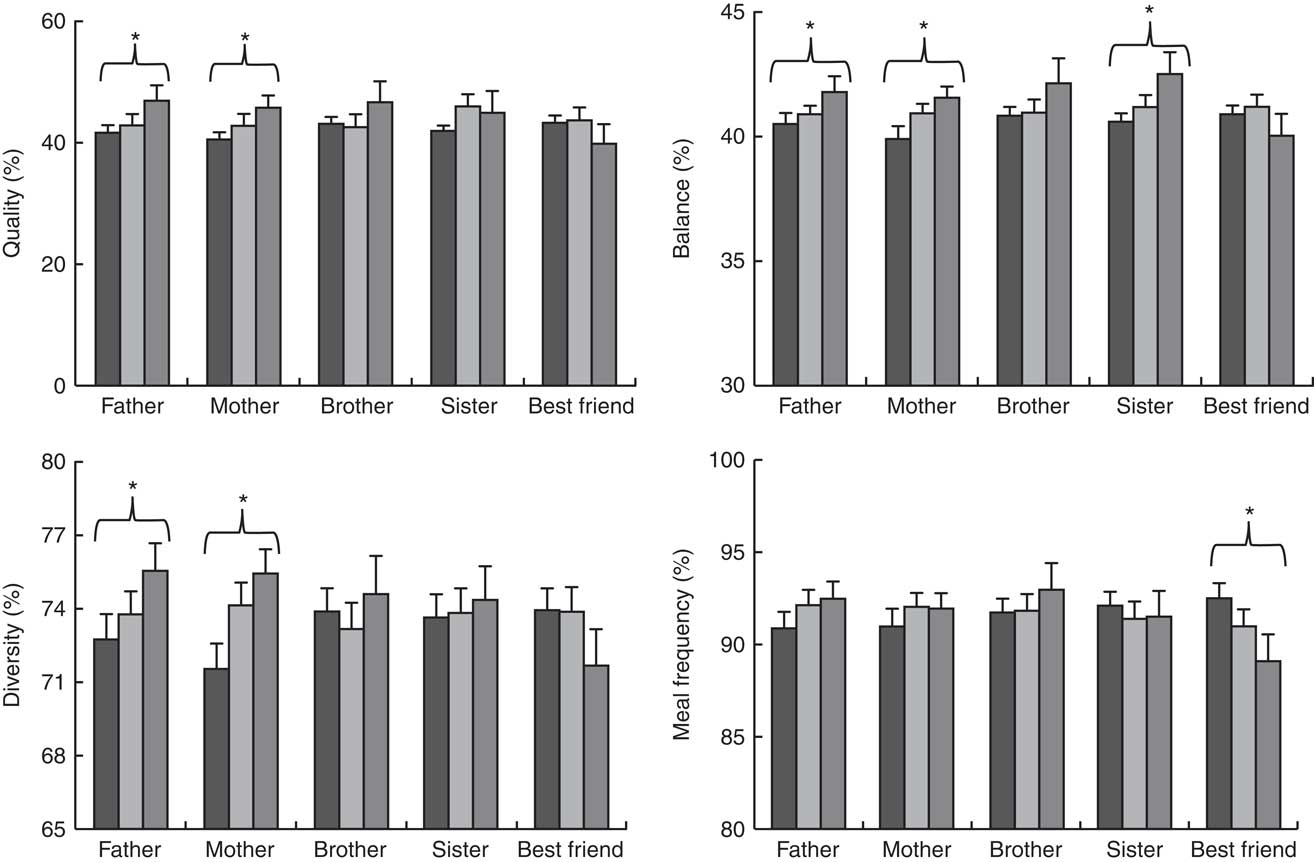
Fig. 2 Diet quality components, scored using the Diet Quality Index for Adolescents (DQI-A), according to relatives’ and peers’ diet encouragement (![]() , low;
, low; ![]() , medium;
, medium; ![]() , high), among adolescents (n 2943) aged 12·5–17·5 years from ten European cities, Healthy Lifestyle in Europe by Nutrition in Adolescence (HELENA) Study. Values are means (with their standard errors represented by vertical bars) of each component, calculated using linear mixed models including age, sex and parental educational level as fixed effects and city, city×school and city×school×class as random effects after handling missing data by multiple imputation. *Adjusted P for trend<0.05 across the relatives’ encouragement
, high), among adolescents (n 2943) aged 12·5–17·5 years from ten European cities, Healthy Lifestyle in Europe by Nutrition in Adolescence (HELENA) Study. Values are means (with their standard errors represented by vertical bars) of each component, calculated using linear mixed models including age, sex and parental educational level as fixed effects and city, city×school and city×school×class as random effects after handling missing data by multiple imputation. *Adjusted P for trend<0.05 across the relatives’ encouragement
Table 4 Overall diet quality scores according to their relatives’ and peers’ diet encouragement among adolescents (n 2943) aged 12·5–17·5 years from ten European cities, Healthy Lifestyle in Europe by Nutrition in Adolescence (HELENA) StudyFootnote †
DQI-A, Diet Quality Index for Adolescents.
† Number, adjusted mean, se and P value for trend across relatives’/peers’ diet encouragement were calculated using linear mixed models including age, sex and parental educational level as fixed effects and city, city×school and city×school×class as random effects after handling missing data by multiple imputation.
‡ Controlled for multiple comparisons using the false discovery rate method.
The association between adolescents’ overall DQI-A and perceived mother’s diet encouragement was stronger in boys than in girls, although the heterogeneity test did not reach the level of significance (P for heterogeneity=0·089). In boys, the adjusted mean DQI-A was 58·8 (se 1·1) v. 61·0 (se 0·9) v. 62·2 (se 1·1) for the low, medium and high perceived mother’s diet encouragement levels, respectively (P for trend=0·002). By contrast, in girls, the adjusted mean DQI-A was 63·1 (se 1·1) v. 64·1 (se 0·8) v. 64·7 (se 0·8) for the low, medium and high perceived mother’s diet encouragement levels, respectively (P for trend=0·12). We found no other significant heterogeneity based on the adolescents’ sex (data not shown).
Discussion
Our study aimed to investigate the associations between adolescents’ diet and their perceived relatives’ and peers’ (father, mother, brothers, sisters and best friends) diet engagement and encouragement. Since our study directly addressed adolescents, we only have information about perceived engagement and encouragement; relatives’ and peers’ engagement and encouragement were not directly assessed. Although we acknowledge that this could have influenced our results, we believe that adolescents’ perceptions influenced their own diet quality more than relatives’ or peers’ engagement and encouragement.
The main finding of our study is that both perceived relatives’ diet engagement and encouragement were associated with the diet quality of the adolescents studied. However, the magnitude of the associations with the adolescents’ DQI-A component scores varied according to the perceived parent’s, sibling’s or peer’s diet engagement and encouragement. A strong positive association between the perceived mother’s diet engagement and the adolescents’ diet quality was found. This shows that mothers play a key role in family food choices, including adolescents’ choices( Reference Neumark-Sztainer, Story and Perry 32 , Reference Wind, Bobelijn and De Bourdeaudhuij 33 ), and is consistent with previous studies showing the importance of mothers to adolescents’ meals( Reference Faith, Scanlon and Birch 34 ). This finding also confirms that the perceived mother’s engagement is associated with adolescents’ diet quality. Moreover, it concurs with previous studies showing that mother–adolescent communication is more effective than father–adolescent communication in changing adolescents’ nutritional behaviour( Reference Sichert-Hellert, Beghin and De Henauw 35 , Reference Kim, Hanjoon and Marc 36 ). Our finding is also consistent with the results of the Healthy Eating Questionnaire, which showed that the mother is the family member most likely to promote healthy dietary habits( Reference Iliescu, Beghin and Maes 37 ). However, we also found an association between perceived fathers’ encouragement and adolescents’ diet quality. No previous studies have assessed the influence of brothers and sisters, and our data show for the first time a positive relationship between their perceived diet engagement or encouragement and adolescents’ diet quality, balance and diversity components. This outcome shows the importance of siblings on the diet quality of the adolescent. Therefore, this suggests that intervention programmes that aim to enhance diet quality in adolescent populations might be more successful if parents and siblings are also included in the intervention. Our results concur with previous published studies showing that youth diet behaviours, particularly in obese paediatric patients, may be improved when parents attend and are directly involved with services and are provided with training in the skills required to support lifestyle modifications in accordance with expert guidelines( Reference Sung-Chan, Sung and Zhao 38 – Reference Kitzman-Ulrich, Wilson and St George 41 ). In this context and from a practical point of view, primary care may play a major role in the improvement of parenting behaviours linked to child health( Reference Leslie, Mehus and Hawkins 42 , Reference Prado, Pantin and Estrada 43 ). Indeed, children and adolescents, most of the time accompanied by their parents, regularly access primary care where specialists or generalist physicians are present. Even if health-care providers report having inadequate time and a lack of expertise and resources to effectively work with parents and provide key messages regarding a healthy lifestyle, attempting to implement a specific time for discussion with parents and siblings during primary care visits remains important( Reference Turner, Shield and Salisbury 44 ). This point of view is supported by several committees’ recommendations regarding the prevention and treatment of youth overweight and obesity and the promotion of family-centred interventions in primary care( Reference Barlow 45 , Reference August, Caprio and Fennoy 46 ). Caregivers’ policies should be discussed and new ways to address child and family care should be created for care providers such as paediatricians, family physicians, nurse practitioners and physicians’ assistants. Concerning the roles of siblings, few existing preventive interventions target sibling relationships( Reference Feinberg, Solmeyer and McHale 47 ). Therefore, clinicians should also consider offering specific sessions for siblings that focus on healthy eating habits and instruction regarding how to promote and reinforce these habits among their siblings.
Most of the previous studies of the influence of relatives and peers have focused on the dietary behaviours of girls, and few studies have also included boys( Reference Quiles Marcos, Quiles Sebastián and Pamies Aubalat 48 , Reference Larson and Richards 49 ). A significant difference between girls and boys was found only for the association between adolescents’ DQI-A score and perceived mother’s diet encouragement. In contrast to the results of previous studies of dietary behaviours, we found that girls’ diet quality did not correlate with the perceived mother’s diet encouragement( Reference Quiles Marcos, Quiles Sebastián and Pamies Aubalat 48 ). Indeed, it has been shown that weight-control behaviours among young girls are modelled partially on their mothers’ behaviours( Reference Quiles Marcos, Quiles Sebastián and Pamies Aubalat 48 , Reference Levine, Smolak and Moodey 50 , Reference Hill and Franklin 51 ). In the present study, we focused on diet quality components, but not directly on weight control.
During the transition from childhood to adolescence, children decrease the time spent with parents and spend more time alone and/or with friends( Reference Larson and Richards 49 ). One unexpected finding of our study is the negative association between perceived encouragement of peers to eat healthily and adolescent unhealthy food consumption. This also contrasts with a recent study showing that friends’ unhealthy food consumption was associated with an individual’s unhealthy food consumption, although that study examined consumption rather than encouragement( Reference Sawka, McCormack and Nettel-Aguirre 52 ). One possible explanation is that those adolescents with unhealthy food consumption are encouraged by their peers to eat more healthily, independently of their peers’ food consumption habits. Differences in our study in the associations between the adolescents’ DQI-A scores and the perceived relatives’ (positive association) and perceived peers’ (negative association) diet engagement might reflect a better awareness of healthy lifestyle in adults than in adolescents. However, the influence of the relatives may also have adverse effects in the medium term(53). Indeed, if perceived relatives’ engagement or encouragement is too important, it could lead to eating disorders and have a negative impact on future health. Several studies have highlighted concerns about the effectiveness of their role in dieting and the potential for increasing the risk of unintentional weight gain, disordered eating and eating disorders( Reference Neumark-Sztainer, Wall and Guo 53 – Reference Stice, Presnell and Spangler 57 ).
The strengths of the present study are the large sample size of adolescents with sex-specific information in ten European cities, the use of standardized procedures, the inclusion of many confounding factors in the analyses and the strong methodology for assessing dietary habits( Reference Julián-Almárcegui, Bel-Serrat and Kersting 58 ). The limitations of the study include the cross-sectional and observational design to examine the associations, which cannot be interpreted to reflect causal relationships. The proxy report of the parent’s, sibling’s and peer’s diet engagement and encouragement is another limitation that could lead to misclassification. Moreover, we cannot rule out bias because of the estimated values for missing data, as the multiple-imputation procedure to replace missing values with a set of plausible values was done under a missing-at-random assumption. Finally, in the present study, we found that the mean differences between variables was low, which raises the question of their clinical significance.
Conclusion
In conclusion, our findings highlight the role of social encouragement and engagement in adolescents’ diet quality. Implementing intervention or promotion programmes that aim to encourage a healthy diet in adolescents might be more successful if the family and peers are also targeted. Indeed, interventions aimed at improving diet quality in young people might be more successful when family members are also encouraged to engage in healthy diet quality and support adolescents’ diet quality. Another important point is the fact that adolescents’ perceptions of their peers’/families’ engagement/encouragement may also play a major role in their dietary quality and should be addressed in intervention programmes focusing on adolescents.
Acknowledgements
Acknowledgements: The authors thank the participants for taking part in the study. Financial support: The HELENA Study is made possible by the financial support of the European Community Sixth RTD Framework Programme (Contract FOOD-CT-20056007034) and the Spanish Ministry of Science and Innovation (RYC-2010-05957 and RYC-2011-09011). The funders had no role in the design, analysis or writing of this article. The content of this paper reflects only the authors’ views, and the European Community is not liable for any use that may be made of the information contained therein. Conflict of interest: The authors declared no conflict of interest. Authorship: Each author of this article significantly contributed to the study. F.G., S.D.H., A.K., K.W., M.S., M.K. and J.R.R. designed the research; J.V., L.B., J.R.R., M.S., A.K., M.K. and K.W. conducted the research; E.D. analysed data; A.D. analysed data and performed statistical analyses; J.V., L.B. and F.G. wrote the paper; F.G. had primary responsibility for the final content. All authors read and approved the final manuscript. Ethics of human subject participation: This study was conducted according to the guidelines laid down in the Declaration of Helsinki and all procedures involving human subjects were approved by the local ethics committee for each country. Written informed consent was obtained from all subjects and their parents.


