


Introduction
Hydrocarbon contamination of Antarctic soils and sediments has been demonstrated over recent years at a range of sites (e.g. Aislabie et al. Reference Aislabie, Balks, Astori, Stevenson and Symons1999, Martins et al. Reference Martins, Bícego, Taniguchi and Montone2004, Curtosi et al. Reference Curtosi, Pelletier, Vodopivez and MacCormack2007, Bícego et al. Reference Bícego, Zanardi-Lamardo, Taniguchi, Martins, Da Silva, Sasaki, Albergaria-Barbosa, Paol, Weber and Montone2009, Dauner et al. Reference Dauner, Hernández, MacCormack and Martins2015, Prus et al. Reference Prus, Fabianska and Labno2015), despite the low human presence on the Antarctic continent. Logistical support for scientific operations, growing tourism and fisheries have been reported as the major sources of hydrocarbon pollution in Antarctica (Mazzera et al. Reference Mazzera, Hayes, Lowenthal and Zielinska1999, Curtosi et al. Reference Curtosi, Pelletier, Vodopivez and MacCormack2007, Tin et al. Reference Tin, Fleming, Hughes, Ainley, Convey, Moreno, Pfeiffer, Scott and Snape2009). Hydrocarbons are derived from both natural and anthropogenic sources. Local vegetation such as mosses, lichens and vascular plants represent natural sources of hydrocarbons in Antarctica (e.g. Cabrerizo et al. Reference Cabrerizo, Tejedo, Dachs and Benayas2016). Anthropogenic sources are associated with fossil fuel combustion, fuel storage, accidental oil spills and sewage discharge (Aislabie et al. Reference Aislabie, Balks, Astori, Stevenson and Symons1999, Curtosi et al. Reference Curtosi, Pelletier, Vodopivez and MacCormack2007, Bícego et al. Reference Bícego, Zanardi-Lamardo, Taniguchi, Martins, Da Silva, Sasaki, Albergaria-Barbosa, Paol, Weber and Montone2009, Cabrerizo et al. Reference Cabrerizo, Tejedo, Dachs and Benayas2016). Some polycyclic aromatic hydrocarbons (PAHs) are teratogenic, mutagenic and carcinogenic, and are considered as priority pollutants because of their high toxicity (USEPA 1985). The impact of hydrocarbon pollution even at a local level on the Antarctic continent is very significant because of its relative pristine environment and sensitive communities. In addition, except in high-energy marine environments where dispersion occurs rapidly, hydrocarbon pollution has proved long-lived in Antarctica (Tin et al. Reference Tin, Fleming, Hughes, Ainley, Convey, Moreno, Pfeiffer, Scott and Snape2009). The low temperatures occurring in Antarctica delay the biological degradation of hydrocarbons in contaminated soils, where they are generally highly persistent. However, information about the origin (biogenic or anthropogenic) of these compounds is also preserved under low temperature conditions, so potential sources can be investigated (Prus et al. Reference Prus, Fabianska and Labno2015, Cabrerizo et al. Reference Cabrerizo, Tejedo, Dachs and Benayas2016).
Some significant but mainly localized levels of organic pollutants in Antarctic marine and terrestrial environments have been related to human activities, especially at coastal research stations, including fuel storage and transportation, sewage release and waste disposal (e.g. Curtosi et al. Reference Curtosi, Pelletier, Vodopivez and MacCormack2007, Bícego et al. Reference Bícego, Zanardi-Lamardo, Taniguchi, Martins, Da Silva, Sasaki, Albergaria-Barbosa, Paol, Weber and Montone2009, Martins et al. Reference Martins, Bícego, Rose, Taniguchi, Lourenço, Figueira, Mahiques and Montone2010, Préndez et al. Reference Préndez, Barra, Toledo and Richter2011, Dauner et al. Reference Dauner, Hernández, MacCormack and Martins2015).
In 1991, after the signing of the Protocol on Environmental Protection (Madrid Protocol), Consultative Parties of the Antarctic Treaty recognized the need to improve management practices and mitigating measures, for present and past environmental impacts (Aislabie et al. Reference Aislabie, Balks, Foght and Waterhouse2004). Uruguay, as a Consultative Party following the Madrid Protocol, has a responsibility both for the preservation and conservation of Antarctica and a duty to assess the environmental impact of its activities in Antarctica including the establishment of mitigation measures (Aislabie et al. Reference Aislabie, Balks, Foght and Waterhouse2004). The aim of this study was to assess the origin, main sources, levels and distribution of aliphatic hydrocarbons (AHs) and PAHs in the area close to the Artigas Antarctic Research Station (BCAA) and to evaluate the extent of areas potentially affected by anthropogenic hydrocarbon inputs due to human activities at the BCAA.
Materials and methods
Study site and sampling methods
The BCAA is located at 62°11'4''S and 58°51'7''W in Collins Bay, a part of Maxwell Bay, on the Fildes Peninsula, King George Island, South Shetland Islands (Fig. 1). The BCAA with an area of c. 30000 m2 constitutes the main Uruguayan Antarctic station. It was founded in 1984 and is open throughout the year providing logistical support to activities of the Uruguayan Antarctic Programme. The BCAA consists of 11 buildings including the radio, AINA (scientific staff bedrooms and labs), head of station house, cavern (water deposit and gym), crew housing, supply depot, nursery, kitchen/dining room, hangar, service area (generator room, incinerator, old and new fuel tanks) and boat storeroom (Figs 1 & 2). Three meltwater streams (named for this work: AINA’s stream, kitchen’s stream and tank’s stream) flow across the BCAA into Collins Bay (Fig. 2). The permanent population of the BCAA is composed of nine people, with up to 60 people staying during the summer months. As in most Antarctic stations, diesel generators provide the energy for the BCAA. Residue waste produced in the BCAA is classified, compacted, stored and ultimately removed from Antarctica or incinerated on site following Annex III of the Madrid Protocol. In addition, inspections of the installations and activities developed in the BCAA are regularly performed (e.g. ATIPR 2013).
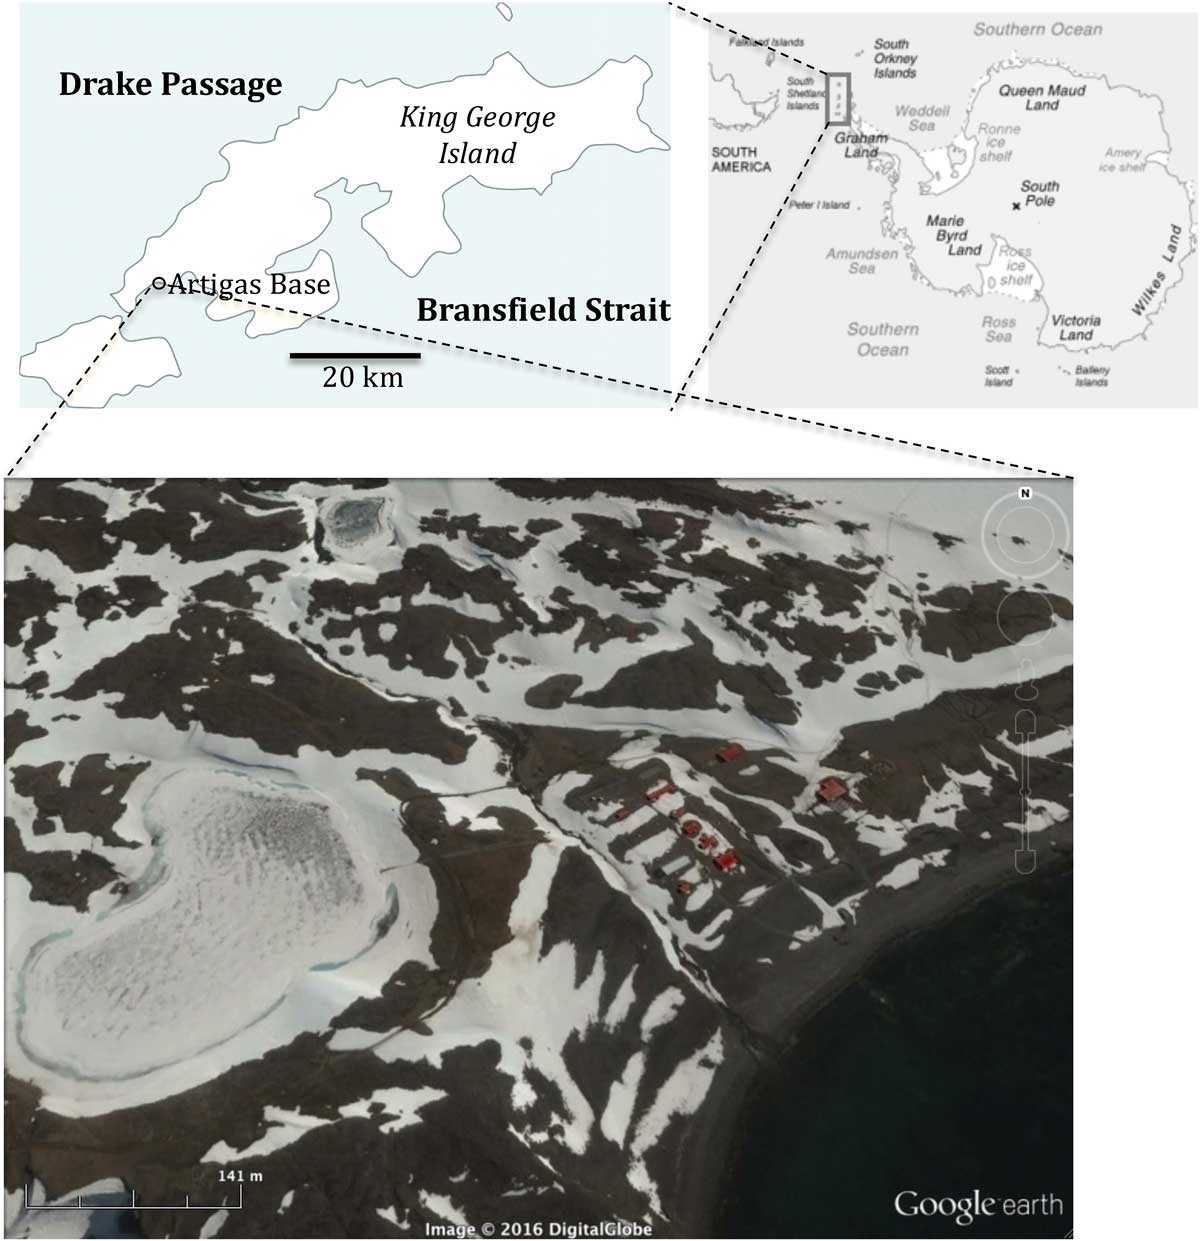
Fig. 1 Location of the Artigas Research Station (BCAA) on King George Island, South Shetland Islands Archipelago, Antarctica.
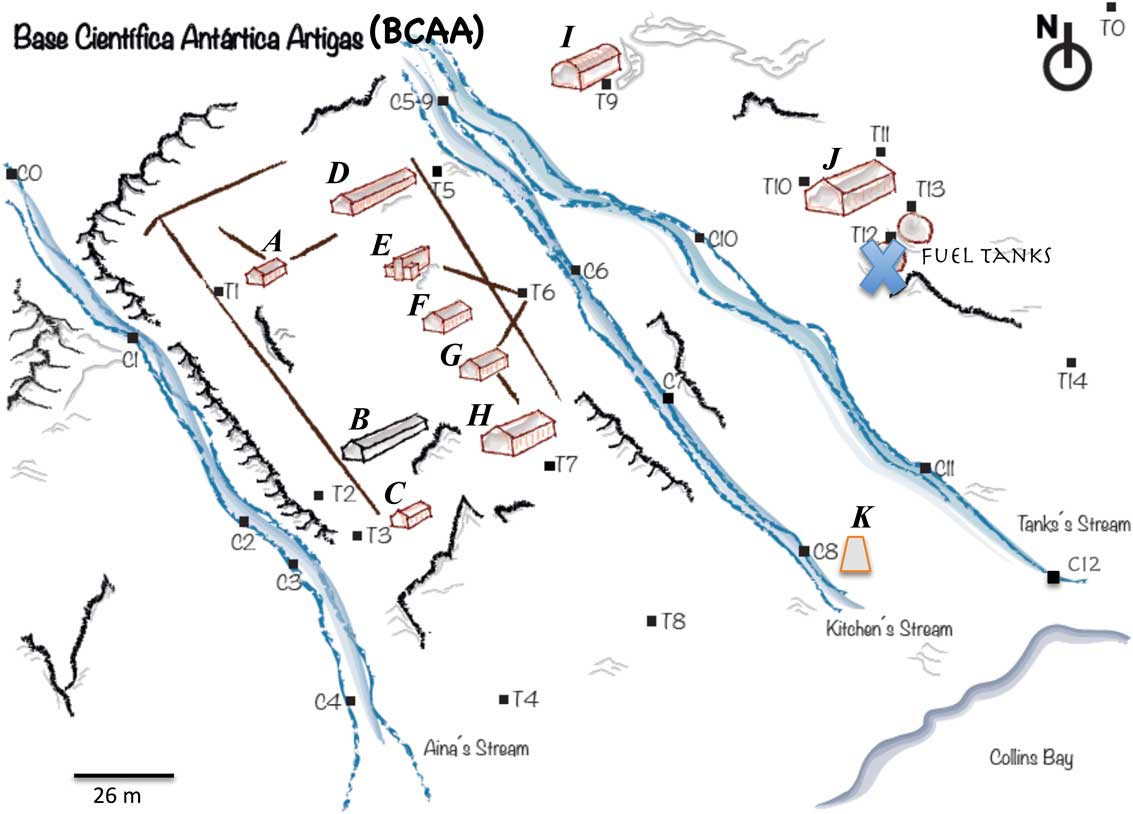
Fig. 2 Sketch of the Artigas Research Station (BCAA) showing the location of the sampling sites (based on a Google Earth image). The 11 buildings of the BCAA are: A=radio, B=AINA (scientist staff bedrooms and labs), C=head of station house, D=cavern (water deposit and gym), E=crew housing, F=supply depot, G=nursery, H=kitchen/dining room, I=hangar, J=service area (incinerator, generator room, old and new fuel tanks) and K=boat storeroom. Data from station T12 is not available.
Soil and surface sediment samples were collected in January and early February 2015 at 26 sites positioned using a GPS (see Table I for co-ordinates). Fourteen sites were located in the ground adjacent to the BCAA buildings (‘T’ sites), while the other 12 (‘C’ sites) were positioned throughout the areas of the meltwater streams close to the BCAA (Fig. 2). The top layer (0–2 cm) of undisturbed soil or sediment was collected using a stainless steel scoop or a corer, respectively. Samples were conditioned in pre-muffled (450°C, 4 h) aluminium containers and stored at -20°C. The material was freeze-dried, carefully homogenized in a mortar and kept in clean glass bottles until laboratory analysis. At each site, a second soil or sediment sample was taken for grain size analysis.
Table I Co-ordinates and percentage of grain size fractions in soil and sediment samples from Artigas Station.

n.a.=not available.
Analytical methods
Grain size analysis was performed by the standard dry sieve method as described in Suguio (Reference Suguio1973). Gravel and different sand classes were separated from fine sediments (<63 μm; silt + clay).
The analytical method for hydrocarbons was adapted from UNEP (1992). Aliquots of 20 g of soil or sediment were Soxhlet extracted for 8 h with dichloromethane (DCM)/n-hexane (1:1, v:v). A mixture of surrogates (hexadecene and eicosene to AHs and naphthalene-d8, acenaphtene-d10, phenanthrene-d10, crysene-d12 and perylene-d12 to PAHs) was added to each sample before extraction. Extracts were concentrated on a rotary evaporator to 1 ml and fractionated by column chromatography using 5% deactivated alumina and silica. Organic compounds were eluted with 10 ml of n-hexane (F1, AHs) and 15 ml of DCM/n-hexane (3:7) mixture (F2, PAHs). F1 and F2 were concentrated to 1 ml and the internal standards tetradecene (AHs) and benzo[b]fluoranthene-d12 (PAHs) were respectively added before gas chromatographic (GC) analysis. The AHs were analysed in an Agilent GC (model 6890) with flame ionization detector (GC-FID) and a capillary fused silica column coated with 5% diphenyl dimethylsiloxane (50 m length, 0.32 mm ID and 0.17 μm film thickness). Hydrogen was used as the carrier gas. The oven temperature for AH detection was programmed to ramp from 40°C, held for 2 min, 40–60°C at 20°C per min, then increased to 290°C at 5°C per min, held for 5 min, and finally increased to 300°C at 10°C per min, remaining constant for 10 min. The injector and detector temperature was 300°C and 325°C, respectively. The PAHs were analysed in an Agilent GC (model 6890) coupled to an Agilent mass spectrometer detector (model 5973N) (GC/MS) and a capillary fused silica column coated with 5% diphenyl dimethylsiloxane (30 m length, 0.25 mm ID and 0.25 μm film thickness). Helium was used as the carrier gas. The oven temperature ramping programme was the same as used for AHs. Data acquisition was undertaken in the SIM mode and the Agilent enhanced chemstation G1701 CA was used to perform the measurements. Individual PAHs were identified and confirmed matching their retention times and their mass to charge ratios with the results of standard mixtures. Quantification was performed by the surrogate peaks area method and a five-point calibration curve for each class of compounds analysed (r>0.995). Procedural blanks were performed for each group of ten samples and no peaks interfere with the analyses of target compounds. Recovery of surrogates ranged from 70–98% for AHs and PAHs. Detection limits (DLs) were obtained as three times the standard deviation of the signal in the same retention time of compounds analysed in the blanks. The DL was 0.001–0.034 μg g-1 for n-alkanes and 1.00–3.70 ng g-1 for PAHs. Concentrations of target compounds in reference material provided by the International Atomic Energy Agency (IAEA-408) were also analysed and their concentrations were in agreement with certified values. The 36 PAH compounds detected in the samples were naphthalene, methylnaphthalene, biphenyl, ethylnaphtalene, dimethylanthracene, acenaphthylene, acenaphthene, trimethylnaphthalene, fluorene, methylfluorene, dibenzothiophene phenanthrene, anthracene, dimethylfluorene, methyldibenzothiophene, methylphenanthrene, dimethyldibenzothiophene, dimethylphenanthrene, fluoranthene, pyrene, methylfluoranthene, rethene, methylpyrene, benzo[c]phenenthrene, benzo[a]anthracene, chrysene, methylchrysene, dimethylchrysene, benzo[b]fluoranthene, benzo[j]fluoranthene, benzo[k]fluoranthene, benzo[e]pyrene, benzo[a]pyrene, perylene, indeno[1,2,3-c,d]pyrene and benzo[g,h,i]perylene.
Since natural samples consist of complex hydrocarbon mixtures, several diagnostic indices, in addition to absolute concentrations, were used to identify the origin (anthropogenic or biogenic) and probable sources of AHs and PAHs in soil and surface sediments. Spearman’s correlation analysis was carried out with soil/sediment fractions, AHs and PAHs to explore any relationship between grain size and hydrocarbon distribution. A significance level of α=0.05 was established for Spearman’s correlation coefficients. Data analysis was performed using the software package BioEstat 4.0 (Ayres et al. Reference Ayres, Ayres, Ayres and Santos2005).
Results
Soil and sediment grain size
Coarse sediment fractions (gravel and coarse sand) dominated at most of the sites. The gravel fraction ranged between 8.95% (site T13) and 94.10% (site T3), and the coarse sand fraction from 3.29% (site T3) to 66.40% (sites C5–C9) (Table I). Mud (silt + clay) varied between 1.25% at site T3 and 32.71% at site C1. The highest mud content was recorded in sites T14, C0, C1 and C2 (Table I).
Aliphatic hydrocarbons
Total AHs in soil samples close to the BCAA ranged between 0.57 µg g-1 (site T0) and 2332 µg g-1 (site T13). In sediment samples from the meltwater streams, AHs ranged from 1.73–170 µg g-1 (sites C5 and C8, respectively; Fig. 3 and Table II). The highest AH levels were recorded at sites C8, T11 and T13 (Fig. 3 and Table II).
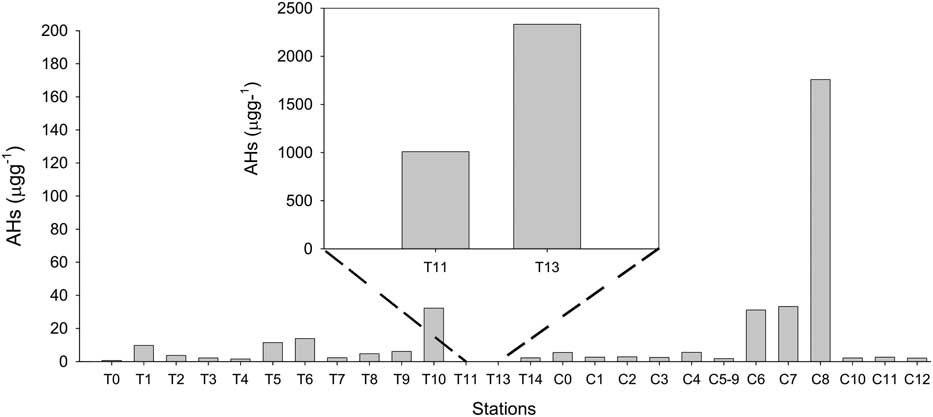
Fig. 3 Total aliphatic hydrocarbon (AH) concentrations (μg g-1) in soil and meltwater stream sediments from Artigas Station.
Table II Aliphatic hydrocarbon (AH) concentrations and related parameters in soil and sediments from Artigas Station.

CPI1=1/2 (Σ odd C15–21/Σ even C14–20)+Σ odd C15–21/Σ even C16–22).
CPI2=1/2 (Σ odd C25–35/Σ even C24–34)+Σ odd C25–35/Σ even C26–36).
CPI1=Carbon Preference Index for short-chain (<C21) n-alkanes, CPI2=Carbon Preference Index for long-chain (>C25) n-alkanes, n.a.=not available, n.c.=not calculated, n.d.=not detected, Phy=phytane, Pri=pristane, UCM=unresolved complex mixture.
Total n-alkane (C12–C36) concentrations in soil varied between 0.39–351 µg g-1 (sites T0 and T13, respectively; Table II), while in surface sediments they ranged between 1.78 µg g-1 (site C5) and 5.56 µg g-1 (site C8). Among the short-chain n-alkanes (<C21), C14, C16 and C18 were the most abundant, while among the long-chain homologues (>C25), C27 and C29 dominated. At most of the sites short-chain n-alkanes were present at higher concentrations compared with long-chain n-alkanes (Table II). The unresolved complex mixture (UCM) was detected only at sites T10, T11, T13, C7 and C8, and presented with the highest concentrations at site T13 (1544 µg g-1; Table II). At these sites the UCM corresponded to 66.23–86.63% of total AHs (see example chromatograms found at http://dx.doi.org/10.1017/S0954102018000019).
A Carbon Preference Index (CPI) for both short-chain (<C21) and long-chain (>C25) homologues was calculated. The CPI1 calculated for short-chain n-alkanes was 0.18–1.27 for ground sites (T7 and T2, respectively) and 0.04–1.59 for meltwater stream sites (C8 and C7, respectively) (Table II). The CPI2 calculated for long-chain n-alkanes was 1.16–7.03 for ground sites (T13 and T0, respectively) and 1.31–6.62 for meltwater stream sites (C4 and C1, respectively) (Table II). The pristane/phytane (Pri/Phy) ratios ranged from 0.37–1.57 (T7 and T11, respectively) and 0.73–1.52 (C11 and C6) for ground and meltwater stream sites, respectively (Table II). For several sites this ratio could not be calculated because of the absence of pristane.
Polycyclic aromatic hydrocarbons
Total PAH concentrations (expressed as the sum of the 36 compounds identified) in soil samples ranged from 1.36 ng g-1 at site T0 to 51650 ng g-1 at site T13 (Fig. 4 and Table III). In surface sediment samples, PAHs ranged from 21.56–751 ng g-1 at sites C12 and C8, respectively (Fig. 4 and Table III). The highest total PAH concentrations were recorded at sites T10, T11 and T13 (Fig. 4 and Table III).
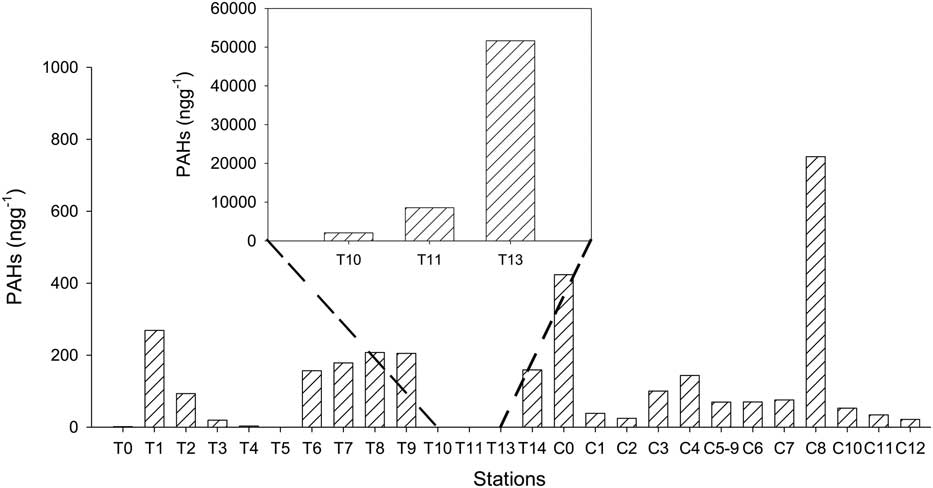
Fig. 4 Total polycyclic aromatic hydrocarbon (PAH) concentrations (ng g-1) in soil and meltwater stream sediments from Artigas Station.
Table III Polycyclic aromatic hydrocarbon (PAH) concentrations and related parameters in soil and sediments from Artigas Station.

Σ16 PAHs=total priori compounds according to USEPA, LMW=low molecular weight (2–3 aromatic rings), HMW=high molecular weight (4–6 aromatic rings), n.a.=not available, n.c.=not calculated, n.d.=not detected.
Concentrations of the 16 PAHs considered as priority pollutants by the United State Environmental Protection Agency (USEPA) ranged between 3.91 ng g-1 (site T3) and 2524 ng g-1 (site T13) (Table III). Sites T10, T11 and T13 showed the highest levels of these compounds (Table III). Low molecular weight (LMW) PAHs (compounds with two to three aromatic rings) showed concentrations between 1.36 ng g-1 (site T0) and 49 201 ng g-1 (site T13) (Table III). High molecular weight (HMW) PAHs (compounds with four to six aromatic rings) ranged from 1.23–2448 ng g-1 at sites C4 and T13, respectively (Table III). In all the sites, alkylated homologues, such as methylnaphthalene, dimethylnaphthalene and trimethylnaphthalene, dominated (for examples see Fig. 5a & b). The highest concentration of alkylated PAHs was recorded at site T13 (Table III and Fig. 5b).
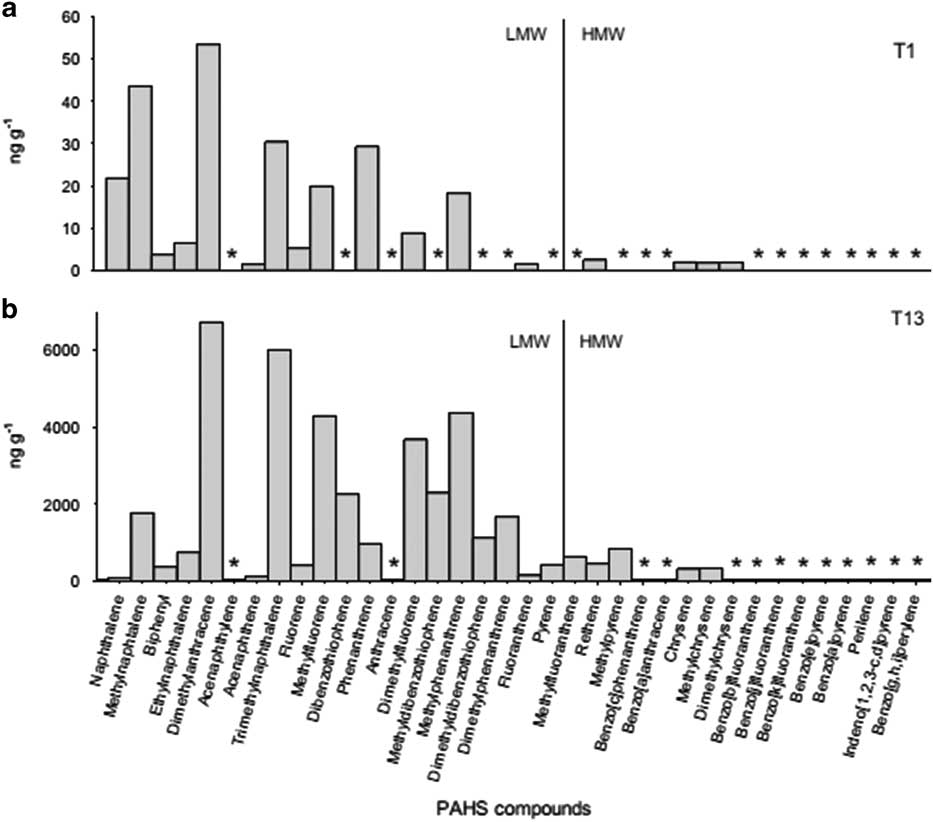
Fig. 5 Concentrations of low molecular weight (LMW) and high molecular weight (HMW) polycyclic aromatic hydrocarbons (PAHs) in samples from Artigas Station (sites a. T1 and b. T13). *Indicates concentration ≤20.0 ng g-1 or no detected compounds.
The LMW/HMW PAHs ratio was>1 for most of the sites, except site C6 (Table III). The ratios anthracene/anthracene + phenantrene (Ant/178), fluoranthene/fluoranthene + pyrene (Fl/202) and benzo[a]anthracene/benzo[a]anthracene + chrysene (Bz[a]A/228) were only calculated for sites T10, T11, T13 and C8, where these compounds were recorded. These ratios were used to distinguish different sources of PAHs. At sites T10, T11 and T13, the Ant/178 ratio was<0.10 and the Fl/202 ratio showed values<0.40 (Fig. 6a). Site C8 showed Ant/178>0.10 and Fl/202>0.50. The Bz[a]A/228 ratio presented values<0.20 at sites T11, T13 and C8, and 0.20–0.35 at site T10 (Fig. 6b). Based on these ratios, the main sources of PAHs at these sites are petroleum (crude oil) and combustion.

Fig. 6 Plots of the polycyclic aromatic hydrocarbon (PAH) isomer pair ratios at sites T10, T11, T13 and C8 based on Yunker et al. (Reference Yunker, Macdonald, Vingarzan, Mitchell, Goyette and Sylvestre2002). a. Anthracene/(anthracene + phenantrene) (Ant/178) vs fluoranthene/(fluoranthene + pyrene) (Fl/220) and b. Benzo[a]anthracene/(benzo[a]anthracene + chrysene) (Bz[a]A/228) vs fluoranthene/(fluoranthene + pyrene) (Fl/220).
Correlation matrix results
Among the different grain size fractions considered, only fine sand and mud (silt + clay) showed a significantly positive correlation with each other (Table IV). Neither AHs nor PAHs showed significant correlations with any of the grain size fractions. Whereas, total AHs, total n-alkanes, short-chain n-alkanes, long-chain n-alkanes, total PAHs, and LMW, HMW and alkylated compounds all presented significant highly positive correlations among themselves (Table IV). Thus, hydrocarbon deposition seems to be related to the proximity of the source but not connected with soil/sediment grain size. Both AHs and PAHs may derive from the same sources.
Table IV Matrix correlation results among soil/sediment fractions, aliphatic (AHs) and polycyclic aromatic hydrocarbons (PAHs).

Significant (P<0.05) Spearman’s correlation coefficients are shown in bold.
LC=long-chain (>C25), SC=short-chain (<C21), LMW=low molecular weight (2–3 aromatic rings), HMW=high molecular weight (4–6 aromatic rings).
Discussion
Levels and sources of aliphatic hydrocarbons in soil and meltwater stream sediments near Artigas Station
At sites T11, T13 and C8, the concentration of total AHs exceeded the threshold value of 100 µg g-1 proposed as an indicator of oil pollution in marine sediments (Volkman et al. Reference Volkman, Holdsworth, Neill and Bvor1992). Whereas, at the remaining sites AHs levels were below this limit. The high UCM concentration at sites T11, T13 and C8 indicates petroleum residues, supporting cumulative oil inputs and biodegraded oil (Commendatore et al. Reference Commendatore, Nievas, Amin and Esteves2012). Sites T11 and T13 are located in the service area, adjacent to the generator room and the fuel tanks (old and new), respectively. Therefore, oil may be related to accidental spills of fossil fuel during transportation to the generators and storage in the old tanks. The old storage tanks were in poor condition and were replaced. In site C8 located next to the boat storeroom the presence of petroleum residues may be related to boat traffic. In late February 2015, fuel discharge was made directly from the Uruguayan Navy vessel ROU Vanguardia to the new fuel storage tanks through a pipe for the first time. Since then, the transport of fuel from the new tanks to the generators has also been through a closed pump system. Furthermore, the old fuel tanks were dismantled to be returned to Uruguay. It is expected that these changes in fuel handling will reduce the risk of leaks and their impact on the Antarctic environment near the BCAA. The occurrence of low concentrations of the UCM at site C7 may be related to occasional wastewater leaks from the septic tank of the kitchen/dining room that drains to the kitchen’s stream. The wastewater contains human effluents and associated nutrients (nitrogen, phosphorous), microorganisms (including potential pathogens), organic matter, detergents, heavy metals, disinfection by-products and hydrocarbons (Smith & Riddle Reference Smith and Riddle2009). Wastewater contamination has been recently reported at the BCAA (Tort et al. Reference Tort, Iglesias, Bueno, Lizasoain, Salvo, Cristina, Kandratavicius, Pérez, Figueira, Bícego, Taniguchi, Venturini, Brugnoli, Colina and Victoria2017).
As expected, site T0 located c. 100 m from pollution sources showed the lowest AHs level. AHs levels at sites T11, T13 and C8 are higher than levels recorded in surface marine sediments near other Antarctic research stations with clear evidence of oil pollution (Martins et al. Reference Martins, Bícego, Taniguchi and Montone2004, Dauner et al. Reference Dauner, Hernández, MacCormack and Martins2015). In contrast, AH concentrations in the other sites are within the range reported for unpolluted (<100 µg g-1) soil and/or marine sediments near other Antarctic research stations (e.g. Dauner et al. Reference Dauner, Hernández, MacCormack and Martins2015). Pristane and phytane are dominant in highly weathered crude oil but they may also have biogenic sources (Colombo et al. Reference Colombo, Pelletier, Brochu and Khalll1989). They derive from the phytol side chain of chlorophyll under reducing (phytane) or oxidizing (pristane) diagenetic conditions. Pristane to phytane ratios (Pri/Phy) of about one have been related to petroleum sources (Commendatore et al. Reference Commendatore, Nievas, Amin and Esteves2012). In addition, Pri/Phy ratios considerably lower than one have been linked to the presence of petroleum and/or reducing depositional environments (Moustafa & Morsi Reference Moustafa and Morsi2012). Pri/Phy ratios at the BCAA were close to or lower than one in all the sites measured, which may be related to the prevalence of reducing conditions in soil and sediments, besides petroleum inputs. The absence of pristane in several sites reinforced the likelihood of the occurrence of anoxic hydrocarbon biodegradation processes (Prus et al. Reference Prus, Fabianska and Labno2015). Site T11, adjacent to the generator room, and site T13, next to the fuel tanks, presented Pri/Phy ratios close to one, confirming the occurrence of oil pollution and weathered or degraded crude oil in these sites (e.g. Colombo et al. Reference Colombo, Pelletier, Brochu and Khalll1989).
For most of the sites, CPI1 was<1 indicating even carbon number predominance in short-chain n-alkanes. Even carbon number predominance in short-chain n-alkanes in soil and sediments is related to bacteria, fungi and yeast species, but also to petroleum-derived inputs (Harji et al. Reference Harji, Yvenat and Bhosle2008, Yu et al. Reference Yu, Li, Guo and Zou2016). In contrast, CPI2 was>1 for most of the sites indicates odd carbon number predominance in long-chain n-alkanes, which has been linked to terrestrial higher plant inputs (Yu et al. Reference Yu, Li, Guo and Zou2016). Therefore, in soil and sediments from meltwater stream sites near the BCAA that are not impacted by humans the biogenic AHs seem to be derived from microbial and terrestrial inputs. Maximum abundances of C27 and C29 have been linked to lichens, mosses and the Antarctic pearlwort (Cabrerizo et al. Reference Cabrerizo, Tejedo, Dachs and Benayas2016). High abundances of the lichen Usnea aurantiaco-atra (Jacq.) Bory and other species have been previously reported in areas around the BCAA (Piñeiro et al. Reference Piñeiro, Eguren, Pereira and Zaldúa2012). Anthropogenic sources of short-chain n-alkanes may be related to light oils such as diesel (Green & Nichols Reference Green and Nichols1995). In addition, CPI values close to one, as was recorded at site T13 located next to the fuel tanks, are indicative of anthropogenic sources from raw hydrocarbons and combustion of fossil fuels, and have been reported near other Antarctic stations (e.g. Cabrerizo et al. Reference Cabrerizo, Tejedo, Dachs and Benayas2016). Therefore, anthropogenic inputs of AHs at human-impacted sites near the BCAA seem to derive from petroleum contributions; however, wastewater inputs are another potential source.
Levels and sources of polycyclic aromatic hydrocarbons in soil and meltwater stream sediments near Artigas Station
Based on the classification proposed by Baumard et al. (Reference Baumard, Budzinski, Michon, Garrigues, Burgeot and Bellocq1998) sites T0, T2, T3, T4 and T5 and most of the sites around the meltwater streams were categorized with low levels of PAH contamination (0–100 ng g-1). In addition, sites T1, T6, T7, T8, T9, T14, C0, C3, C4 and C8 were categorized with moderate PAH contamination (100–1000 ng g-1). Site T10, T11 and T13 were categorized with high (1000–5000 ng g-1) or very high (> 5000 ng g-1) levels of PAH contamination. High concentrations of both total PAHs and the 16 priority PAHs at sites C8, T10, T11 and T13 confirmed this distributional pattern of PAHs. Major sources of anthropogenic PAHs in environmental samples are combustion processes and the release of uncombusted products (e.g. Yunker et al. Reference Yunker, Macdonald, Vingarzan, Mitchell, Goyette and Sylvestre2002). Based on isomer ratios, PAHs in sites C8, T10, T11 and T13 most probably originate from high-temperature biomass and petroleum combustion, and from petroleum-derived PAHs (Yunker et al. Reference Yunker, Macdonald, Vingarzan, Mitchell, Goyette and Sylvestre2002, Xue et al. Reference Xue, Chen, Lu, Wang, Yang, Zhang and Cai2016). These findings may be linked with the proximity of sites T10, T11 and T13 to the incinerator, the generator room and the fuel tanks, and with boat traffic at site C8 located next to the boat storeroom. The HMW PAHs (four to six aromatic rings) are generated by diesel vehicles, power plant and open-field burning of organic wastes, and are mainly associated with soot and black carbon (Cornelissen et al. Reference Cornelissen, Gustafsson, Bucheli, Jonker, Koelmans and van Noort2005). High concentrations of HMW PAHs at sites T10, T11, T13 and C8 indicate that at the BCAA pyrogenic sources are restricted. However, the predominance of LMW PAHs and alkylated homologues is generally attributed to the use of a Special Antarctic Blend diesel as fuel (Kennicutt et al. Reference Kennicutt, McDonald, Denoux and McDonald1992, Green & Nichols Reference Green and Nichols1995) and has been reported in other studies (e.g. Curtosi et al. Reference Curtosi, Pelletier, Vodopivez and MacCormack2007, Dauner et al. Reference Dauner, Hernández, MacCormack and Martins2015, Xue et al. Reference Xue, Chen, Lu, Wang, Yang, Zhang and Cai2016). The dominance of LMW PAHs has been also linked to natural Antarctic vegetation, such as lichens and mosses (Cabrerizo et al. Reference Cabrerizo, Dachs, Barceló and Jones2012), and to local sources related to low temperature combustion and diesel transport (Xue et al. Reference Xue, Chen, Lu, Wang, Yang, Zhang and Cai2016). Furthermore, high levels of alkylated PAHs are derived mainly from petrogenic sources (Cabrerizo et al. Reference Cabrerizo, Dachs, Barceló and Jones2012). Therefore, the dominance of LMW PAHs and alkylated compounds in almost all of the sites near the BCAA seem to be related mainly to petrogenic sources, such as diesel spills, at the contaminated sites or to natural Antarctic vegetation in the sites not impacted by humans.
Comparison between hydrocarbon levels at Artigas Station with other Antarctic research stations
Total AH and n-alkane concentrations in soil and meltwater stream sediments at the BCAA were considerably higher than the levels reported for pristine or nearly pristine areas in Antarctica (e.g. Nelson Island and Potter Cove) (Table V). AH and n-alkane levels reported here were higher than those previously stated for surface marine sediments near the BCAA and in the vicinity of other research stations including the Presidente Frei, Bellingshausen and Great Wall stations (Préndez et al. Reference Préndez, Barra, Toledo and Richter2011) (Table V). The levels recorded at sites T11, T13 and C8 were higher than those found in human impacted areas such as the Ardley Island, Great Wall and Davis stations (Green & Nichols, Reference Green and Nichols1995, Préndez et al. Reference Préndez, Barra, Toledo and Richter2011, Dauner et al. Reference Dauner, Hernández, MacCormack and Martins2015) (Table V). Total PAH concentrations recorded in soil samples near the BCAA were comparable to those reported near other research stations in Antarctica (Table V). The highest concentrations found at the sites T10, T11 and T13 were equivalent to levels reported in surface sediments of highly impacted areas near the old Palmer and McMurdo stations (Kennicutt et al. Reference Kennicutt, McDonald, Denoux and McDonald1992, Mazzera et al. Reference Mazzera, Hayes, Lowenthal and Zielinska1999) (Table V). In addition, total PAH concentrations recorded in surface sediments from the meltwater streams (except site C8) were similar to those reported in marine surface sediments in areas of low human impact close to other research stations (e.g. Carlini Station in Potter Cove) (Dauner et al. Reference Dauner, Hernández, MacCormack and Martins2015) (Table V).
Table V Total aliphatic hydrocarbon (AH), n-alkane and polycyclic aromatic hydrocarbon (PAH) concentrations reported near other Antarctic research stations compared with levels reported in the present study for Artigas Station (adapted from Dauner et al. Reference Dauner, Hernández, MacCormack and Martins2015).

a=before the station was installed, b=meltwater stream sediment, i=intertidal sediment, m=surface marine sediment, s=surface soil.
Conclusions
This work has established the occurrence of local petroleum contamination at the BCAA with the highest levels restricted to sites T10, T11, T13 and C8 (Fig. 7). These sites are exposed to hydrocarbon inputs mainly derived from petrogenic sources but also with certain pyrogenic inputs. Based on the levels of AHs and PAHs detected, sites in the service area, where the incinerator, the generator room and the fuel tanks are located, and next to the boat storeroom are heavily impacted, while the remaining sites showed moderate to low levels or no contamination. Anthropogenic hydrocarbon sources at the BCAA predominate over biogenic sources and are related to fossil fuel and organic residue combustion, fuel storage and boat traffic. Natural sources seemed to derive from microbial and terrestrial inputs.
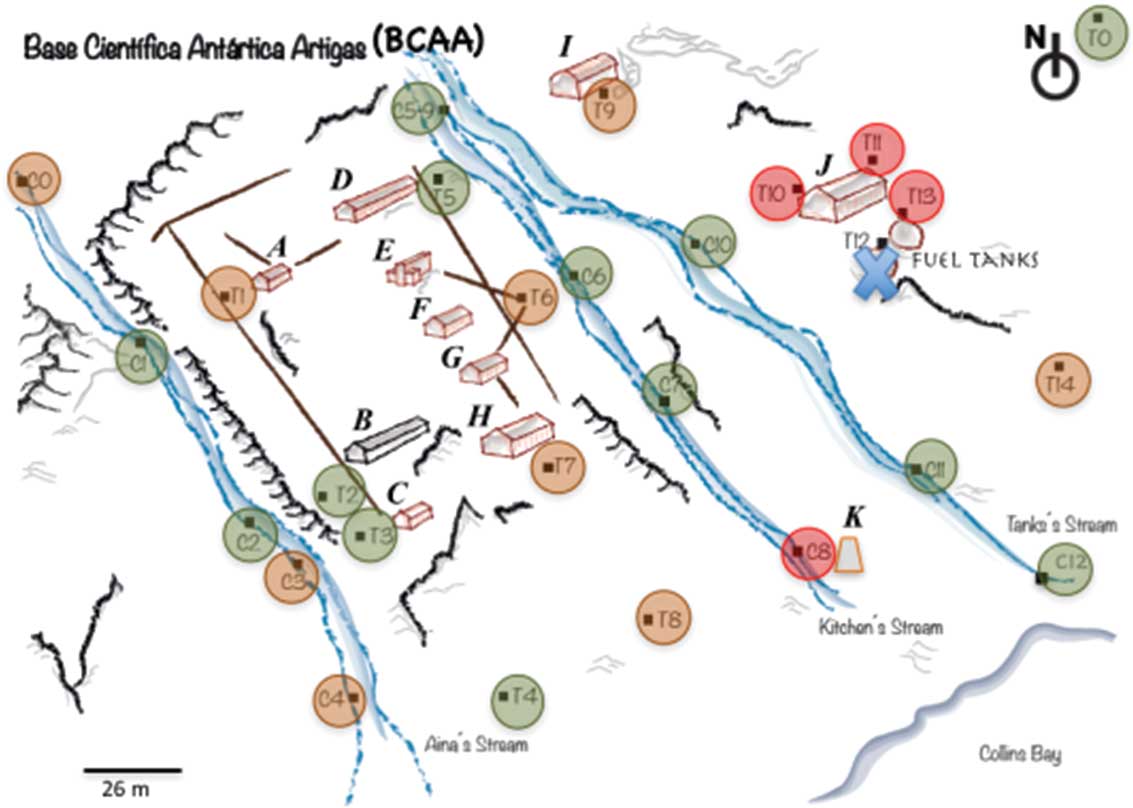
Fig. 7 Summary of hydrocarbon contamination distribution at the Artigas Station. No or low contamination=green circles, moderate contamination=orange circles, high contamination=red circles.
Petrogenic contamination in the area close to the BCAA is relatively high as found in impacted areas near other Antarctic stations, but is restricted to the boat storeroom and the service area. It is expected that improvements made in fuel management and the removal of the old fuel tanks will reduce the risk of diesel leaks and their impact on the Antarctic environment near the BCAA. Future monitoring of the degradation process of these contaminants under extreme climatic conditions is recommended, as is investigation of the possibility of applying bioremediation measures. This work provides reference information for future environmental monitoring.
Acknowledgements
We would like to thank our colleagues from the LabQOM for assistance with laboratory analysis. The Instituto Antártico Uruguayo (IAU) is fully acknowledged for providing support during fieldwork and research execution (Project IAU-P-DCC-15). The Laboratorio Tecnológico del Uruguay (LATU) provided financial support for hydrocarbon analysis (LATU-5000005779). PEDECIBA Geociencias and SNI-ANII supported C. Rodríguez and N. Venturini, respectively. We are also grateful to the Artigas Station crew ‘Antarkos XXXI’ for their support during sampling surveys. Many thanks to Magdalena Rodríguez who did the sketch of the Artigas Station. We are very grateful for the comments and suggestions of two anonymous reviewers and Professor David W.H. Walton, which helped us to improve an earlier version of this manuscript.
Author contributions
EB and NV developed and implemented the survey and together with KI, NK and CB participated in the collection of field samples. MCB, ST and STS conducted the hydrocarbon analysis. CB performed the grain size analysis. CR and NV analysed the data and wrote the article. All authors collectively collaborated in the discussion of results, and the editing and organization of the manuscript.
Data deposit
The depository of hydrocarbon data for this article is the Laboratorio de Biogeoquímica Marina (LABIM), Instituto de Ecología y Ciencias Ambientales, Facultad de Ciencias, Universidad de la República. All data will be available from the corresponding author upon request.
Supplementary material
Example chromatograms will be found at https://doi.org/10.1017/S0954102018000019.


