


The reported global high prevalence of vitamin D deficiency( Reference Hilger, Friedel and Herr 1 ) and the growing scientific evidence suggesting that low serum 25-hydroxyvitamin D (25(OH)D) levels are associated with an increased risk of osteoporosis, diabetes, cancer and autoimmune disorders( Reference Pludowski, Holick and Pilz 2 ) have exponentially increased the interest in this vitamin during the last decade. In 2011 the Institute of Medicine proposed an increase in the dietary recommendations for vitamin D( 3 ). However, the fact that vitamin D can be obtained not only from food but also through skin synthesis makes it a unique micronutrient( Reference DeLuca 4 ), increasing the complexity in defining appropriate strategies to achieve the necessary serum 25(OH)D levels.
Intra- and inter-subject variation in UVB exposure can be high( Reference Abbas, Linseisen and Rohrmann 5 ) and the internal production of vitamin D is dependent on several factors such as age, skin pigmentation, sunscreen use, clothing, amount of skin exposed, season of the year and latitude( Reference Holick 6 ). In some regions such as the northern hemisphere at latitudes greater than 40°N, cutaneous synthesis of vitamin D is not enough mainly during the winter season. Therefore, although the contribution of vitamin D intake to the overall status is considered of minor importance, it might be particularly relevant when the cutaneous synthesis is limited. Consequently, dietary vitamin D can be essential to maintain a healthy vitamin D status( Reference Spiro and Buttriss 7 ).
Nevertheless, there are few naturally occurring food sources of vitamin D, of which consumption might not be sufficient to offset the deficit in cutaneous synthesis, especially during the winter months( Reference Spiro and Buttriss 7 ). This illustrates the challenge regarding public health messages concerning the increase in vitamin D, given the complexity of the relationship between vitamin D intake and serum 25(OH)D concentration.
The available evidence shows low vitamin D intake levels among European children and adolescents, as well as high prevalence of low 25(OH)D status( Reference Spiro and Buttriss 7 , Reference Gonzalez-Gross, Valtuena and Breidenassel 8 ). In this age group, vitamin D is essential for Ca absorption and bone growth and accretion. Additionally, due to behavioural changes in this period, namely an increase in autonomy( Reference Shepherd and Dennison 9 ) in diverse aspects, including diet, the effect of vitamin D intake on 25(OH)D concentration may differ from when under family supervision. This change in eating habits reinforces the importance of identifying which food sources are potential intervention targets.
Based on a Portuguese adolescent population-based cohort, the present study aimed to examine the relationship between dietary vitamin D and serum 25(OH)D levels to understand the role of vitamin D intake in the overall vitamin D status.
Methods
Participants were adolescents, members of the Epidemiological Health Investigation of Teenagers in Porto (EPITeen). As reported elsewhere( Reference Ramos and Barros 10 ), we evaluated adolescents born in 1990, who were enrolled at public and private schools in Porto, Portugal, during the 2003/2004 school year. Data were collected using two self-administered questionnaires: one was completed at home with the help of parents or legal guardians, and included an FFQ; the other was filled out at school during the research team visit and comprised information on health-related behaviours. Additionally, a physical examination was performed at school, by a team of experienced nurses, nutritionists and physicians, comprising anthropometric assessment and a venous blood sample drawn after an overnight fast.
Subjects
We identified 2786 eligible participants, of whom 2159 agreed to participate and provided information at least for part of the planned assessment, resulting in an overall participation rate of 77·5 %, similar in public (77·6 %) and private (77·0 %) schools (P=0·726).
Of the 2159 participants, 247 did not return the home questionnaire and 297 did not fill in the FFQ or were excluded because no information was provided on more than 10 % of food items. A further ninety-three participants were not considered for the current analysis because their total energy intake was more than 3 times the interquartile range or their reported intake of fruit or vegetables was more than 1·5 times the interquartile range. Of the 1522 with data for food intake, 471 did not participate in blood collection. Due to budgetary constraints, we evaluated serum 25(OH)D levels for half of the sample, selecting those who had dietary information (n 521) and who participated in the subsequent follow-ups of the cohort.
Characteristics of participants included in the current analysis were compared with those of the remaining cohort participants. Generally, both groups were similar, but participants not included were mostly from public schools, whose parental education was lower, participated in higher-intensity leisure-time activities and had a higher vitamin D intake.
Vitamin D intake
Vitamin D intake was evaluated using an FFQ covering the previous 12 months, filled out by the adolescents with the help of their parents or legal guardians. The FFQ was designed according to Willett( Reference Willet 11 ), adapted for the Portuguese population and validated for the adult population by comparison with four 7 d food records (each one in a different season of the year)( Reference Lopes, Aro and Azevedo 12 ). Then it was adapted for adolescents by including foods more frequently eaten by this age group( Reference Araujo, Severo and Lopes 13 ). The FFQ comprised ninety-one food items or food groups and a frequency section with nine possible responses ranging from never to six or more times per day. An open-ended section was also included for foods not listed in the questionnaire, but eaten at least once weekly. Food intake data were obtained by multiplying the frequency of consumption of each food item by the nutrient content of the mean portion size. Seasonal variation of food consumption was also considered according to participants’ replies. To estimate nutrient intakes, we used the software Food Processor Plus® (ESHA Research, Salem, OR, USA) based on values from the US Department of Agriculture. Values for Portuguese foods were added, based on the Portuguese tables of food composition, typical recipes and data from previous studies( Reference Lopes, Aro and Azevedo 12 ).
Fourteen food groups were defined: (i) dairy (milk, yoghurt, cheese); (ii) meat (red and white meat, ham, sausages, pepperoni, smoked ham, bacon); (iii) seafood (fresh and canned fish, codfish, molluscs and crustaceans); (iv) eggs; (v) fats and oils (olive and other vegetable oils, margarine and butter); (vi) starchy (white bread or rusks and similar toasted products, brown bread, rye bread, cereal flakes, simple biscuits, wholegrain biscuits, rice, pasta, chips and boiled, baked and mashed potatoes); (vii) legumes (beans, chickpeas, peas, etc.); (viii) vegetables (cabbage, spinach, broccoli, onion, carrot, lettuce, peppers, tomato, cucumbers, etc.); (ix) vegetable soup; (x) fruit (fresh fruit, including tropical fruit and fresh fruit juice); (xi) sweets and pastry (other biscuits apart from simple ones, croissants, pastry, doughnuts, cakes, chocolates, chocolate snacks, dairy desserts, ice creams, quince jam, compote, jelly, honey, sugar, candy); (xii) non-alcoholic beverages (soda, juice, fruit juice); (xiii) fast food (pizza, hamburger, mayonnaise, savoury snacks); and (xiv) others (canned fruit, nuts, olives, coffee, barley coffee, black tea, green tea, barley). Only food groups that have contributed to vitamin D intake are presented herein.
Vitamin D supplements were not considered to quantify vitamin D intake.
Serum 25-hydroxyvitamin D
A venous blood sample was drawn after an overnight fast. All the samples were analysed at the central laboratory of the Hospital São João in Porto, Portugal. Serum 25(OH)D was determined using DiaSorin LIAISON®, which is a direct competitive chemiluminescence immunoassay for human serum or plasma intended for use on the DiaSorin LIAISON® automated analyser (DiaSorin SpA, Saluggia, Italy). The assay uses magnetic particles (solid phase) coated with antibody against 25(OH)D and 25(OH)D conjugated to an isoluminol derivative (tracer). During the first incubation phase (10 min), 25(OH)D is dissociated from binding protein by buffer containing 10 % v/v ethanol and then binds to the anti-25(OH)D antibody on the solid phase. After a second 10 min incubation with the tracer, the unbound material is washed off and starter reagents are added to generate a flash chemiluminescent signal which is measured by a photomultiplier and is inversely related to 25(OH)D concentration( Reference Wagner, Hanwell and Vieth 14 ).
Covariates
Weight and height were obtained with the participant in light indoor clothes and no shoes. Weight was measured in kilograms, to the nearest tenth, using a digital scale and height was measured in centimetres, to the nearest tenth, using a portable stadiometer. Adolescents were classified according to the age- and sex-specific BMI based on the Center for Disease Control and Prevention’s BMI-for-age growth charts( Reference Kuczmarski, Ogden and Guo 15 ).
Parental educational level was measured as the number of successfully completed years of formal schooling and adolescents were classified according to the parent with the highest educational level.
Leisure-time physical activity was evaluated according to a closed four-choice question of subjective intensity categories (mainly sitting, mainly standing, active or very active)( Reference Magalhaes, Severo and Autran 16 ).
Vitamin supplementation was assessed asking parents the question ‘Did your child take supplements in the past 12 months?’ If ‘yes’, information was gathered on commercial name and dosage of supplementation. Based on the commercial name, we confirmed the dose of vitamin D. However, it was not possible to confirm the composition of vitamins for a minority of participants (5 %). Since taking vitamin supplements implied the intake of high doses of vitamin D, participants were classified according to whether they had taken vitamin D-containing supplements, without considering the specific dosage.
Season during which participants were evaluated was combined into two categories: winter (November–February) and summer (March–June).
Statistical analysis
The distribution of quantitative variables was checked and results were presented as mean and standard deviation. Student’s t test and one-way ANOVA were used for group comparisons.
We modelled changes in vitamin D using the assumption that the seasonal pattern over 1 year had a 12-month periodicity and that high and low levels of activity occurred 6 months apart. This approach describes seasonal variation as the amplitude and phase of a cosine curve.
This method defines time in radians:
 $$y_{{it}} \,{\equals}\,B_{{i0}} {\minus}\left( {A_{i} /2} \right)\cos \left[ {2\pi \left( {t{\minus}F} \right)/12} \right],$$
where y
it
is vitamin D for individual i at time t, where t is in months, A
i
is the amplitude and F is the phase. Thus, with F
i
=0, the model predicts a minimum vitamin D serum value on 31 December of
 $$B_{{i0}} {\minus}A_{i} /2$$
.
$$B_{{i0}} {\minus}A_{i} /2$$
.
Amplitude was calculated as peak-to-trough distance, or the maximal difference between the highest and lowest serum 25(OH)D levels during the year. Timing of the peak vitamin D status during the year, or the phase, was also identified and was measured according to the month of the year. The model was fitted using non-linear least squares function. Two periods were tested: 6 and 12 months. However, the periodicity of 12 months showed a better fit (data not shown).
Pearson correlation coefficients were calculated to measure the association between vitamin D intake (from the FFQ) and serum 25(OH)D concentration. The agreement between vitamin D intake and serum 25(OH)D levels was assessed by calculating the percentage of participants who were classified into the same (perfect agreement) and opposite quartiles (extreme disagreement) of the intake/concentration distribution.
Statistical analyses were performed using the statistical software package IBM® SPSS® Statistics version 22.0 and the R package version 3.0.1, and statistical significance was considered with an α critical value of 0·05.
Results
Table 1 presents the mean dietary vitamin D and serum 25(OH)D levels according to participants’ characteristics. Despite the statistically significant differences observed in serum 25(OH)D concentration by sex, parental education and season of evaluation, none of these characteristics translated into significant differences in vitamin D intake. Instead, the differences verified for vitamin D intake according to BMI and vitamin supplementation were not reflected in differences in serum 25(OH)D concentration. Concordant results were found according to leisure-time physical activity, in which intake and serum 25(OH)D levels were higher among the most active participants. Seasonal variation in 25(OH)D concentration (ng/ml) is depicted in Fig. 1. Lowest levels were estimated for February (F=1·53, 95 % CI 0·07, 2·26) and the highest levels for August, with an amplitude of 3·78 (95 % CI 1·64, 6·22).
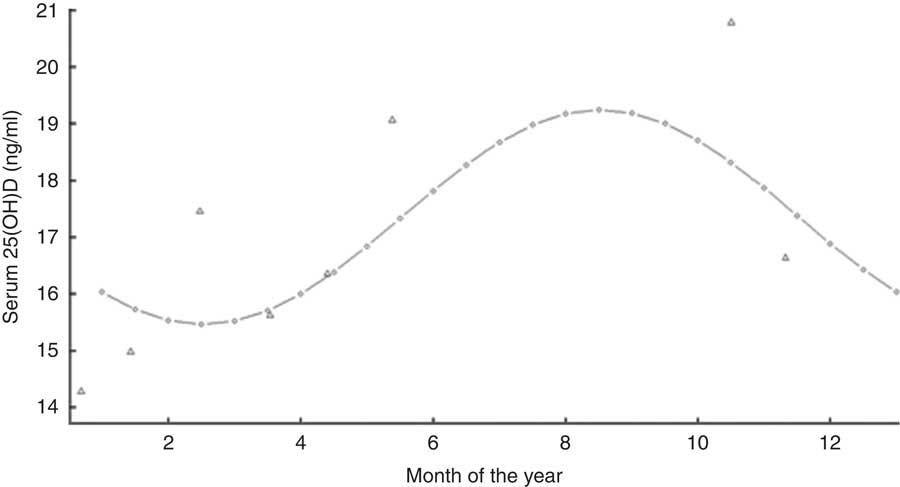
Fig. 1 Seasonal variation in serum 25-hydroxyvitamin D (25(OH)D) concentration (Δ, observed monthly means; ○, fitted values from the model) among Portuguese adolescents aged 13 years (n 521), EPITeen (Epidemiological Health Investigation of Teenagers in Porto) cohort, 2003/2004
Table 1 Serum 25-hydroxyvitamin D (25(OH)D) concentration and vitamin D intake (FFQ) according to participant characteristics among Portuguese adolescents aged 13 years (n 521), EPITeen (Epidemiological Health Investigation of Teenagers in Porto) cohort, 2003/2004
* According to the Center for Disease Control and Prevention’s BMI-for-age growth charts( Reference Kuczmarski, Ogden and Guo 15 ).
We evaluated the proportional contribution of food groups to vitamin D intake. The major provider was seafood (37·0 %), followed by starchy (17·5 %), meat (11·7 %), dairy (5·2 %), sweets and pastry (5·2 %), and eggs (3·7 %; Fig. 2). No intake differences were observed for the major providers, comparing summer and winter seasons (59·8 v. 60·0 g/d, P=0·903 for seafood and 97·4 v. 109·6 g/d, P=0·190 for starchy).

Fig. 2 Proportional contribution of food groups to vitamin D intake (FFQ) among Portuguese adolescents aged 13 years (n 521), EPITeen (Epidemiological Health Investigation of Teenagers in Porto) cohort, 2003/2004
A positive but not statistically significant correlation was observed between vitamin D intake and serum 25(OH)D concentration (r=0·056, P=0·203; Fig. 3).
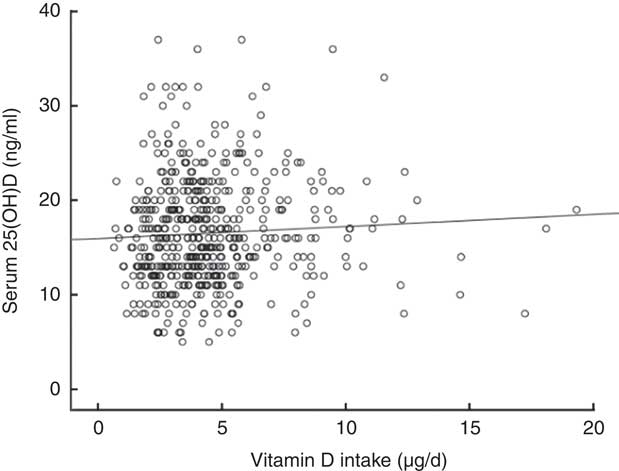
Fig. 3 Scatter plot depicting the relationship between vitamin D intake (FFQ) and serum 25-hydroxyvitamin D (25(OH)D) concentration among Portuguese adolescents aged 13 years (n 521), EPITeen (Epidemiological Health Investigation of Teenagers in Porto) cohort, 2003/2004. Pearson correlation coefficient, r=0·056, P=0·203
Additionally, we verified that the proportion of adolescents classified in the same quartile by both intake and serum (perfect agreement) was 27·0 % (Table 2). Overall, the best agreement was found in the lowest quartiles (42·0 %), with an agreement of 16·2 % for the second quartiles, 23·1 % for the third quartiles and 26·9 % for the highest quartiles.
Table 2 Distribution of participants by quartiles (Q) of vitamin D intake (FFQ) and serum 25-hydroxyvitamin D (25(OH)D) concentration among Portuguese adolescents aged 13 years (n 521), EPITeen (Epidemiological Health Investigation of Teenagers in Porto) cohort, 2003/2004 (weighted kappa=0·049)

Comparing serum 25(OH)D concentrations according to tertiles of consumption of the different food groups that contributed to vitamin D intake, 25(OH)D levels were similar for the different levels of intake (Table 3).
Table 3 Serum 25-hydroxyvitamin D (25(OH)D) concentration according to tertile (T) of consumption of different food groups that contributed to vitamin D intake (FFQ) among Portuguese adolescents aged 13 years (n 521), EPITeen (Epidemiological Health Investigation of Teenagers in Porto) cohort, 2003/2004

Discussion
We found a weak relationship between dietary vitamin D intake and serum 25(OH)D concentration, which might be explained by the low levels observed for both intake and serum 25(OH)D compared with the recommendations( 3 , Reference Holick, Binkley and Bischoff-Ferrari 17 ), as previously reported in this sample( Reference Cabral, Araujo and Teixeira 18 ). These results are in agreement with several studies that have identified a high prevalence of vitamin D intake inadequacy and serum 25(OH)D insufficiency in otherwise healthy adults and children living in North America( Reference Calvo and Whiting 19 , Reference Whiting, Green and Calvo 20 ) and Europe( Reference Spiro and Buttriss 7 , Reference Gonzalez-Gross, Valtuena and Breidenassel 8 , Reference Isaia, Giorgino and Rini 21 – Reference Diethelm, Huybrechts and Moreno 23 ).
Serum 25(OH)D levels varied in a sinusoidal pattern throughout the year, being higher in the summer and lower in the winter. This observation is in agreement with other studies which found a similar pattern for latitudes above 40°N( Reference Kroll, Bi and Garber 24 , Reference Brot, Vestergaard and Kolthoff 25 ). In a population with this geographical location, sunlight exposure is a relevant source of vitamin D( Reference Holick 26 ). The result is in agreement with the fact that in the northern hemisphere UVB radiation is not enough for the cutaneous synthesis of vitamin D from November to February at a latitude of 40°N( Reference Webb, Kline and Holick 27 ) and the study was conducted in Porto, a city located in the north of Portugal, at 41°N.
Conversely, no differences were found for vitamin D intake according to season. The lack of seasonal variation might be explained by the fact that the FFQ was performed by asking participants to report food intake over the previous 12 months. Dietary assessment considered every food even if it was eaten occasionally at a given period of the year, regardless of whether the participant was evaluated during that period or not.
Regarding the relationship between vitamin D intake and serum 25(OH)D concentration, we found a positive but weak trend. Besides the relevance of sunlight exposure, the possibility of increasing 25(OH)D levels through diet is the basis of supplementation and fortification policies instituted in some countries such as the USA and Finland. Results similar to ours have been found in other studies( Reference Spiro and Buttriss 7 ). In our study, the major food sources of vitamin D were seafood and starchy. However, the intake of these food sources was low (median seafood: 59·0 g/d, median starchy: 100 g/d), which corresponds to a mean daily vitamin D intake of only 4·47 (2·49) µg. This might explain the weak correlation observed.
Apart from seafood being an expected source of vitamin D, the starchy group was shown to be a major provider. The relevance of this group might be explained by the contribution of breakfast cereals, which are largely consumed in this age group. In Portugal, there is no mandatory food fortification as a strategy to increase vitamin D intake, but some fortified foods such as yoghurts, milk, breakfast cereals, etc. are available in the market. Also, the sweets and pastry group was shown to be a source of vitamin D, because they usually have eggs and milk in their composition, which is very common in Portuguese pastry.
Although it is not possible to establish a causal relationship, we compared serum 25(OH)D concentrations according to tertiles of consumption of the different food groups that contributed to vitamin D intake, to better understand their relationship. As expected, since a weak association was found, 25(OH)D levels were similar across the different food groups.
The quantity of vitamin D from supplementation was not accounted for when estimating vitamin D intake. Information was gathered on supplementation from those who reported to have taken any supplementation. By analysing the supplements, we found that the majority contained large amounts of vitamin D. However, comparing those who had taken supplementation with those who had not, we found that this information did not impact serum 25(OH)D levels and the variable was not further considered. Also, the information regarding vitamin supplementation concerned the previous 12 months and we have no information about the exact time when the supplement was taken, which could have occurred months ago, attenuating the impact on serum 25(OH)D concentrations.
We found a higher correlation between intake and serum 25(OH)D among those with high-intensity physical activity levels. This might be explained by the fact that those who engage in more intense activities may also have a higher parental education, which can promote better dietary quality( Reference Autran, Ramos and Pina 28 ). Also, it might imply an aggregation of behaviours, since those who practise more physical activity also tend to have healthier eating habits( Reference Fraga, Severo and Costa 29 ).
Some limitations should be addressed when interpreting the results. The FFQ was not specifically designed for assessing vitamin D intake. However, the main sources of vitamin D were addressed and the levels of intake were similar to those found in other European studies, with similar latitude and culture( Reference Spiro and Buttriss 7 ). Also, there is a possibility that nutrient databases do not properly convert vitamin D intake levels, which might be particularly relevant for certain foods such as meat. Although meat contains vitamin D in small amounts, it may be an important source because the content is mostly the metabolite 25(OH)D. Still, there is no European consensus on the most appropriate conversion factor to reflect its bioactivity and different potency factors are currently used in food composition tables( Reference Cashman 30 , Reference Uusitalo, Kronberg-Kippila and Aronsson 31 ). We believe that the possible bias of using a predetermined food list had a very low effect because this FFQ was designed for the Portuguese population and some foods or food groups eaten more frequently by adolescents were included in the questionnaire. Likewise, adolescents were encouraged to list foods eaten at least once weekly that were not enumerated in the FFQ, in an open section. Although it was self-administered, adolescents were given oral instructions on filling it in and written instructions were also sent home along with the questionnaire. Additionally, information on supplementation was self-reported and not sufficiently accurate for vitamin D quantification. Finally, participants not included in the analysis had greater vitamin D intake, which increased the prevalence of deficient values in this sample. This may have overestimated the agreement between methods, because a higher variability was shown among the highest vitamin D values, although a systematic bias was not observed. The population-based approach, the measurement of vitamin D intake and overall status, and the possibility of assessing two distinct seasons of evaluation are strengths of the present study.
Conclusion
The present study showed a positive but weak correlation between dietary vitamin D intake, measured by FFQ, and serum 25(OH)D concentration in this population, resulting in a low agreement. Seasonal variation was observed for serum 25(OH)D, with higher values found during the summer season. Our results support the need for interventions that support the increase in vitamin D intake, namely promoting the most important food sources of vitamin D, to reduce the high prevalence of low vitamin D status.
Acknowledgements
Financial support: This study was supported through FEDER from the Operational Programme Factors of Competitiveness – COMPETE and through national funding from the Portuguese Foundation for Science and Technology – FCT (Portuguese Ministry of Education and Science) within the project PTDC/DTP-EPI/6506/2014; and by the Epidemiology Research Unit – Institute of Public Health, University of Porto (grant number UID/DTP/047507/2013). The individual grant to M.C. (grant number PD/BD/105824/2014) by the Portuguese Foundation for Science and Technology – FCT is gratefully acknowledged. The funders had no role in the design, analysis or writing of this article. Conflict of interest: None. Authorship: M.C. drafted the first version of the manuscript, performed the statistical analysis and contributed to the interpretation of the analysis. J.A. provided significant advice and contributed to the discussion of the manuscript. C.L., H.B. and J.T.G. critically reviewed the manuscript. M.S. performed the statistical analysis and contributed to the interpretation of the analysis. E.R. coordinated the manuscript and contributed to the interpretation and discussion of the analysis. All authors critically reviewed drafts of the manuscript and approved the final version of the manuscript. Ethics of human subject participation: The study complies with the Declaration of Helsinki, and policies and procedures were developed to guarantee data confidentiality and protection. The Ethics Committee of Hospital São João approved the study, oral and written information about the study was provided to participants and their parents, and written consent was obtained from both parents or legal guardians and adolescents.


