


1 Introduction
In the classical water-entry problem, a solid object passes through a water–air interface and forms an air cavity, which later retracts, resulting in the formation of a liquid jet. The problem has been extensively studied for more than a century since Worthington (Reference Worthington1908), and the effects of the relevant physical parameters, such as density ratio, wettability and impact velocity, have been characterized (see Truscott, Epps & Belden (Reference Truscott, Epps and Belden2014) for a review). The dynamics of water entry, however, differ when the deformability of the impacting object changes. A recent study on the impact of elastomeric spheres on water demonstrated that the deformation of the object upon impact and its consequent vibration notably change the shape of the air cavity (Hurd et al. Reference Hurd, Belden, Jandron, Fanning, Bower and Truscott2017). In the same context, one can look at the impact of an immiscible droplet (e.g. water droplet on a bath of oil) as an ultimate case of water entry of highly deformable objects, where the capillary forces tend to keep the shape spherical. In such systems, the higher the inertia, the higher the deformation of the droplet, and, eventually, fragmentation can occur (Lhuissier et al. Reference Lhuissier, Sun, Prosperetti and Lohse2013). Note that, in comparison with the classic water-entry experiments, where the density of the impacting object is much larger than the density of the liquid bath (e.g. steel ball impacting water), a liquid–liquid system typically features a smaller impactor, a lower density ratio, and therefore a smaller impact momentum.
In the present study, we investigate the water entry of a viscoplastic (also known as yield stress) object. Such a material, if not sufficiently stressed, behaves like an elastic solid, but once the stress exceeds a critical value (the yield stress), the material deforms like a viscous fluid (typically with a nonlinear viscosity). Yield stress is a common property in many of the materials we deal with on a daily basis, such as toothpaste, cosmetic creams or muds. Besides, several industrial fluids such as waxy oil feature this property (see Balmforth, Frigaard & Ovarlez (Reference Balmforth, Frigaard and Ovarlez2014), Coussot (Reference Coussot2014) and Bonn et al. (Reference Bonn, Denn, Berthier, Divoux and Manneville2017) for reviews). A few studies have previously investigated the impact and spreading of viscoplastic droplets on a solid surface. It is shown that yield stress can prohibit the recoil of the droplet, retard the deformation after the drop has reached the maximum shape, and prevent splashing (German & Bertola Reference German and Bertola2009; Luu & Forterre Reference Luu and Forterre2009; Jalaal & Stoeber Reference Jalaal and Stoeber2014; Blackwell et al. Reference Blackwell, Deetjen, Gaudio and Ewoldt2015; Jalaal, Balmforth & Stoeber Reference Jalaal, Balmforth and Stoeber2015; Jalaal Reference Jalaal2016; Jalaal et al. Reference Jalaal, Seyfert, Stoeber and Balmforth2018).
The present scenario offers a version of a water-entry problem, in a sense that an initially solid material passes through an air–water interface. The system, nevertheless, diverges from classical water-entry experiments in some ways. We expect that the complex rheological properties of the soft impacting object change the dynamics of the entry. First, if the stress due to the impact is larger than the yield stress, the drop might undergo a (local or global) deformation, which in turn can change the dynamics of the cavity. Second, the density of the impacting object is higher for the majority of previous water-entry experiments (also see Truscott, Epps & Techet Reference Truscott, Epps and Techet2012). In comparison to the impact of immiscible droplets onto a water bath, the solid-like properties of the impacting object, i.e. yield stress and elasticity, as well as the shear-rate-dependent viscosity, alter the dissipation mechanism during the impact. Furthermore, we expect a static droplet shape when the exerted stress is below the yield stress everywhere inside the droplet.
Regarding applications, the subject of this work is directly relevant to the production of capsules, beads and non-spherical particles (see e.g. Wang et al. Reference Wang, Lacík, Brissová, Anilkumar, Prokop, Hunkeler, Green, Shahrokhi and Powers1997; Beesabathuni et al. Reference Beesabathuni, Lindberg, Caggioni, Wesner and Shen2015; Lee, Beesabathuni & Shen Reference Lee, Beesabathuni and Shen2015) where droplets polymerize, passing through a liquid–air interface. Apart from its possible direct applications, the current study might give a broader perspective on the general physics of impact and penetration of deformable objects that undergo elasto-plastic deformations (Lush Reference Lush1983; Peseux, Gornet & Donguy Reference Peseux, Gornet and Donguy2005).
The paper is organized as follows: in § 2, we provide information on the properties of the materials used and describe the experimental conditions; in § 3, we first explain the phenomena observed in the tests, followed by the force analysis and quantitative measurements; § 4 concludes the results.
2 Experiments
2.1 Viscoplastic fluids
For our experiments, we used a mixture of Milli-Q water and a commercial hair gel at five different concentrations. The polymeric solution is essentially an aqueous mixture of Carbopol that is pH-neutralized with triethanolamine (see Dinkgreve et al.
Reference Dinkgreve, Paredes, Denn and Bonn2016). To increase the visibility of the droplets during the recordings, a small quantity (0.02 wt %) of ink (Trypan Blue by Sigma) is added to the solution. Finally, the samples are centrifuged at 2000 r.p.m. for 5 min to obtain a homogeneous mixture without bubbles. We performed the rheological measurements using a rotational Anton Paar rheometer (MCR 502) with a cone-and-plate configuration (
 $2^{\circ }$
angle and mean gap of 1 mm). Rough surfaces were used in the measurements to avoid slip effects at low shear rates (Roberts & Barnes Reference Roberts and Barnes2001). First, we performed the oscillatory tests for a range of shear stresses (roughly 0.03 Pa–100 Pa) at the fixed frequency of 1 Hz to identify the storage (
$2^{\circ }$
angle and mean gap of 1 mm). Rough surfaces were used in the measurements to avoid slip effects at low shear rates (Roberts & Barnes Reference Roberts and Barnes2001). First, we performed the oscillatory tests for a range of shear stresses (roughly 0.03 Pa–100 Pa) at the fixed frequency of 1 Hz to identify the storage (
 ${\mathcal{G}}^{\prime }$
) and loss (
${\mathcal{G}}^{\prime }$
) and loss (
 ${\mathcal{G}}^{\prime \prime }$
) moduli. The values of
${\mathcal{G}}^{\prime \prime }$
) moduli. The values of
 ${\mathcal{G}}^{\prime }$
and
${\mathcal{G}}^{\prime }$
and
 ${\mathcal{G}}^{\prime \prime }$
were independent of the oscillation frequency within the range of 0.1–10 Hz. Second, we obtained the steady-state flow curves of the materials in shear-rate-controlled (
${\mathcal{G}}^{\prime \prime }$
were independent of the oscillation frequency within the range of 0.1–10 Hz. Second, we obtained the steady-state flow curves of the materials in shear-rate-controlled (
 $\dot{\unicode[STIX]{x1D6FE}}$
-controlled) experiments, where the samples were initially pre-sheared for 2 min in an upward ramp of
$\dot{\unicode[STIX]{x1D6FE}}$
-controlled) experiments, where the samples were initially pre-sheared for 2 min in an upward ramp of
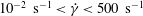 $10^{-2}~\text{s}^{-1}<\dot{\unicode[STIX]{x1D6FE}}<500~\text{s}^{-1}$
. Thereafter, the stress was measured in a downward ramp in the same range. The flow curves were independent of waiting times longer than 1 s. No hysteresis was observed in the up and down shear-rate ramps, suggesting negligible thixotropy. Additionally, we repeated the rheology measurement over the course of several days of the experiments to confirm that the samples retain their properties throughout the experiments.
$10^{-2}~\text{s}^{-1}<\dot{\unicode[STIX]{x1D6FE}}<500~\text{s}^{-1}$
. Thereafter, the stress was measured in a downward ramp in the same range. The flow curves were independent of waiting times longer than 1 s. No hysteresis was observed in the up and down shear-rate ramps, suggesting negligible thixotropy. Additionally, we repeated the rheology measurement over the course of several days of the experiments to confirm that the samples retain their properties throughout the experiments.

Figure 1. (a) The results of the oscillatory shear tests: symbols connected with lines correspond to storage (
 ${\mathcal{G}}^{\prime }$
), and the dashed lines correspond to the loss (
${\mathcal{G}}^{\prime }$
), and the dashed lines correspond to the loss (
 ${\mathcal{G}}^{\prime \prime }$
) moduli, respectively. The symbols denote the measurements for the samples listed in the legend. The polymer concentration decreases from sample 1 to 5. The vertical lines refer to the values of the yield stress,
${\mathcal{G}}^{\prime \prime }$
) moduli, respectively. The symbols denote the measurements for the samples listed in the legend. The polymer concentration decreases from sample 1 to 5. The vertical lines refer to the values of the yield stress,
 $\unicode[STIX]{x1D70F}_{0}$
, from Herschel–Bulkley (HB) fits. The magnitudes of
$\unicode[STIX]{x1D70F}_{0}$
, from Herschel–Bulkley (HB) fits. The magnitudes of
 ${\mathcal{G}}_{0}^{\prime }$
and
${\mathcal{G}}_{0}^{\prime }$
and
 ${\mathcal{G}}_{0}^{\prime \prime }$
are shown on the
${\mathcal{G}}_{0}^{\prime \prime }$
are shown on the
 $y$
-axis. (b) Flow curves from the
$y$
-axis. (b) Flow curves from the
 $\dot{\unicode[STIX]{x1D6FE}}$
, shear-rate-controlled, tests: the symbols are the same as in panel (a). The lines correspond to the HB fits (2.1). The inset shows the values of the apparent viscosity at low stresses.
$\dot{\unicode[STIX]{x1D6FE}}$
, shear-rate-controlled, tests: the symbols are the same as in panel (a). The lines correspond to the HB fits (2.1). The inset shows the values of the apparent viscosity at low stresses.
Figure 1 summarizes the rheology of the materials used in our experiments. The results of the oscillatory tests reveal an elastic-dominant behaviour at low stresses, where
 ${\mathcal{G}}^{\prime }\approx 10{\mathcal{G}}^{\prime \prime }$
. Above a certain stress, the values of the storage modulus drop by orders of magnitude. Meanwhile, the loss modulus initially increases, crosses the curves of the storage modulus and then sharply decreases. Such behaviour shows a transition at a critical stress, from an elastic solid-like material (with weak viscous properties) to an elasto-viscoplastic material (with weak elastic properties). The flow curves (figure 1
b) display the characteristics of the materials above the critical stress. The samples feature a shear-thinning behaviour, i.e. the viscosity reduces with increasing shear rate. Moreover, the measured stress values approach the yield stress when
${\mathcal{G}}^{\prime }\approx 10{\mathcal{G}}^{\prime \prime }$
. Above a certain stress, the values of the storage modulus drop by orders of magnitude. Meanwhile, the loss modulus initially increases, crosses the curves of the storage modulus and then sharply decreases. Such behaviour shows a transition at a critical stress, from an elastic solid-like material (with weak viscous properties) to an elasto-viscoplastic material (with weak elastic properties). The flow curves (figure 1
b) display the characteristics of the materials above the critical stress. The samples feature a shear-thinning behaviour, i.e. the viscosity reduces with increasing shear rate. Moreover, the measured stress values approach the yield stress when
 $\dot{\unicode[STIX]{x1D6FE}}\rightarrow 0$
. Consequently, the apparent viscosity diverges at this limit (see the inset in figure 1
b). We use a simple elasto-viscoplastic constitutive model to characterize our samples:
$\dot{\unicode[STIX]{x1D6FE}}\rightarrow 0$
. Consequently, the apparent viscosity diverges at this limit (see the inset in figure 1
b). We use a simple elasto-viscoplastic constitutive model to characterize our samples:
 $$\begin{eqnarray}\unicode[STIX]{x1D70F}={\mathcal{G}}_{0}^{\prime }\,\unicode[STIX]{x1D6FE}\quad \text{if}\quad \unicode[STIX]{x1D70F}<\unicode[STIX]{x1D70F}_{0}\quad \text{and}\quad \unicode[STIX]{x1D70F}=\unicode[STIX]{x1D70F}_{0}+K\,\dot{\unicode[STIX]{x1D6FE}}^{n}\quad \text{if}\quad \unicode[STIX]{x1D70F}\geqslant \unicode[STIX]{x1D70F}_{0},\end{eqnarray}$$
where
 $\unicode[STIX]{x1D6FE}$
is the strain,
$\unicode[STIX]{x1D6FE}$
is the strain,
 ${\mathcal{G}}_{0}^{\prime }={\mathcal{G}}^{\prime }(\unicode[STIX]{x1D70F}\rightarrow 0)$
, and
${\mathcal{G}}_{0}^{\prime }={\mathcal{G}}^{\prime }(\unicode[STIX]{x1D70F}\rightarrow 0)$
, and
 $K$
and
$K$
and
 $n$
are the consistency and flow indices, respectively. The model assumes the material to be a linear elastic solid, as long as the shear stress is below the yield stress. Otherwise, if the stress is above the yield stress, the material flows like a Herschel–Bulkley (HB) fluid (Herschel & Bulkley Reference Herschel and Bulkley1926; also see Saramito Reference Saramito2009). In (2.1), if
$n$
are the consistency and flow indices, respectively. The model assumes the material to be a linear elastic solid, as long as the shear stress is below the yield stress. Otherwise, if the stress is above the yield stress, the material flows like a Herschel–Bulkley (HB) fluid (Herschel & Bulkley Reference Herschel and Bulkley1926; also see Saramito Reference Saramito2009). In (2.1), if
 $n<1$
, the fluid is shear thinning; if
$n<1$
, the fluid is shear thinning; if
 $n>1$
, the fluid is shear thickening. For
$n>1$
, the fluid is shear thickening. For
 ${\mathcal{G}}_{0}^{\prime }=0$
and
${\mathcal{G}}_{0}^{\prime }=0$
and
 $n=1$
, the model above reduces to a Bingham model (Bingham Reference Bingham1917), where, if
$n=1$
, the model above reduces to a Bingham model (Bingham Reference Bingham1917), where, if
 $\unicode[STIX]{x1D70F}\geqslant \unicode[STIX]{x1D70F}_{0}$
, the fluid flows with a constant plastic viscosity (
$\unicode[STIX]{x1D70F}\geqslant \unicode[STIX]{x1D70F}_{0}$
, the fluid flows with a constant plastic viscosity (
 $\unicode[STIX]{x1D707}_{p}=K$
). Note that equation (2.1) ignores the viscous contribution below the yield stress and does not include any elasticity above it (i.e. viscoelasticity).
$\unicode[STIX]{x1D707}_{p}=K$
). Note that equation (2.1) ignores the viscous contribution below the yield stress and does not include any elasticity above it (i.e. viscoelasticity).
Table 1. Values of yield stress (
 $\unicode[STIX]{x1D70F}_{0}$
), consistency index (
$\unicode[STIX]{x1D70F}_{0}$
), consistency index (
 $K$
), flow index (
$K$
), flow index (
 $n$
) and storage modulus (
$n$
) and storage modulus (
 ${\mathcal{G}}_{0}^{\prime }$
), from (2.1).
${\mathcal{G}}_{0}^{\prime }$
), from (2.1).

The coefficients
 $\unicode[STIX]{x1D70F}_{0}$
,
$\unicode[STIX]{x1D70F}_{0}$
,
 $K$
,
$K$
,
 $n$
and
$n$
and
 ${\mathcal{G}}_{0}^{\prime }$
are listed in table 1 for the fluids used in the experiments. The higher the concentration of the polymer, the higher the yield stress and the elastic storage modulus, i.e. the solid-like behaviour of the material is more pronounced and the required stress to result in yielding is higher. The value variation of the flow indices is nevertheless negligible. One can also compare the magnitude of the yield stress listed in table 1 with the values of stress at which the curves of
${\mathcal{G}}_{0}^{\prime }$
are listed in table 1 for the fluids used in the experiments. The higher the concentration of the polymer, the higher the yield stress and the elastic storage modulus, i.e. the solid-like behaviour of the material is more pronounced and the required stress to result in yielding is higher. The value variation of the flow indices is nevertheless negligible. One can also compare the magnitude of the yield stress listed in table 1 with the values of stress at which the curves of
 ${\mathcal{G}}^{\prime }$
and
${\mathcal{G}}^{\prime }$
and
 ${\mathcal{G}}^{\prime \prime }$
cross over (yet another technique to measure the yield stress). The vertical lines in the plot indicate the values of
${\mathcal{G}}^{\prime \prime }$
cross over (yet another technique to measure the yield stress). The vertical lines in the plot indicate the values of
 $\unicode[STIX]{x1D70F}_{0}$
from the HB fits. These values are slightly smaller than the ones where the curves of
$\unicode[STIX]{x1D70F}_{0}$
from the HB fits. These values are slightly smaller than the ones where the curves of
 ${\mathcal{G}}^{\prime }$
and
${\mathcal{G}}^{\prime }$
and
 ${\mathcal{G}}^{\prime \prime }$
cross. This is consistent with recent measurements of a similar type of viscoplastic fluid (Dinkgreve et al.
Reference Dinkgreve, Paredes, Denn and Bonn2016).
${\mathcal{G}}^{\prime \prime }$
cross. This is consistent with recent measurements of a similar type of viscoplastic fluid (Dinkgreve et al.
Reference Dinkgreve, Paredes, Denn and Bonn2016).
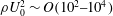
Recent work measuring the surface tension of Carbopol solutions found that its deviation from that of water was small (less than 10 %) and that it did not vary strongly with polymer concentration (Manglik, Wasekar & Zhang Reference Manglik, Wasekar and Zhang2001; Jørgensen et al.
Reference Jørgensen, Le Merrer, Delanoë-Ayari and Barentin2015). Here, we do not measure the surface tension ourselves and use the fiducial value of
 $\unicode[STIX]{x1D70E}=0.072~\text{N}~\text{m}^{-1}$
for both water and the gel. We measured the density of the solutions using an Anton Paar DMA-35 density meter. The density of the used water is
$\unicode[STIX]{x1D70E}=0.072~\text{N}~\text{m}^{-1}$
for both water and the gel. We measured the density of the solutions using an Anton Paar DMA-35 density meter. The density of the used water is
 $998.3~\text{kg}~\text{m}^{-3}$
, and the density of the viscoplastic gels varied between 1000.0 and
$998.3~\text{kg}~\text{m}^{-3}$
, and the density of the viscoplastic gels varied between 1000.0 and
 $1002.0~\text{kg}~\text{m}^{-3}$
. Note that, although the gels are in essence miscible in water, the diffusion time scale is much larger than the time scale of our experiments, i.e.
$1002.0~\text{kg}~\text{m}^{-3}$
. Note that, although the gels are in essence miscible in water, the diffusion time scale is much larger than the time scale of our experiments, i.e.
 $Pe=U_{0}D_{s}/{\mathcal{D}}\ll 1$
, where
$Pe=U_{0}D_{s}/{\mathcal{D}}\ll 1$
, where
 $Pe$
is the Péclet number,
$Pe$
is the Péclet number,
 ${\mathcal{D}}$
is the mass diffusion coefficient,
${\mathcal{D}}$
is the mass diffusion coefficient,
 $U_{0}$
is the impact velocity, and
$U_{0}$
is the impact velocity, and
 $D_{s}$
is a characteristic length scale of the order of magnitude of the diameter of the droplet. Hence, the droplets are effectively immiscible in the time frame considered here.
$D_{s}$
is a characteristic length scale of the order of magnitude of the diameter of the droplet. Hence, the droplets are effectively immiscible in the time frame considered here.
2.2 Experimental set-up and initial shapes

Figure 2. (a) Experimental set-up for the investigation of viscoplastic water entry. The shown dimensions are not to scale. (b) Shape of the droplets before impact for different gels (symbols are the same as in figure 1). (c) Variation of the aspect ratio versus
 ${\mathcal{J}}=\unicode[STIX]{x1D70F}_{0}D_{s}/\unicode[STIX]{x1D70E}$
. The solid line is an empirical fit of
${\mathcal{J}}=\unicode[STIX]{x1D70F}_{0}D_{s}/\unicode[STIX]{x1D70E}$
. The solid line is an empirical fit of
 ${\mathcal{A}}_{0}=\text{e}^{-1.25{\mathcal{J}}}$
.
${\mathcal{A}}_{0}=\text{e}^{-1.25{\mathcal{J}}}$
.
Figure 2(a) shows a sketch of the set-up used for the impact test experiment. The drop of the viscoplastic fluid forms quasi-statically at the tip of a nozzle connected to a syringe pump. The inner and outer diameters of the nozzle are 1.15 mm and 1.65 mm, respectively. Droplets detach under their weight with a reproducible shape. The impact velocity is adjusted by varying the height of the nozzle and was measured just before the impact, using an image processing code. The bath, filled with Milli-Q water, is a cylindrical container with a diameter and height of 6 cm and 10 cm, respectively. The size of the bath is big enough such that it does not influence the impact process. The diffused light of the SLG-50S LED Fiber Optic Illuminator illuminates the water surface and a Photron FASTCAM SA-1.1 high-speed camera, connected to a Zeiss Milvus 100 mm
 $f/2.0$
Macro-Planar T
$f/2.0$
Macro-Planar T
 $^{\ast }$
lens, records the process. The resolution of the images is set to
$^{\ast }$
lens, records the process. The resolution of the images is set to
 $1024\times 1024$
pixels at a frame rate of 5000 frames per second and a shutter speed of
$1024\times 1024$
pixels at a frame rate of 5000 frames per second and a shutter speed of
 $8000~\text{s}^{-1}$
to eliminate motion blur at high impact velocities. This results in a spatial resolution of
$8000~\text{s}^{-1}$
to eliminate motion blur at high impact velocities. This results in a spatial resolution of
 ${\sim}64~\unicode[STIX]{x03BC}\text{m}$
in the air and
${\sim}64~\unicode[STIX]{x03BC}\text{m}$
in the air and
 ${\sim}54~\unicode[STIX]{x03BC}\text{m}$
in water. We correct the measurements for optical diffraction inside the container.
${\sim}54~\unicode[STIX]{x03BC}\text{m}$
in water. We correct the measurements for optical diffraction inside the container.
It was shown previously that the shape of a viscoplastic droplet detaching from a nozzle is mainly determined by the size of the nozzle, the yield stress and the surface tension (German & Bertola Reference German and Bertola2010). If the capillary pressure is much larger than the yield stress, the droplet will reach a spherical shape after the pinch-off. However, if the yield stress dominates, the droplet will become more prolate. Figure 2(b) illustrates the shape of the droplets for different gels. As expected, the larger the yield stress, the smaller the aspect ratio of the droplet (
 ${\mathcal{A}}_{0}=D_{0}/H_{0}$
). For the fixed diameter of the nozzle, we characterize this geometrical parameter with a non-dimensional number
${\mathcal{A}}_{0}=D_{0}/H_{0}$
). For the fixed diameter of the nozzle, we characterize this geometrical parameter with a non-dimensional number
 ${\mathcal{J}}=\unicode[STIX]{x1D70F}_{0}D_{s}/\unicode[STIX]{x1D70E}$
, where
${\mathcal{J}}=\unicode[STIX]{x1D70F}_{0}D_{s}/\unicode[STIX]{x1D70E}$
, where
 $D_{s}=(6{\mathcal{V}}/\unicode[STIX]{x03C0})^{1/3}$
is the diameter of a spherical droplet of the same volume,
$D_{s}=(6{\mathcal{V}}/\unicode[STIX]{x03C0})^{1/3}$
is the diameter of a spherical droplet of the same volume,
 ${\mathcal{V}}$
. The final results follow an empirical fit of
${\mathcal{V}}$
. The final results follow an empirical fit of
 ${\mathcal{A}}_{0}=\text{e}^{-1.25{\mathcal{J}}}$
. Note that the volume of the droplets for the range of the yield stresses we used do not vary, resulting in a constant value of
${\mathcal{A}}_{0}=\text{e}^{-1.25{\mathcal{J}}}$
. Note that the volume of the droplets for the range of the yield stresses we used do not vary, resulting in a constant value of
 $D_{s}=3.2\pm 0.1~\text{mm}$
.
$D_{s}=3.2\pm 0.1~\text{mm}$
.
3 Results
3.1 Phenomenology

Figure 3. Water entry of a viscoplastic droplet (sample 3; see table 1 for the properties) at different impact velocities: (a)
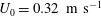 $U_{0}=0.32~\text{m}~\text{s}^{-1}$
(
$U_{0}=0.32~\text{m}~\text{s}^{-1}$
(
 $\unicode[STIX]{x1D70F}=D_{s}/U_{0}=10\times 10^{-3}$
); (b)
$\unicode[STIX]{x1D70F}=D_{s}/U_{0}=10\times 10^{-3}$
); (b)
 $U_{0}=0.72~\text{m}~\text{s}^{-1}$
(
$U_{0}=0.72~\text{m}~\text{s}^{-1}$
(
 $\unicode[STIX]{x1D70F}=4.44\times 10^{-3}$
); (c)
$\unicode[STIX]{x1D70F}=4.44\times 10^{-3}$
); (c)
 $U_{0}=1.12~\text{m}~\text{s}^{-1}$
(
$U_{0}=1.12~\text{m}~\text{s}^{-1}$
(
 $\unicode[STIX]{x1D70F}=2.86\times 10^{-3}$
); (d)
$\unicode[STIX]{x1D70F}=2.86\times 10^{-3}$
); (d)
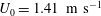 $U_{0}=1.41~\text{m}~\text{s}^{-1}$
(
$U_{0}=1.41~\text{m}~\text{s}^{-1}$
(
 $\unicode[STIX]{x1D70F}=2.27\times 10^{-3}$
); and (e)
$\unicode[STIX]{x1D70F}=2.27\times 10^{-3}$
); and (e)
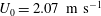 $U_{0}=2.07~\text{m}~\text{s}^{-1}$
(
$U_{0}=2.07~\text{m}~\text{s}^{-1}$
(
 $\unicode[STIX]{x1D70F}=1.55\times 10^{-3}$
). See supplementary movies available at https://doi.org/10.1017/jfm.2019.32.
$\unicode[STIX]{x1D70F}=1.55\times 10^{-3}$
). See supplementary movies available at https://doi.org/10.1017/jfm.2019.32.
This section outlines the qualitative mechanics of water entry of viscoplastic fluids. Figure 3 shows the entry of a droplet of sample 3 for a range of impact velocities
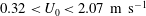 $0.32<U_{0}<2.07~\text{m}~\text{s}^{-1}$
. At the lowest impact velocity shown (figure 3
a, with
$0.32<U_{0}<2.07~\text{m}~\text{s}^{-1}$
. At the lowest impact velocity shown (figure 3
a, with
 $U_{0}=0.32~\text{m}~\text{s}^{-1}$
), the droplet undergoes a slight deformation, predominantly at the bottom, where it first hits the surface. The droplet rapidly reaches an equilibrium shape once it is fully submerged (
$U_{0}=0.32~\text{m}~\text{s}^{-1}$
), the droplet undergoes a slight deformation, predominantly at the bottom, where it first hits the surface. The droplet rapidly reaches an equilibrium shape once it is fully submerged (
 $t\approx 17~\text{ms}$
, which corresponds to a non-dimensional time of
$t\approx 17~\text{ms}$
, which corresponds to a non-dimensional time of
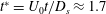 $t^{\ast }=U_{0}t/D_{s}\approx 1.7$
). In this regime, the comparison with the initial shape of the droplet reveals that the final shape features a flattened bottom and an unchanged top. This suggests that only the bottom of the droplet shears and experiences the plastic deformation, while the top of the droplet falls freely. Here, we call such a morphology a pear shape. The elastic deformation in this regime is minimal and the size of the water cavity is small. Furthermore, after reaching an equilibrium shape, the droplet sinks in the bath because of the density difference. Hereafter, the dynamics is simply a solid-body falling motion. The falling motion of the droplets occasionally features fluttering or a rotating motion (not shown here), previously observed for falling non-spherical particles (e.g. Auguste, Magnaudet & Fabre Reference Auguste, Magnaudet and Fabre2013).
$t^{\ast }=U_{0}t/D_{s}\approx 1.7$
). In this regime, the comparison with the initial shape of the droplet reveals that the final shape features a flattened bottom and an unchanged top. This suggests that only the bottom of the droplet shears and experiences the plastic deformation, while the top of the droplet falls freely. Here, we call such a morphology a pear shape. The elastic deformation in this regime is minimal and the size of the water cavity is small. Furthermore, after reaching an equilibrium shape, the droplet sinks in the bath because of the density difference. Hereafter, the dynamics is simply a solid-body falling motion. The falling motion of the droplets occasionally features fluttering or a rotating motion (not shown here), previously observed for falling non-spherical particles (e.g. Auguste, Magnaudet & Fabre Reference Auguste, Magnaudet and Fabre2013).
Figure 3(b) depicts the impact process at
 $U_{0}=0.72~\text{m}~\text{s}^{-1}$
. Similar to figure 3(a), the majority of the deformation occurs at the early moments after the droplet touches the water surface (
$U_{0}=0.72~\text{m}~\text{s}^{-1}$
. Similar to figure 3(a), the majority of the deformation occurs at the early moments after the droplet touches the water surface (
 $0<t<16~\text{ms}$
) and it affects only the bottom of the droplet. However, due to a higher impinging velocity, the stress on the droplet surface is higher and, consequently, the bottom of the droplet suffers more from plastic deformation. The top of the droplet does not deform, meaning it falls freely. We still call such a final morphology a pear-like shape, as long as the brims of the final shape are pointing downwards. Figure 3(c) shows the process of water entry at
$0<t<16~\text{ms}$
) and it affects only the bottom of the droplet. However, due to a higher impinging velocity, the stress on the droplet surface is higher and, consequently, the bottom of the droplet suffers more from plastic deformation. The top of the droplet does not deform, meaning it falls freely. We still call such a final morphology a pear-like shape, as long as the brims of the final shape are pointing downwards. Figure 3(c) shows the process of water entry at
 $U_{0}=1.12~\text{m}~\text{s}^{-1}$
, where the further increase of the impact velocity results in more substantial deformation of the droplet. Again, the majority of the deformation occurs at the early stage of entry, and afterwards the droplet rapidly approaches a static shape. In comparison to figure 3(b), the brims are now larger, thinner and highly plastically deformed. Additionally, the depth of the air cavity at such speed is comparable to the size of the droplet. The cavity forms at the early stages of the droplet penetration and retracts while the droplet is still deforming. The retraction, however, does not lead to the formation of a Worthington jet. At this speed, one can also observe a late elastic deformation of the brims. After the droplet detaches from the cavity, it decelerates, the shear stress rapidly decreases, and therefore the thin brim bends back elastically (this can be seen by comparing the last two images in figure 3
c). The elastic deformation leads to a larger equilibrium time,
$U_{0}=1.12~\text{m}~\text{s}^{-1}$
, where the further increase of the impact velocity results in more substantial deformation of the droplet. Again, the majority of the deformation occurs at the early stage of entry, and afterwards the droplet rapidly approaches a static shape. In comparison to figure 3(b), the brims are now larger, thinner and highly plastically deformed. Additionally, the depth of the air cavity at such speed is comparable to the size of the droplet. The cavity forms at the early stages of the droplet penetration and retracts while the droplet is still deforming. The retraction, however, does not lead to the formation of a Worthington jet. At this speed, one can also observe a late elastic deformation of the brims. After the droplet detaches from the cavity, it decelerates, the shear stress rapidly decreases, and therefore the thin brim bends back elastically (this can be seen by comparing the last two images in figure 3
c). The elastic deformation leads to a larger equilibrium time,
 $t\approx 35~\text{ms}$
in this particular case. See appendix B for more quantitative details on the dynamics of the droplets and the cavities. We refer to this morphology as the sombrero shape, when the brim is facing upwards, and the tip of the peak in the middle of the droplet is higher than the tip of the brim. In some cases, the thin brim of the sombrero droplets is unstable and breaks due to the excessive shear stresses. The softer the gel, or the stronger the impact, the thinner the brim is, and consequently it is more likely to break.
$t\approx 35~\text{ms}$
in this particular case. See appendix B for more quantitative details on the dynamics of the droplets and the cavities. We refer to this morphology as the sombrero shape, when the brim is facing upwards, and the tip of the peak in the middle of the droplet is higher than the tip of the brim. In some cases, the thin brim of the sombrero droplets is unstable and breaks due to the excessive shear stresses. The softer the gel, or the stronger the impact, the thinner the brim is, and consequently it is more likely to break.
Increasing the impact velocity at some point will lead to the formation of a bubble and a Worthington jet. Figure 3(d) shows the images of an impact at
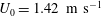 $U_{0}=1.42~\text{m}~\text{s}^{-1}$
. At this velocity, the size of the cavity is larger, and it has a strong effect on the dynamics of the droplet. Initially, the droplet grows radially while the cavity expands. While retracting, the cavity and consequent flow inside the bath pull the droplet towards its centre. The cavity finally breaks into two parts. A large portion of the cavity that initially has a very sharp tip collapses and forms a Worthington jet that later disintegrates. The second part is an air bubble that initially sticks to the viscoplastic droplet (similar to the attached cavities in solid-body water entry). The bubble, however, detaches later on and stays above the droplet in the low-pressure wake zone. It finally rises to the surface of the bath (not shown here). The final shape of the droplet now looks like a bowl with a sharp edge. We refer to this morphology as a bowl-shaped droplet.
$U_{0}=1.42~\text{m}~\text{s}^{-1}$
. At this velocity, the size of the cavity is larger, and it has a strong effect on the dynamics of the droplet. Initially, the droplet grows radially while the cavity expands. While retracting, the cavity and consequent flow inside the bath pull the droplet towards its centre. The cavity finally breaks into two parts. A large portion of the cavity that initially has a very sharp tip collapses and forms a Worthington jet that later disintegrates. The second part is an air bubble that initially sticks to the viscoplastic droplet (similar to the attached cavities in solid-body water entry). The bubble, however, detaches later on and stays above the droplet in the low-pressure wake zone. It finally rises to the surface of the bath (not shown here). The final shape of the droplet now looks like a bowl with a sharp edge. We refer to this morphology as a bowl-shaped droplet.
Further increase of the impacting momentum results in a surprising regime of bubble encapsulation (figure 3
e). Similar to the previous regime, the droplet expands with the cavity. The breakup during the retraction, however, is different, where the location of the pinch-off is inside the viscoplastic droplet, and therefore bubble encapsulation occurs. Another observation is that, although inertia increases, the velocity of the jet formed above the surface significantly reduces and it only breaks into one large droplet. Further increase of the impacting velocity results in bubble encapsulation while the Worthington jet does not break up at all. The final shape of the droplet in this regime is close to a sphere and features a bubble inside: a capsule. Capsules sink slowly due to the buoyancy forces. Indeed, balancing the buoyancy and gravitational forces results in a critical bubble diameter of
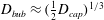 $D_{bub}\approx ({\textstyle \frac{1}{2}}D_{cap})^{1/3}$
, where
$D_{bub}\approx ({\textstyle \frac{1}{2}}D_{cap})^{1/3}$
, where
 $D_{cap}$
is the capsule diameter, i.e. a capsule with a bubble larger than
$D_{cap}$
is the capsule diameter, i.e. a capsule with a bubble larger than
 $D_{bub}$
will rise. In our experiments, the size of the bubble is always slightly smaller than this value and therefore the capsules sink slowly.
$D_{bub}$
will rise. In our experiments, the size of the bubble is always slightly smaller than this value and therefore the capsules sink slowly.
3.2 Forces and non-dimensional numbers
Section 3.1 highlighted two distinct regimes. At low impact velocities, the influence of the cavity is minimal. By increasing the inertial effects, the size and the influence of the cavity become more pronounced, and bubble entrainment occurs. We inspect these two regimes separately, and compare our results to previous studies.
We look at the forces acting in the regime of low inertia (pears and sombreros) in four temporal stages, as shown in figure 4. Before the impact (
 $t<0$
), the droplet is falling freely under gravity (stage I). Comparing the viscous drag forces in air (
$t<0$
), the droplet is falling freely under gravity (stage I). Comparing the viscous drag forces in air (
 ${\sim}\unicode[STIX]{x1D70C}_{air}U_{0}^{2}C_{D}D_{s}^{2}$
) and the yield stress forces (
${\sim}\unicode[STIX]{x1D70C}_{air}U_{0}^{2}C_{D}D_{s}^{2}$
) and the yield stress forces (
 ${\sim}\unicode[STIX]{x1D70F}_{0}D_{s}^{2}$
) results in a non-dimensional number of the form
${\sim}\unicode[STIX]{x1D70F}_{0}D_{s}^{2}$
) results in a non-dimensional number of the form
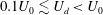
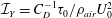 ${\mathcal{I}}_{Y}=C_{D}^{-1}\unicode[STIX]{x1D70F}_{0}/\unicode[STIX]{x1D70C}_{air}U_{0}^{2}$
. Prior to the impact, a typical value for the Reynolds number is
${\mathcal{I}}_{Y}=C_{D}^{-1}\unicode[STIX]{x1D70F}_{0}/\unicode[STIX]{x1D70C}_{air}U_{0}^{2}$
. Prior to the impact, a typical value for the Reynolds number is
 $Re=\unicode[STIX]{x1D70C}_{air}U_{0}D_{s}/\unicode[STIX]{x1D707}_{air}\sim O(100)$
, which results in a drag coefficient of
$Re=\unicode[STIX]{x1D70C}_{air}U_{0}D_{s}/\unicode[STIX]{x1D707}_{air}\sim O(100)$
, which results in a drag coefficient of
 $C_{D}\sim O(1)$
. Therefore, we estimate
$C_{D}\sim O(1)$
. Therefore, we estimate
 ${\mathcal{I}}_{Y}\sim O(10)$
, meaning that the shear stress forces are not strong enough to induce plastic deformation. For the same period, a comparison between the yield stress and the surface tension forces results in the number
${\mathcal{I}}_{Y}\sim O(10)$
, meaning that the shear stress forces are not strong enough to induce plastic deformation. For the same period, a comparison between the yield stress and the surface tension forces results in the number
 ${\mathcal{J}}=\unicode[STIX]{x1D70F}_{0}D_{s}/\unicode[STIX]{x1D70E}$
. As previously discussed in § 2.2,
${\mathcal{J}}=\unicode[STIX]{x1D70F}_{0}D_{s}/\unicode[STIX]{x1D70E}$
. As previously discussed in § 2.2,
 ${\mathcal{J}}\sim O(0.1{-}1)$
, meaning that the capillary action can be strong enough to deform the droplets. In our experiments, we have observed that the droplets slightly deform just after the pinch-off: the sharp tips (high-curvature regions) locally smooth and the droplet slightly retracts. Nonetheless, after a short time (which is much smaller than the falling time in all cases), the droplet reaches an equilibrium shape before impacting on the free surface (shown in figure 2
b).
${\mathcal{J}}\sim O(0.1{-}1)$
, meaning that the capillary action can be strong enough to deform the droplets. In our experiments, we have observed that the droplets slightly deform just after the pinch-off: the sharp tips (high-curvature regions) locally smooth and the droplet slightly retracts. Nonetheless, after a short time (which is much smaller than the falling time in all cases), the droplet reaches an equilibrium shape before impacting on the free surface (shown in figure 2
b).

Figure 4. Four successive stages of the water entry from left to right. Here
 $\unicode[STIX]{x1D70F}=D/U_{0}$
is the inertial time scale. This example belongs to the same condition shown in figure 3(b).
$\unicode[STIX]{x1D70F}=D/U_{0}$
is the inertial time scale. This example belongs to the same condition shown in figure 3(b).
The early stages of the impact (stage II), i.e. the moment after the contact between the viscoplastic droplet and the water bath, can be associated with shock-type characteristics (Korobkin & Pukhnachov Reference Korobkin and Pukhnachov1988). More complexities might also develop due to the effect of the air layer, as well as the elasto-plastic deformation of the droplet. We do not address this regime in detail; nevertheless, in appendix A, we provide an analysis that manifests a pressure wave with a magnitude much larger than the yield stress at an effective time scale of
 ${\sim}O(10^{-6}~\text{s})$
. In our experiments, we do not see any particular deformation of the droplet as a consequence of such a pressure impulse.
${\sim}O(10^{-6}~\text{s})$
. In our experiments, we do not see any particular deformation of the droplet as a consequence of such a pressure impulse.
Although the droplet decelerates in the early moments after it hits the surface, its velocity (
 $U_{d}$
) is still comparable with the impact velocity:
$U_{d}$
) is still comparable with the impact velocity:
 $0.1U_{0}\lesssim U_{d}<U_{0}$
(also known for other impact and penetration problems (Yarin, Rubin & Roisman Reference Yarin, Rubin and Roisman1995; Berberović et al.
Reference Berberović, van Hinsberg, Jakirlić, Roisman and Tropea2009)). The penetration velocity at this stage results in a velocity gradient at the droplet–bath interface and hence an azimuthal vorticity (stage III in figure 4). In a classic Newtonian system, such vorticity typically leads to the emergence of vortex rings (see Thomson et al.
Reference Thomson and Newall1886; Peck & Sigurdson Reference Peck and Sigurdson1994; Dooley et al.
Reference Dooley, Warncke, Gharib and Tryggvason1997; San Lee et al.
Reference San Lee, Park, Lee, Weon, Fezzaa and Je2015; Thoraval, Li & Thoroddsen Reference Thoraval, Li and Thoroddsen2016). For a viscoplastic droplet, the rollup deformation due to the vortex rings is not only damped due to the total viscosity, but also ceases when the yield stress dominates (also see appendix C). The moment the internal stress generated by the vortex motion is below the yield stress, the droplet approaches a final equilibrium shape. One can now follow the same calculation as above in air to obtain
$0.1U_{0}\lesssim U_{d}<U_{0}$
(also known for other impact and penetration problems (Yarin, Rubin & Roisman Reference Yarin, Rubin and Roisman1995; Berberović et al.
Reference Berberović, van Hinsberg, Jakirlić, Roisman and Tropea2009)). The penetration velocity at this stage results in a velocity gradient at the droplet–bath interface and hence an azimuthal vorticity (stage III in figure 4). In a classic Newtonian system, such vorticity typically leads to the emergence of vortex rings (see Thomson et al.
Reference Thomson and Newall1886; Peck & Sigurdson Reference Peck and Sigurdson1994; Dooley et al.
Reference Dooley, Warncke, Gharib and Tryggvason1997; San Lee et al.
Reference San Lee, Park, Lee, Weon, Fezzaa and Je2015; Thoraval, Li & Thoroddsen Reference Thoraval, Li and Thoroddsen2016). For a viscoplastic droplet, the rollup deformation due to the vortex rings is not only damped due to the total viscosity, but also ceases when the yield stress dominates (also see appendix C). The moment the internal stress generated by the vortex motion is below the yield stress, the droplet approaches a final equilibrium shape. One can now follow the same calculation as above in air to obtain
 $Re=\unicode[STIX]{x1D70C}_{water}U_{d}D_{s}/\unicode[STIX]{x1D707}_{water}\sim O(100)$
, and
$Re=\unicode[STIX]{x1D70C}_{water}U_{d}D_{s}/\unicode[STIX]{x1D707}_{water}\sim O(100)$
, and
 $C_{D}\sim O(1)$
. Accordingly,
$C_{D}\sim O(1)$
. Accordingly,
 ${\mathcal{I}}_{Y}\sim O(1)$
, i.e. at the initial moments of the submergence, the shear stress on the surface of the droplet is comparable to the yield stress and therefore enough to begin a plastic (and also elastic) deformation.
${\mathcal{I}}_{Y}\sim O(1)$
, i.e. at the initial moments of the submergence, the shear stress on the surface of the droplet is comparable to the yield stress and therefore enough to begin a plastic (and also elastic) deformation.
At stage IV (
 $t\gg 1$
), assuming a spherical shape, balancing weight (
$t\gg 1$
), assuming a spherical shape, balancing weight (
 ${\sim}{\mathcal{V}}\unicode[STIX]{x1D70C}_{droplet}g$
), buoyancy (
${\sim}{\mathcal{V}}\unicode[STIX]{x1D70C}_{droplet}g$
), buoyancy (
 ${\sim}{\mathcal{V}}\unicode[STIX]{x1D70C}_{water}g$
) and drag (
${\sim}{\mathcal{V}}\unicode[STIX]{x1D70C}_{water}g$
) and drag (
 ${\sim}{\textstyle \frac{1}{2}}\unicode[STIX]{x1D70C}_{w}U_{f}^{2}C_{D}\unicode[STIX]{x03C0}R_{s}^{2}$
) forces results in a terminal velocity of
${\sim}{\textstyle \frac{1}{2}}\unicode[STIX]{x1D70C}_{w}U_{f}^{2}C_{D}\unicode[STIX]{x03C0}R_{s}^{2}$
) forces results in a terminal velocity of
 $U_{f}=[{\textstyle \frac{4}{3}}(gD_{s}/C_{D})(\unicode[STIX]{x1D70C}_{D}/\unicode[STIX]{x1D70C}_{w}-1)]^{0.5}$
. At this stage, considering the small density ratio (
$U_{f}=[{\textstyle \frac{4}{3}}(gD_{s}/C_{D})(\unicode[STIX]{x1D70C}_{D}/\unicode[STIX]{x1D70C}_{w}-1)]^{0.5}$
. At this stage, considering the small density ratio (
 $\unicode[STIX]{x1D70C}_{D}/\unicode[STIX]{x1D70C}_{w}\approx 0.002$
), and assuming the viscous drag coefficient
$\unicode[STIX]{x1D70C}_{D}/\unicode[STIX]{x1D70C}_{w}\approx 0.002$
), and assuming the viscous drag coefficient
 $C_{D}=24/Re$
, one finds a final velocity of
$C_{D}=24/Re$
, one finds a final velocity of
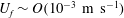 $U_{f}\sim O(10^{-3}~\text{m}~\text{s}^{-1})$
. Accordingly,
$U_{f}\sim O(10^{-3}~\text{m}~\text{s}^{-1})$
. Accordingly,
 ${\mathcal{I}}_{Y}\sim O(10^{4})$
. Additionally, the surface tension vanishes at this stage, hence,
${\mathcal{I}}_{Y}\sim O(10^{4})$
. Additionally, the surface tension vanishes at this stage, hence,
 ${\mathcal{J}}\sim 0$
. Therefore, long after crossing the air–water interface, the droplet retains its shape because of the yield stress and sinks slowly like a solid body.
${\mathcal{J}}\sim 0$
. Therefore, long after crossing the air–water interface, the droplet retains its shape because of the yield stress and sinks slowly like a solid body.
The force analysis explained above for the low-impact-velocity regimes suggests that the majority of the deformation occurs from the moment of impact until shortly after the droplet is fully submerged (roughly
 $0<t/\unicode[STIX]{x1D70F}<10$
, where
$0<t/\unicode[STIX]{x1D70F}<10$
, where
 $\unicode[STIX]{x1D70F}=D_{s}/U_{0}$
). In contrast, before impacting the surface (
$\unicode[STIX]{x1D70F}=D_{s}/U_{0}$
). In contrast, before impacting the surface (
 $t/\unicode[STIX]{x1D70F}<0$
) and sufficiently long enough after passing the interface (
$t/\unicode[STIX]{x1D70F}<0$
) and sufficiently long enough after passing the interface (
 $t/\unicode[STIX]{x1D70F}\gg 1$
), the droplet maintains its shape.
$t/\unicode[STIX]{x1D70F}\gg 1$
), the droplet maintains its shape.
Stage III in the analysis above drastically changes at high impact velocities. For the regimes of bowl-shaped droplets and capsules, the air cavity plays a significant role in defining the final shape of the droplets. This is closely related to the well-studied phenomena of cavity formation and bubble entrainment (Bergmann et al.
Reference Bergmann, van der Meer, Stijnman, Sandtke, Prosperetti and Lohse2006, Reference Bergmann, Van Der Meer, Gekle, Van Der Bos and Lohse2009; Peters, van der Meer & Gordillo Reference Peters, van der Meer and Gordillo2013; Gielen et al.
Reference Gielen, Sleutel, Benschop, Riepen, Voronina, Visser, Lohse, Snoeijer, Versluis and Gelderblom2017). For the impact of a droplet on a bath of the same fluid, it is known that increasing the impact velocity leads to the formation of a cavity in the bath and wave swells at the free surface. For a narrow region of parameter space, the development of a moving capillary wave down the cavity wall results in bubble entrainment (Pumphrey, Crum & Bjørnø Reference Pumphrey, Crum and Bjørnø1989; Oguz & Prosperetti Reference Oguz and Prosperetti1990). In our case, the viscoplastic droplet spreads over the cavity while it grows. When the cavity stops, the different position of the free surface begins to retract with different speeds that eventually leads to the pinch-off of the tip and bubble entrainment. If the pinch-off occurs inside the droplet, capsules form. Balancing the capillary-wave time scale
 $t_{w}\approx [8(\unicode[STIX]{x1D70E}/\unicode[STIX]{x1D70C})\unicode[STIX]{x1D705}^{3}]^{-1/2}$
, where
$t_{w}\approx [8(\unicode[STIX]{x1D70E}/\unicode[STIX]{x1D70C})\unicode[STIX]{x1D705}^{3}]^{-1/2}$
, where
 $\unicode[STIX]{x1D705}\approx 1/D_{s}$
, and the time corresponding to the maximum crater depth,
$\unicode[STIX]{x1D705}\approx 1/D_{s}$
, and the time corresponding to the maximum crater depth,
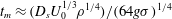 $t_{m}\approx (D_{s}U_{0}^{1/3}\unicode[STIX]{x1D70C}^{1/4})/(64g\unicode[STIX]{x1D70E})^{1/4}$
, yields
$t_{m}\approx (D_{s}U_{0}^{1/3}\unicode[STIX]{x1D70C}^{1/4})/(64g\unicode[STIX]{x1D70E})^{1/4}$
, yields
 $$\begin{eqnarray}We\sim Fr^{1/5},\quad \text{where}\quad We=\frac{\unicode[STIX]{x1D70C}U_{0}^{2}D_{s}}{\unicode[STIX]{x1D70E}}\quad \text{and}\quad Fr=\frac{U_{0}^{2}}{gD_{s}}.\end{eqnarray}$$
If the droplet spreads on the entire surface of the cavity, the cavity will grow perfectly radially and therefore no bubble will form in the retraction phase. Balancing the spreading diameter
 $D_{sp}\approx D_{s}We$
(from the virtual mass force estimation) and the crater diameter
$D_{sp}\approx D_{s}We$
(from the virtual mass force estimation) and the crater diameter
 $D_{c}\approx D_{s}Fr^{1/4}$
(from the energy balance), we see that
$D_{c}\approx D_{s}Fr^{1/4}$
(from the energy balance), we see that
 $$\begin{eqnarray}We\sim Fr^{1/4},\end{eqnarray}$$
as the upper-bound scaling limit of the bubble entrainment regime for inviscid impacts. The scaling above agreed well with the experimental fits of
 $We\sim Fr^{0.179}$
and
$We\sim Fr^{0.179}$
and
 $We\sim Fr^{0.248}$
, for lower and upper limits, respectively (Oguz & Prosperetti Reference Oguz and Prosperetti1990). Note that the prefactors in (3.1) and (3.2) are to be determined by experiments or numerical simulations. For an inviscid system, one expects a vortex-ring region below the lower limit, no bubble entrapment above the upper limit (Rein Reference Rein1996) and bubble entrainment between the two.
$We\sim Fr^{0.248}$
, for lower and upper limits, respectively (Oguz & Prosperetti Reference Oguz and Prosperetti1990). Note that the prefactors in (3.1) and (3.2) are to be determined by experiments or numerical simulations. For an inviscid system, one expects a vortex-ring region below the lower limit, no bubble entrapment above the upper limit (Rein Reference Rein1996) and bubble entrainment between the two.

Figure 5. A
 $We$
–
$We$
–
 $Fr$
plot showing the different behaviour upon impact of a droplet onto a bath. Reference set I: Chapman & Critchlow (Reference Chapman and Critchlow1967), Esmailizadeh & Mesler (Reference Esmailizadeh and Mesler1986), Cai (Reference Cai1989), Pumphrey & Elmore (Reference Pumphrey and Elmore1990), Sigler & Mesler (Reference Sigler and Mesler1990), Rein (Reference Rein1996), Elmore, Chahine & Oguz (Reference Elmore, Chahine and Oguz2001), Leng (Reference Leng2001), Deng, Anilkumar & Wang (Reference Deng, Anilkumar and Wang2007) and Liow & Cole (Reference Liow and Cole2009). Reference set II: Pumphrey & Elmore (Reference Pumphrey and Elmore1990), Rein (Reference Rein1996), Morton, Rudman & Jong-Leng (Reference Morton, Rudman and Jong-Leng2000), Elmore et al. (Reference Elmore, Chahine and Oguz2001), Leng (Reference Leng2001), Deng et al. (Reference Deng, Anilkumar and Wang2007) and Liow & Cole (Reference Liow and Cole2009). Reference set III: Worthington (Reference Worthington1883, Reference Worthington1908), Franz (Reference Franz1959), Van de Sande, Smith & Van Oord (Reference Van de Sande, Smith and Van Oord1974), Macklin & Metaxas (Reference Macklin and Metaxas1976), Hallett & Christensen (Reference Hallett and Christensen1984), Hsiao, Lichter & Quintero (Reference Hsiao, Lichter and Quintero1988), Khaleeq-ur Rahman & Saunders (Reference Khaleeq-ur Rahman and Saunders1988), Cai (Reference Cai1989), Pumphrey & Elmore (Reference Pumphrey and Elmore1990), Rein (Reference Rein1996), Morton et al. (Reference Morton, Rudman and Jong-Leng2000), Fedorchenko & Wang (Reference Fedorchenko and Wang2004), Tomita, Saito & Ganbara (Reference Tomita, Saito and Ganbara2007) and Bisighini et al. (Reference Bisighini, Cossali, Tropea and Roisman2010).
$Fr$
plot showing the different behaviour upon impact of a droplet onto a bath. Reference set I: Chapman & Critchlow (Reference Chapman and Critchlow1967), Esmailizadeh & Mesler (Reference Esmailizadeh and Mesler1986), Cai (Reference Cai1989), Pumphrey & Elmore (Reference Pumphrey and Elmore1990), Sigler & Mesler (Reference Sigler and Mesler1990), Rein (Reference Rein1996), Elmore, Chahine & Oguz (Reference Elmore, Chahine and Oguz2001), Leng (Reference Leng2001), Deng, Anilkumar & Wang (Reference Deng, Anilkumar and Wang2007) and Liow & Cole (Reference Liow and Cole2009). Reference set II: Pumphrey & Elmore (Reference Pumphrey and Elmore1990), Rein (Reference Rein1996), Morton, Rudman & Jong-Leng (Reference Morton, Rudman and Jong-Leng2000), Elmore et al. (Reference Elmore, Chahine and Oguz2001), Leng (Reference Leng2001), Deng et al. (Reference Deng, Anilkumar and Wang2007) and Liow & Cole (Reference Liow and Cole2009). Reference set III: Worthington (Reference Worthington1883, Reference Worthington1908), Franz (Reference Franz1959), Van de Sande, Smith & Van Oord (Reference Van de Sande, Smith and Van Oord1974), Macklin & Metaxas (Reference Macklin and Metaxas1976), Hallett & Christensen (Reference Hallett and Christensen1984), Hsiao, Lichter & Quintero (Reference Hsiao, Lichter and Quintero1988), Khaleeq-ur Rahman & Saunders (Reference Khaleeq-ur Rahman and Saunders1988), Cai (Reference Cai1989), Pumphrey & Elmore (Reference Pumphrey and Elmore1990), Rein (Reference Rein1996), Morton et al. (Reference Morton, Rudman and Jong-Leng2000), Fedorchenko & Wang (Reference Fedorchenko and Wang2004), Tomita, Saito & Ganbara (Reference Tomita, Saito and Ganbara2007) and Bisighini et al. (Reference Bisighini, Cossali, Tropea and Roisman2010).
Figure 5 compares our results with the results of Oguz & Prosperetti (Reference Oguz and Prosperetti1990) and a collection of other experimental data, some previously collected in Murphy et al. (Reference Murphy, Li, d’Albignac, Morra and Katz2015). The inviscid bubble entrainment limits slightly underestimate the boundaries of bowls and capsules in our system, where bubbles form. This is consistent with the findings of Deng et al. (Reference Deng, Anilkumar and Wang2007), who found that increasing the viscosity of the liquid weakens the capillary waves and shifts the limits: therefore, the higher the viscosity, the higher the impact velocity required to entrain a bubble. We anticipate that the presence of the viscoplastic layer at the free surface, during the retraction of the cavity, results in the same trend.
3.3 Phase diagram and final shapes
To classify the final morphologies of the viscoplastic droplets, we introduce a Reynolds number of the form
 $$\begin{eqnarray}Re=\frac{\unicode[STIX]{x1D70C}U_{0}^{2}}{K(U_{0}/D_{s})^{n}+\unicode[STIX]{x1D70F}_{0}}.\end{eqnarray}$$
The number above compares the inertial stress and the total internal stress, which contains two parts due to the power law and the plastic viscosities. By using this non-dimensional group, we assume that the yield stress only contributes to the final shape via the plastic viscosity. A Reynolds number of this type has previously been used in the context of viscoplastic droplets (Blackwell et al.
Reference Blackwell, Deetjen, Gaudio and Ewoldt2015) and other configurations (Thompson & Soares Reference Thompson and Soares2016; Liu & de Bruyn Reference Liu and de Bruyn2018) (also see Madlener, Frey & Ciezki Reference Madlener, Frey and Ciezki2009; Chen & Bertola Reference Chen and Bertola2017). In our experiments, except at very low impact velocities, the stress due to the inertia (
 $\unicode[STIX]{x1D70C}U_{0}^{2}\sim O(10^{2}{-}10^{4})$
) is at least an order of magnitude larger than the viscous stresses (
$\unicode[STIX]{x1D70C}U_{0}^{2}\sim O(10^{2}{-}10^{4})$
) is at least an order of magnitude larger than the viscous stresses (
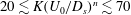 $20\lesssim K(U_{0}/D_{s})^{n}\lesssim 70$
, and
$20\lesssim K(U_{0}/D_{s})^{n}\lesssim 70$
, and
 $7\lesssim \unicode[STIX]{x1D70F}_{0}\lesssim 20$
). Beside the Reynolds number, we can choose either the Weber or the Froude number (see (3.1)), because our equivalent diameter,
$7\lesssim \unicode[STIX]{x1D70F}_{0}\lesssim 20$
). Beside the Reynolds number, we can choose either the Weber or the Froude number (see (3.1)), because our equivalent diameter,
 $D_{s}$
, is fixed and therefore
$D_{s}$
, is fixed and therefore
 $Fr=We/Bo$
, where
$Fr=We/Bo$
, where
 $Bo=\unicode[STIX]{x1D70C}gD_{s}^{2}/\unicode[STIX]{x1D70E}\approx 1.4$
in all cases. We categorize the final shape of the droplets in a phase diagram. Figure 6 shows the map of the final shapes in the
$Bo=\unicode[STIX]{x1D70C}gD_{s}^{2}/\unicode[STIX]{x1D70E}\approx 1.4$
in all cases. We categorize the final shape of the droplets in a phase diagram. Figure 6 shows the map of the final shapes in the
 $Fr$
–
$Fr$
–
 $Re$
space. At small
$Re$
space. At small
 $Re$
and
$Re$
and
 $Fr$
, when inertial forces are not much stronger than the viscous stresses, and the cavities are small, the droplet deforms only at the bottom, and the final morphologies are pear-shaped. By increasing
$Fr$
, when inertial forces are not much stronger than the viscous stresses, and the cavities are small, the droplet deforms only at the bottom, and the final morphologies are pear-shaped. By increasing
 $Re$
and
$Re$
and
 $Fr$
(i.e. inertial effects), the shapes transit to sombreros and bowls. Eventually, at sufficiently large
$Fr$
(i.e. inertial effects), the shapes transit to sombreros and bowls. Eventually, at sufficiently large
 $Re$
and
$Re$
and
 $Fr$
, the capsules are formed. Figure 6 also highlights the boundaries in which the Worthington jet is formed (dashed line) and damped (dashed-dotted line). In between these two boundaries, a jet always forms and breaks up into one or multiple droplets due to the Rayleigh–Plateau instability.
$Fr$
, the capsules are formed. Figure 6 also highlights the boundaries in which the Worthington jet is formed (dashed line) and damped (dashed-dotted line). In between these two boundaries, a jet always forms and breaks up into one or multiple droplets due to the Rayleigh–Plateau instability.

Figure 6. Different regimes of the final shapes. Symbols correspond to different shapes; see the legend.
We elaborate on the geometrical characteristics of the final shapes, measuring the final aspect ratio of the droplets:
 ${\mathcal{A}}_{f}=D_{f}/H_{f}$
, where
${\mathcal{A}}_{f}=D_{f}/H_{f}$
, where
 $D_{f}$
and
$D_{f}$
and
 $H_{f}$
are the final diameter and height, respectively. Figure 7(a,b) shows the variation of
$H_{f}$
are the final diameter and height, respectively. Figure 7(a,b) shows the variation of
 ${\mathcal{A}}_{f}$
versus the Reynolds and Froude numbers, respectively. For a few data points, where
${\mathcal{A}}_{f}$
versus the Reynolds and Froude numbers, respectively. For a few data points, where
 $Re$
and
$Re$
and
 $Fr$
are small, the aspect ratio is smaller than 1, i.e. only a small portion of the initially prolate droplet undergoes plastic deformation. For the pears and sombreros, increasing the inertial effects leads to a larger aspect ratio. For
$Fr$
are small, the aspect ratio is smaller than 1, i.e. only a small portion of the initially prolate droplet undergoes plastic deformation. For the pears and sombreros, increasing the inertial effects leads to a larger aspect ratio. For
 $Re\lesssim 35$
, the data of all samples collapses with an almost linear dependence on
$Re\lesssim 35$
, the data of all samples collapses with an almost linear dependence on
 $Re$
. When plotted versus the Froude number, the values of the final aspect ratio depend on the rheology, for the same regime of low inertia: the softer the gel, the higher the aspect ratio. After reaching a maximum, the values of
$Re$
. When plotted versus the Froude number, the values of the final aspect ratio depend on the rheology, for the same regime of low inertia: the softer the gel, the higher the aspect ratio. After reaching a maximum, the values of
 ${\mathcal{A}}_{f}$
drop. This is when the regime transition to the bowl-shaped droplets occurs. The aspect ratio approaches unity (spherical capsules) with increasing inertial effects. Contrary to the previous two regimes, now the Froude number scales the data. We point out that the values of
${\mathcal{A}}_{f}$
drop. This is when the regime transition to the bowl-shaped droplets occurs. The aspect ratio approaches unity (spherical capsules) with increasing inertial effects. Contrary to the previous two regimes, now the Froude number scales the data. We point out that the values of
 ${\mathcal{A}}_{0}$
depend on the initial shape of the droplets (see figure 2
c). Therefore we cannot make any scaling argument based on figure 7(a,b). We also look at the ratio of the final aspect ratio to the initial one,
${\mathcal{A}}_{0}$
depend on the initial shape of the droplets (see figure 2
c). Therefore we cannot make any scaling argument based on figure 7(a,b). We also look at the ratio of the final aspect ratio to the initial one,
 ${\mathcal{A}}_{f}/{\mathcal{A}}_{0}$
. Similar to the trends of
${\mathcal{A}}_{f}/{\mathcal{A}}_{0}$
. Similar to the trends of
 ${\mathcal{A}}_{f}$
, the ratio initially increases with inertia (for pears and sombreros). The values drop when transitioning to the regime of bowl-shaped droplets. Interestingly, the final relative aspect ratio of the capsules (crosses in figure 7) seems to be only slightly dependent on the Froude number, reaching a universal value of
${\mathcal{A}}_{f}$
, the ratio initially increases with inertia (for pears and sombreros). The values drop when transitioning to the regime of bowl-shaped droplets. Interestingly, the final relative aspect ratio of the capsules (crosses in figure 7) seems to be only slightly dependent on the Froude number, reaching a universal value of
 ${\mathcal{A}}_{f}/{\mathcal{A}}_{0}\approx 3.2$
. The origin of this number, nonetheless, is not clear to us at this point. The values of the relative aspect ratio represent, to a degree, an efficiency factor of a water-entry system in deforming a viscoplastic droplet, where, for the regime of sombreros, it reaches values of as large as 10.
${\mathcal{A}}_{f}/{\mathcal{A}}_{0}\approx 3.2$
. The origin of this number, nonetheless, is not clear to us at this point. The values of the relative aspect ratio represent, to a degree, an efficiency factor of a water-entry system in deforming a viscoplastic droplet, where, for the regime of sombreros, it reaches values of as large as 10.

Figure 7. Final aspect ratio (
 ${\mathcal{A}}_{0}=D_{0}/H_{0}$
) versus (a) Reynolds and (b) Froude numbers. Also, relative final aspect ratio (
${\mathcal{A}}_{0}=D_{0}/H_{0}$
) versus (a) Reynolds and (b) Froude numbers. Also, relative final aspect ratio (
 ${\mathcal{A}}_{f}/{\mathcal{A}}_{0}$
) versus (c) Reynolds number and (d) Froude number. Symbols represent different final shapes: pears (circles), sombreros (squares), bowls (pluses) and capsules (crosses). The inset in (c) shows the schematics of the initial and final shapes.
${\mathcal{A}}_{f}/{\mathcal{A}}_{0}$
) versus (c) Reynolds number and (d) Froude number. Symbols represent different final shapes: pears (circles), sombreros (squares), bowls (pluses) and capsules (crosses). The inset in (c) shows the schematics of the initial and final shapes.
4 Conclusion
In this paper, we have experimentally studied the water entry of a viscoplastic object. The system offers a method to sculpt the shape of droplets by merely making them pass through an air–water interface at different velocities. The problem shares characteristics with a classical water-entry problem of solid objects and the impact of immiscible droplets on a liquid surface. We show that the droplets reach the free surface with a static shape (balancing the capillary pressure and the yield stress), deform plastically upon entry (due to the shear stress and the motion of the cavity), and sink with a static shape at large time (balancing drag and gravity forces). The final shapes can be categorized using Reynolds and Froude numbers. By increasing these numbers, the shape of a viscoplastic droplet shifts from pears to sombreros to bowls, and eventually capsules. We categorize the final morphologies in a regime map and provide information on their final aspect ratio.
Our study has direct applications in non-spherical bead production. Additionally, among the final shapes, the production of capsules (especially if implemented on small scales) might be of particular interest for applications involving polymeric capsules such as controlled release of drugs, food additives and cell encapsulations (Zhang et al. Reference Zhang, Tumarkin, Peerani, Nie, Sullan, Walker and Kumacheva2006). In a broader perspective, the system provides information on the impact of elasto-plastic objects on water which has a wide range of applications in structure engineering (Peseux et al. Reference Peseux, Gornet and Donguy2005; Seddon & Moatamedi Reference Seddon and Moatamedi2006). Finally, we would like to remark that more theoretical studies are required to explore many details of such a complicated system. An ideal model should involve a mathematical way to solve the moving boundaries of two deformable phases and incorporate the rheological properties. The development of such a model is currently work in progress.
Acknowledgements
The authors thank C. Seyfert, D. van der Meer and A. Prosperetti for useful discussions.
Supplementary movies
Supplementary movies are available at https://doi.org/10.1017/jfm.2019.32.
Appendix A. First few moments
At the moment of impact, the bottom of the droplet experiences a sudden change of surrounding media, with a different density. This results in a shock-type pressure wave (water-hammer effect). Following the work of Miloh (Reference Miloh1991), we can find an analytical expression for the small-time slamming coefficient:
 $$\begin{eqnarray}C_{S}(t^{\ast })={\textstyle \frac{1}{2}}F_{S}/(\unicode[STIX]{x1D70C}_{w}\unicode[STIX]{x03C0}D_{s}^{2}U_{0}^{2})\approx 7.77t^{\ast 0.5}-8.38t^{\ast }-12.05t^{\ast 1.5}+O(t^{\ast 2}),\end{eqnarray}$$
where
 $F_{S}$
is the slamming force and
$F_{S}$
is the slamming force and
 $t^{\ast }=t/\unicode[STIX]{x1D70F}$
. Such analysis is common in slamming and water-entry processes to find the maximum shock pressure. Normalizing the slamming force with the effective area,
$t^{\ast }=t/\unicode[STIX]{x1D70F}$
. Such analysis is common in slamming and water-entry processes to find the maximum shock pressure. Normalizing the slamming force with the effective area,
 $A(t^{\ast })=\unicode[STIX]{x03C0}D_{s}^{2}(t^{\ast }-t^{\ast 2})$
, and the yield stress,
$A(t^{\ast })=\unicode[STIX]{x03C0}D_{s}^{2}(t^{\ast }-t^{\ast 2})$
, and the yield stress,
 $\unicode[STIX]{x1D70F}_{0}$
, leads to
$\unicode[STIX]{x1D70F}_{0}$
, leads to
 ${\mathcal{I}}_{0^{+}}=F_{S}/\unicode[STIX]{x1D70F}_{0}A$
. This
${\mathcal{I}}_{0^{+}}=F_{S}/\unicode[STIX]{x1D70F}_{0}A$
. This
 ${\mathcal{I}}_{0^{+}}$
is singular at
${\mathcal{I}}_{0^{+}}$
is singular at
 $t=0$
, as the magnitude of the slamming force decays much faster than the area, i.e. the slamming pressure is much larger than the yield stress at
$t=0$
, as the magnitude of the slamming force decays much faster than the area, i.e. the slamming pressure is much larger than the yield stress at
 $t=0^{+}$
. The time scale of such phenomena is nonetheless small (
$t=0^{+}$
. The time scale of such phenomena is nonetheless small (
 $D_{s}/c\sim O(10^{-6}~\text{s})$
), where
$D_{s}/c\sim O(10^{-6}~\text{s})$
), where
 $c$
is the speed of sound in water. In our experiments, we did not see any effect of such pressure shock on the droplet.
$c$
is the speed of sound in water. In our experiments, we did not see any effect of such pressure shock on the droplet.
Appendix B. Dynamics
Figure 8 shows some qualitative analysis of what is explained in § 3.1. Figure 8(a) shows a series of examples of the temporal variation of the diameter of droplets of sample 3 at different impact velocities (only pears and sombreros are shown). In all cases, the droplet’s diameter increases, almost linearly, reaching a maximum diameter at
 $t/\unicode[STIX]{x1D70F}\approx 3$
. The droplet then reaches an equilibrium diameter while it is elastically deforming. If the impact velocity is high enough, the brims of the sombreros elastically oscillate, as shown in § 3.1.
$t/\unicode[STIX]{x1D70F}\approx 3$
. The droplet then reaches an equilibrium diameter while it is elastically deforming. If the impact velocity is high enough, the brims of the sombreros elastically oscillate, as shown in § 3.1.

Figure 8. (a) Droplet diameter for sample 3 at different impact velocity. The inset is the same curve in a linear–linear scale. (b) Cavity maximum height for sample 2 at different impact velocity. The inset is the same curve in a linear–linear scale. The red dashed line in (b) shows
 $H_{c}/D_{s}=0.44t/\unicode[STIX]{x1D70F}$
.
$H_{c}/D_{s}=0.44t/\unicode[STIX]{x1D70F}$
.
Figure 8(b) shows the evolution of the maximum height of the cavities for droplets of sample 2 at different impact velocities. Similar to figure 8(a), we exclude the bowls and capsules. The cavity height, at short time, grows linearly. The red dashed line denotes
 $H_{c}/D_{s}=0.44t/\unicode[STIX]{x1D70F}$
, corresponding to the early-stage prediction of Bisighini et al. (Reference Bisighini, Cossali, Tropea and Roisman2010), using an inviscid theory and ignoring the effects of gravity and droplet deceleration. After reaching a maximum value, the cavity retracts. The smaller the impact velocity, the smaller the cavity and the sooner it retracts.
$H_{c}/D_{s}=0.44t/\unicode[STIX]{x1D70F}$
, corresponding to the early-stage prediction of Bisighini et al. (Reference Bisighini, Cossali, Tropea and Roisman2010), using an inviscid theory and ignoring the effects of gravity and droplet deceleration. After reaching a maximum value, the cavity retracts. The smaller the impact velocity, the smaller the cavity and the sooner it retracts.
Appendix C. Very small and very large yield stress
The mechanics of viscoplastic water entry reported in the text change when the gel becomes very soft or very hard. By reducing the concentration of the polymer, we approach a Newtonian droplet. Figure 9(a) shows an example of water-entry process for a gel with
 $\unicode[STIX]{x1D70F}_{0}\approx 2~\text{Pa}$
at
$\unicode[STIX]{x1D70F}_{0}\approx 2~\text{Pa}$
at
 $U_{0}=0.32~\text{m}~\text{s}^{-1}$
. The droplet highly deforms at the early stage of the impact. Additionally, the motion of the free surface and the resultant fluid motion inside the bath significantly affect the shape of the droplet: the droplet first retracts with the cavity and later is pushed down (
$U_{0}=0.32~\text{m}~\text{s}^{-1}$
. The droplet highly deforms at the early stage of the impact. Additionally, the motion of the free surface and the resultant fluid motion inside the bath significantly affect the shape of the droplet: the droplet first retracts with the cavity and later is pushed down (
 $t=29~\text{ms}$
). Eventually, the vortex rings form and largely develop (
$t=29~\text{ms}$
). Eventually, the vortex rings form and largely develop (
 $t=205~\text{ms}$
). The yield stress only appears to be important at the late time when the sedimentation velocity and the flow around the droplet are small. Such a regime is close to impact of immiscible viscous droplets, previously studied by many (e.g. see San Lee et al.
Reference San Lee, Park, Lee, Weon, Fezzaa and Je2015; Thoraval et al.
Reference Thoraval, Li and Thoroddsen2016).
$t=205~\text{ms}$
). The yield stress only appears to be important at the late time when the sedimentation velocity and the flow around the droplet are small. Such a regime is close to impact of immiscible viscous droplets, previously studied by many (e.g. see San Lee et al.
Reference San Lee, Park, Lee, Weon, Fezzaa and Je2015; Thoraval et al.
Reference Thoraval, Li and Thoroddsen2016).
Figure 9(b) shows an example of impact of a viscoplastic droplet of
 $\unicode[STIX]{x1D70F}_{0}=35~\text{Pa}$
at
$\unicode[STIX]{x1D70F}_{0}=35~\text{Pa}$
at
 $U_{0}=0.65~\text{m}~\text{s}^{-1}$
. The large yield stress results in a very small initial aspect ratio, which makes the experiments difficult. In several cases, the droplet already buckles during the formation (see Balmforth & Hewitt Reference Balmforth and Hewitt2013). Also, a normal impact was hard to achieve, since the droplet tends to rotate before the impact. In a successful experiment, the tall droplets undergo buckling upon impact: the bottom of the droplet yields and deforms, and when the droplet is crossing the free surface, it bends. The process typically associates with bubble formation as well (
$U_{0}=0.65~\text{m}~\text{s}^{-1}$
. The large yield stress results in a very small initial aspect ratio, which makes the experiments difficult. In several cases, the droplet already buckles during the formation (see Balmforth & Hewitt Reference Balmforth and Hewitt2013). Also, a normal impact was hard to achieve, since the droplet tends to rotate before the impact. In a successful experiment, the tall droplets undergo buckling upon impact: the bottom of the droplet yields and deforms, and when the droplet is crossing the free surface, it bends. The process typically associates with bubble formation as well (
 $t=8~\text{ms}$
).
$t=8~\text{ms}$
).

Figure 9. Impact of (a) a soft gel droplet (
 $\unicode[STIX]{x1D70F}_{0}=2~\text{Pa}$
) at
$\unicode[STIX]{x1D70F}_{0}=2~\text{Pa}$
) at
 $U_{0}=0.32~\text{m}~\text{s}^{-1}$
and (b) a hard gel (
$U_{0}=0.32~\text{m}~\text{s}^{-1}$
and (b) a hard gel (
 $\unicode[STIX]{x1D70F}_{0}=35~\text{Pa}$
) at
$\unicode[STIX]{x1D70F}_{0}=35~\text{Pa}$
) at
 $U_{0}=0.65~\text{m}~\text{s}^{-1}$
.
$U_{0}=0.65~\text{m}~\text{s}^{-1}$
.


 Open access