


The WHO has identified Zn deficiency as one of the leading risk factors of disease, ranking fifth in developing countries and eleventh in developed countries(Reference Guilbert1). The 2002 WHO report estimates that Zn deficiency accounts for 18 % of malaria cases, 16 % of lower respiratory tract infections, and 10 % of diarrhoeal disease worldwide. Infants and young children are among the population groups at most risk of Zn deficiency due to their increased requirements during growth(Reference Hambidge2).
Prasad(Reference Prasad3) has reported that peripheral lymphocytes from Zn-deficient humans produce less IL-2 and interferon (IFN)-γ (often referred to as Th1 cytokines) while the Th2 cytokines (IL-6 and IL-10) were not affected. Th1 cytokines initiate a cellular response involving natural killer cells and cytotoxic T-cells which directly combat intracellular infections, but overproduction can lead to autoimmune diseases(Reference Mosmann and Sad4). Th2 cytokines stimulate the humoral response which is more effective at defending against intercellular infections, but overproduction of Th2 cytokines can lead to allergies(Reference Mosmann and Sad4). The balance between Th1 and Th2 cells is controlled mainly by the cytokines they produce. IFN-γ inhibits the cytokine production by Th2 cells, and IL-10 inhibits proliferation of Th1 cells(Reference Mosmann and Sad4).
Zn has been shown to be essential for the expression of IL-2 receptors on lymphocytes(Reference Tanaka, Shiozawa, Morimoto and Fujita5). Sprietsma(Reference Sprietsma6) has hypothesised that with fewer IL-2 receptors, Th1 cells cannot respond to nor produce the IL-2 they need to proliferate; therefore, the Th2-producing cells and their cytokines begin to dominate. There have been very few reports on the effects of Zn deficiency on allergic disease; however, Zn-deficient mice had increased broncopulmonary eosinophil inflammation while Zn supplementation decreased eosinophil numbers(Reference Richter, Bonneau, Girard, Beaulieu and Larivée7).
Cytokines also play a role in thymocyte maturation(Reference Yarilin and Belyakov8); however, the effect of dietary Zn deficiency on thymocyte cytokine production has not been investigated. Theoretically, low IL-2 and IFN-γ concentrations in the thymus would limit T-cell proliferation and differentiation, resulting in reduced thymocyte numbers (thymic atrophy) and consequently fewer new T-cells being released into the periphery, thereby leading to lymphopenia and increased susceptibility to disease(Reference Yarilin and Belyakov8).
Peripheral IL-6 (a Th2 cytokine) production can stimulate the hypothalamus–pituitary–adrenal axis leading to increased production of corticosterone by the adrenal gland(Reference van der Meer, Sweep, Rijnkels, Pesman, Tilders, Kloppenborg and Hermus9). Corticosterone has been shown to suppress production of IFN-γ and IL-2 by splenic Th1 cells, thereby pushing the cytokine balance towards Th2(Reference Iwakabe, Shimada, Ohta, Yahata, Ohmi, Habu and Nishimura10). Thus, we hypothesised that the low Zn status during dietary Zn deficiency shifts cytokine production in favour of a Th2 response and this shift in cytokine production is compounded by the higher serum corticosterone concentrations associated with dietary Zn deficiency.
The objective of the present study was to determine potential differences in the ex vivo cytokine production (IL-2, IFN-γ, IL-6 and IL-10) of isolated thymocytes and splenocytes after mitogenic stimulation with concanavalin A (ConA) in Zn-deficient, pair-fed, marginally Zn-deficient and control growing rats. Serum corticosterone concentrations were also measured to explore whether chronic in vivo exposure to corticosterone is associated with altered Th1/Th2 cytokine production ex vivo. Flow cytometric analysis was used to determine the proportion of thymic and splenic T-cell subsets.
Experimental methods
Animals and diets
Thirty-two weanling Sprague–Dawley rats (Charles River Laboratories, St Constant, PQ, Canada) were acclimatised for 5 d and randomly assigned to one of four dietary treatment groups (eight rats per group) for 3 weeks: Zn-deficient ( < 1 mg Zn/kg), marginally Zn-deficient (10 mg Zn/kg), nutritionally complete control diet (30 mg Zn/kg) and pair-fed (fed the control diet, but only the amount of feed as consumed on the previous day by the individual Zn-deficient rat paired to the pair-fed rat). The pair-fed group controls for the effects of undernutrition commonly seen in Zn deficiency. Body weight was measured weekly and feed intake was measured daily.
The experimental diets (based on the AIN-93G formulation and previously described by Lepage et al. (Reference Lepage, Giesbrecht and Taylor11)) containing egg white, additional biotin (2 mg/kg diet) and potassium phosphate were fed ad libitum, except for the pair-fed group, and distilled water was provided. Zn content of the diets was verified by atomic absorption analysis (for details of methodology, see ‘Zinc analysis’). To avoid Zn recycling and contamination, the rats were housed individually in stainless-steel hanging cages with mesh bottoms so urine and faeces could drop to the shavings below. In addition, the Zn-deficient group was placed on the upper rows of the cage rack. The rats were maintained in an environment of controlled temperature (21–23°C), humidity (55 %) and light cycle (14 h light and 10 h dark). Animal care was provided in accordance with a protocol approved by the University of Manitoba Protocol Management and Review Committee.
Sample collection
At the end of the feeding trial, the rats were euthanised by CO2 asphyxiation and decapitation. Trunk blood was collected and centrifuged (Beckman TJ-6R Tabletop centrifuge; Beckman Coulter Canada Inc., Mississauga, ON, Canada) to obtain serum and stored at − 80°C until analysis. The spleen and thymus were removed aseptically, weighed and then processed immediately. Femurs were removed, cleaned of soft tissue and stored at − 20°C until analysis.
Cell preparation
Single-cell suspensions of spleen and thymus were prepared by pressing tissues through nylon screens into Hank's buffered saline supplemented with 10 mm-HEPES, 4 % dextran charcoal-absorbed fetal bovine serum (HyClone, Logan, UT, USA) and 1 % antibiotic/antimycotic at pH 7·4. Dextran charcoal-absorbed fetal bovine serum was used to limit the amount of external steroids that the splenocytes are exposed to during cell preparation. Erythrocytes in the spleen cell suspensions were lysed using ammonium chloride lysis buffer (155 mm-NH4Cl, 0·1 mm-EDTA and 10 mm-KHCO3 at pH 7·2). Cell concentration and viability were determined using trypan blue dye exclusion on an AO Bright-Line Hemacytometer (American Optical Corporation, Buffalo, NY, USA).
Cytokine stimulation
Thymocytes and splenocytes (3 × 10⁶ cells) from each rat were re-suspended in 3 ml sterile Roswell Park Memorial Institute (RPMI)-1640 supplemented with 10 mm-HEPES, 10 mm-sodium bicarbonate, 1 mm-sodium pyruvate, 2 mm-glutamine, 0·1 mm-non-essential amino acids, 50 μm-2-mercaptoethanol, 1 % antibiotic/antimycotic and 5 % fetal bovine serum at pH 7·2. ConA (300 μl of 2·5 μg/ml working solution) was added and cells were incubated at 37°C with 5 % CO2 for 48 h. Cells not exposed to mitogen were included as a control to verify that mitogenic stimulation increased cytokine production. After 48 h incubation, cells were centrifuged for 5 min at 300 g. Cell-culture supernatant fractions were collected and stored at − 80°C until analysis.
Outcome measurements
Zinc analysis
After obtaining wet and dry weights, femurs and diet samples were wet-ashed using trace element-grade nitric acid as described previously(Reference Clegg, Keen, Lonnerdal and Hurley12). After appropriate dilution of digests or serum with double-deionised water, Zn concentration was determined by atomic absorption spectrometry (Varian Spectra AA; Varian Mississauga, ON, Canada). Bovine liver standard reference material 1577b (US Department of Commerce, National Institute of Standards and Technology, Gaithersburg, MD, USA) and human serum reference (BioRad Laboratories, Irvine, CA, USA) were used as quality controls.
Determination of T-lymphocyte subpopulations: antibodies
Monoclonal antibodies for T-cell receptor (TCR) αβ (phycoerythrin (PE) label, clone R73, isotype mouse IgG1, k), CD90 (fluorescein isothiocyanate (FITC) label, Thy1·1, clone OX-7, isotype mouse IgG1, k), CD4 (PE–Cy5 label, clone OX-35, isotype mouse IgG2a, k) and CD8 (biotin, clone OX-8, isotype mouse IgG1, k) were obtained from BD Pharmingen (Mississauga, Ontario, Canada). Streptavidin–PE–Cy7 conjugate was used to label the biotinylated antibodies.
Determination of T-lymphocyte subpopulations: cell labelling and flow cytometry
Cells from each dietary treatment group and tissue were washed and placed in label buffer (PBS containing 23 mm-sodium azide and 2 % fetal bovine serum, pH 7·4) at 4°C at a concentration of 1 × 10⁶ cells/ml. The biotinylated anti-CD8 antibody was added first, incubated for 30 min at 4°C, followed by a wash step. Then, the directly conjugated antibodies and streptavidin–PE–Cy7 were added, incubated as previously described, followed by a wash step. Samples were re-suspended in PBS containing 50 % fetal bovine serum. Ethanol (70 %) was added drop-wise while gently mixing to a final concentration of 50 %. Cells were stored overnight at 4°C and analysed on the flow cytometer the following morning.
Flow cytometry analysis was performed on a Beckman Coulter EPICS ALTRA (Beckman Coulter, Mississauga, ON, Canada) high-speed cell sorter with laser excitation tuned to 488 nm (65 mW) and UV. Figs. 1 and 2 depict representative flow cytometry plots from thymus and spleen, respectively. Forward v. side-scatter histograms were used to gate on intact lymphoid cells. The fluorescence signals were separated with the standard dichotic long-pass filters provided with the instrument and detected through 525 nm (FITC), 575 nm (PE), 675 nm (PE–Cy5) and 735 nm (PE–Cy7) bandpass filters. The data were collected in list-mode format with the subsequent analyses based on 20 000 cells satisfying the light scatter gate for CD90+ in thymocytes, or 20 000 cells satisfying the light scatter gate for TCRαβ+CD90− in splenocytes using the EXPO32 MultiCOMP MFA software (Beckman Coulter) provided with the instrument. Flurochrome-isotype-matched controls were prepared to assess autofluorescence and non-specific binding, while single-colour samples were employed to adjust colour compensation.
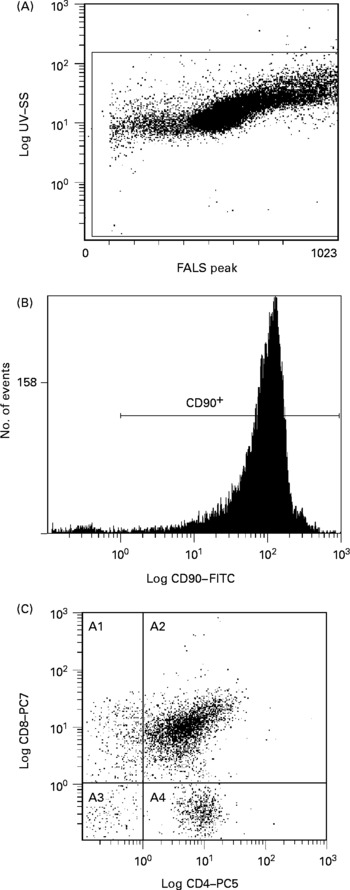
Fig. 1 Representative flow cytometry plot of thymocytes. Definition of lymphocytes (CELLS) by forward v. side scatter (A); definition of CD90 binding after gating on CELLS (B); CD8 and CD4 binding after gating on CD90+and CELLS (C). SS, side scatter; FALS, forward angle light scatter; FITC, fluorescein isothiocyanate; PC, phycoerythrin-cyanine; A1, CD90+CD8+CD4− ; A2, CD90+CD8+CD4+; A3, CD90+CD8− CD4− ; A4, CD90+CD8− CD4+.
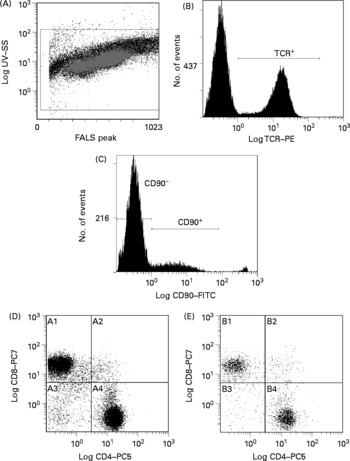
Fig. 2 Representative flow cytometry plot of splenocytes. Definition of lymphocytes (CELLS) by forward v. side scatter (A); definition of T-cell receptor (TCR) αβ binding after gating on CELLS (B); definition of CD90 binding after gating on TCRαβ+and CELLS (C); CD8 and CD4 binding after gating on CD90− , TCRαβ+and CELLS (D); CD8 and CD4 binding after gating on CD90+, TCRαβ+and CELLS (E). SS, side scatter; FALS, forward angle light scatter; PE, phycoerythrin; FITC, fluorescein isothiocyanate; PC; phycoerythrin-cyanine; A1, TCRαβ+CD90− CD8+CD4− ; A2, TCRαβ+CD90− CD8+CD4+; A3, TCRαβ+CD90− CD8− CD4− ; A4, TCRαβ+CD90− CD8− CD4+; B1, TCRαβ+CD90+CD8+CD4− ; B2, TCRαβ+CD90+CD8+CD4+; B3, TCRαβ+CD90+CD8− CD4− ; B4, TCRαβ+CD90+CD8− CD4+.
Cytokine analysis
IL-2, IL-6, IL-10 and IFN-γ in cell-culture supernatant fractions were determined simultaneously using a cytometric bead array kit (LINCO Research, St Charles, MO, USA). The standard curves were 4·88 to 20 000 pg/ml. The samples were analysed using the Luminex™ 100 instrument (Luminex Corporation, Austin, TX, USA).
Corticosterone concentration
Serum corticosterone concentrations were determined using an enzyme immunoassay kit (Assay Designs, Ann Arbor, MI, USA).
Statistical analyses
Data were analysed by one-way ANOVA using the general linear models procedure or repeated-measures ANOVA (SAS software release 9.1; SAS Institute, Cary, NC, USA) as appropriate. Significant differences among means were determined using Duncan's multiple-range test. Differences were considered significant at P < 0·05.
Results
Feed intake
After only 3 d of treatment, the Zn-deficient group consumed 17 % less feed per d than the control and marginally Zn-deficient groups (Fig. 3). By day 4, the Zn-deficient group was consuming 54 % less feed per d than the marginally Zn-deficient and control groups and this continued until the end of the study. The marginally Zn-deficient group did not exhibit any signs of anorexia throughout the study.
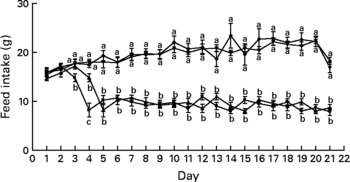
Fig. 3 Feed intake of Zn-deficient (■), marginally Zn-deficient (▾), pair-fed (▲) and control (♦) rats over 21 d. Values are means for eight rats per group, with their standard errors represented by vertical bars. There were significant main effects of diet (P < 0·0001), time (P < 0·0001) and diet × time interaction (P < 0·0001). a,b At each time point, mean values with unlike letters were significantly different (P < 0·05). The values for Zn-deficient and pair-fed rats (lower lines) and values for marginally Zn-deficient and control rats (upper lines) are overlapping.
Body weight
The marginally Zn-deficient group had the same body weight (Fig. 4), weight gain and feed efficiency ratio (Table 1) as the control group throughout the study. The Zn-deficient group weighed 22, 40 and 50 % less than the control group at weeks 1, 2 and 3, respectively. Of the 35·8 g of total weight gained by the Zn-deficient rats, 25·5 g was gained during week 1 and only 10·3 g was gained during the remaining 2 weeks, while the marginally Zn-deficient and control groups gained 61·0 g in week 1, 56·5 g in week 2 and 54·2 g in week 3. The pair-fed animals weighed more than the Zn-deficient rats at each week due to more efficient conversion of feed into growth as indicated by a lower feed efficiency ratio.
Fig. 4 Weekly body weight of Zn-deficient (■), marginally Zn-deficient (▾), pair-fed (▲) and control (♦) rats. Values are means for eight rats per group, with their standard errors represented by vertical bars. There were significant main effects of diet (P < 0·0001), time (P < 0·0001) and diet × time interaction (P < 0·0001). a,b,c At each time point, mean values with unlike letters were significantly different (P < 0·05). The values for marginally Zn-deficient and control rats are overlapping.
Table 1 Feed intake and zinc status of zinc-deficient (ZD), marginally zinc-deficient (MZD), pair-fed (PF) and control rats*
(Mean values with their standard errors for eight rats per group)
a,b,c,d Mean values with unlike superscript letters were significantly different (P < 0·05).
* For details of diets and procedures, see Experimental methods.
† Feed efficiency ratio = total feed intake (g)/total weight gain (g).
Serum and femur zinc
Femur and serum Zn concentrations were reduced 78–83 % in the Zn-deficient and 38–40 % in the marginally Zn-deficient rats compared with the control rats (Table 1). Also, serum and femur Zn concentrations were 15 % lower in the pair-fed group compared with the control group.
Lymphoid organ weight
One of the classic characteristics of Zn deficiency is reduced lymphoid organ weight. The thymus and spleen weights of the Zn-deficient and pair-fed rats were not significantly different from each other, but they were 36–53 % lower than the marginally Zn-deficient and control animals (Tables 2 and 3). When the thymus and spleen weights were corrected for body weight, there were no differences among the dietary treatments.
Table 2 Thymus weight and proportion of thymocyte subsets from zinc-deficient (ZD), marginally zinc-deficient (MZD), pair-fed (PF) and control rats*†
(Mean values with their standard errors for eight rats per group)
a,b Mean values with unlike superscript letters were significantly different (P < 0·05).
* For details of diets and procedures, see Experimental methods.
† Pro-T cells identified as CD90+4− 8− , Pre-T cells identified as CD90+4+8+, cytotoxic identified as CD90+4− 8+ and helper identified as CD90+4+8− by flow cytometry.
Table 3 Spleen weight and T-cell subset numbers of zinc-deficient (ZD), marginally zinc-deficient (MZD), pair-fed (PF) and control rats*†
(Mean values with their standard errors for eight rats per group)
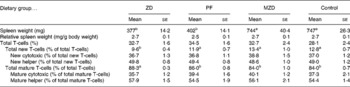
a,b Mean values with unlike superscript letters were significantly different (P < 0·05).
* For details of diets and procedures, see Experimental methods.
† Total T-cells identified as T-cell receptor (TCR) αβ+, total new T-cells identified as TCRαβ+CD90+, new cytotoxic identified as TCRαβ+CD90+4− 8+, new helper identified as TCRαβ+CD90+4+8− , total mature T-cells identified as TCRαβ+CD90− , mature cytotoxic identified as TCRαβ+CD90− 4− 8+ and mature helper identified as TCRαβ+CD90− 4+8− by flow cytometry.
Thymocyte subset proportions
There were no differences among the dietary treatment groups in the proportion of thymocyte subsets (pro, pre, cytotoxic and helper).
Splenocyte T-cell subset numbers
The Zn-deficient group had an 18–28 % lower proportion of splenic new T-cells and a 3–5 % higher proportion of mature T-cells compared with the pair-fed, marginally Zn-deficient and control groups (Table 3). Of the new and mature T-cells, there were no differences in the proportion of cytotoxic and helper T-cells among dietary treatment groups, therefore, both cytotoxic (CD8+) and helper (CD4+) lymphocytes contributed equally to the changes in the total new (CD90+) and mature (CD90− ) T-cell populations.
Serum corticosterone concentration
The Zn-deficient and pair-fed rats had a 14-fold higher serum corticosterone concentration compared with the marginally Zn-deficient and control rats (Fig. 5).
Fig. 5 Serum corticosterone concentrations of Zn-deficient (ZD), pair-fed (PF), marginally Zn-deficient (MZD) and control (CTL) rats. Values are means for eight rats per group, with their standard errors represented by vertical bars. a,b Mean values with unlike letters were significantly different (P < 0·05).
Cytokine concentrations after mitogenic stimulation
Mitogenic stimulation of thymocytes from the Zn-deficient, pair-fed and marginally Zn-deficient animals resulted in 33–54 % lower concentrations of IL-2 and IL-6 in cell-culture supernatant fractions compared with the control group (Fig. 6). There were no differences among the dietary treatment groups in the concentration of IFN-γ and IL-10 produced by thymocytes after stimulation.
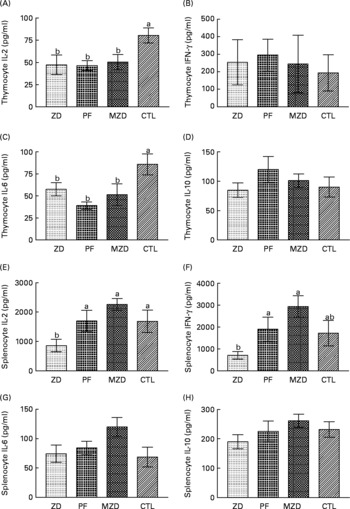
Fig. 6 Supernatant fraction cytokine concentrations from concanvalin A-stimulated thymocytes (A, B, C, D) and splenocytes (E, F, G, H) from Zn-deficient (ZD), pair-fed (PF), marginally Zn-deficient (MZD) and control (CTL) rats. Thymocytes and splenocytes were stimulated ex vivo with concanvalin A for 48 h and cytokine production was measured as described in Experimental methods. Values are means (n 7 for thymocytes; n 8 for splenocytes) with their standard errors represented by vertical bars, with the following exceptions where data points were removed because they were greater than three standard deviations from the mean: PF thymocyte IL-2, n 6 (value removed = 226·8); PF splenocyte IL-6, n 7 (value removed = 364·5). a,b Mean values with unlike letters were significantly different (P < 0·05). There were no differences among the dietary treatment groups in the unstimulated cytokine concentrations. Unstimulated thymocyte cytokine concentrations were as follows: IL-2 = 7·0 (se 1·3) pg/ml; IL-6 = 17·3 (se 4·2) pg/ml; IL-10 = 19·8 (se 2·4) pg/ml; interferon (IFN)-γ = 11·5 (se 3·0) pg/ml. Unstimulated splenocyte cytokine concentrations were as follows: IL-2 = 16·8 (se 1·7) pg/ml; IL-6 = 45·2 (se 4·7) pg/ml; IL-10 = 286·9 (se 14·3) pg/ml; IFN-γ = 5·5 (se 0·9) pg/ml.
Zn-deficient splenocytes produced 49–62 % less IL-2 compared with those from the pair-fed, marginally Zn-deficient and control rats, and 63–76 % less IFN-γ compared with the pair-fed and marginally Zn-deficient groups in response to ConA. IL-6 and IL-10 concentrations were not different among dietary treatment groups, and IL-10 concentrations from stimulated splenocytes were not different from unstimulated splenocytes.
Discussion
Researchers studying the effects of dietary Zn deficiency typically include a pair-fed group (identified as pair-fed in the present study) to separate out the effects of malnutrition from Zn deficiency. Because severe Zn deficiency in humans is rare, a marginally Zn-deficient group, which was fed a diet containing a third of the recommended dietary Zn, was also included in the present study. The marginally Zn-deficient group had reduced Zn status compared with both the control and pair-fed groups; however, it did not exhibit any signs of anorexia or impaired growth compared with the control group (Table 1, Fig. 3, Fig. 4). The pair-fed animals had stunting malnutrition similar to the Zn-deficient group; however, their Zn status was greater than both the Zn-deficient and marginally Zn-deficient rats. Therefore, the present study was able to examine the effects of reduced Zn status without malnutrition as well as being able to separate the effects of Zn status from malnutrition.
The major finding in the present study was that the altered mitogen-stimulated cytokine production ex vivo by thymocytes and splenocytes from Zn-deficient, pair-fed and marginally Zn-deficient rats does not follow the same pattern as serum corticosterone concentrations. The Zn-deficient and pair-fed group had higher serum corticosterone concentrations compared with the marginally Zn-deficient and control groups (Fig. 5); however, the Zn-deficient, pair-fed and marginally Zn-deficient groups had lower IL-2 and IL-6 cytokine production by ConA-stimulated thymocytes (not reported previously) while only the Zn-deficient group had lower IL-2 cytokine production by ConA-stimulated splenocytes compared with the control group (Fig. 6). Due to the inclusion of the pair-fed and marginally Zn-deficient groups, the present study was able to separate out the effects of elevated corticosterone concentrations from the effects of Zn deficiency. These results indicate that in vivo serum corticosterone concentrations do not appear to permanently ‘program’ ex vivo lymphocyte responses to ConA.
Thymocytes from the Zn-deficient, pair-fed and marginally Zn-deficient groups produced similar cytokine profiles (lower concentrations of IL-2 and IL-6 compared with the control group) (Fig. 5). The Zn-deficient, marginally Zn-deficient, and even the pair-fed group had lower Zn status (lower serum and femur Zn concentrations) compared with the control group; therefore, a possible interpretation of these results is that cytokine production by thymocytes is very sensitive to small changes in dietary Zn. In the periphery, IL-2 and IL-6 are identified as Th1 and Th2 cytokines, respectively, so it would appear that in the thymus there is not a shift in the Th1/Th2 balance. However, in the thymus, both IL-2 and IL-6 play a role in stimulating thymocyte proliferation and differentiation(Reference Yarilin and Belyakov8). Less IL-2 and IL-6 production indicates that thymocytes from the Zn-deficient, pair-fed and marginally Zn-deficient animals are receiving fewer signals to proliferate and differentiate compared with control, suggesting that thymocyte numbers should be negatively affected. In fact, blocking the IL-2 receptor in rat fetal thymus organ cultures results in 21 % fewer thymocytes(Reference Varas, Vicente, Romo and Zapata13) and IL-6-deficient mice have 20–40 % fewer thymocytes and peripheral T-cells(Reference Kopf, Baumann, Freer, Freudenberg, Lamers, Kishimoto, Zinkernagel, Bluethmann and Kohler14). On a per g basis, the Zn-deficient and pair-fed animals were able to maintain thymocyte numbers (data not shown) despite their cytokine profile, most probably because they are not growing as quickly as the marginally Zn-deficient and control rats. However, growth of the marginally Zn-deficient animals was similar to that of the control animals and yet the marginally Zn-deficient rats were able to maintain thymocyte numbers despite lower concentrations of IL-2 and IL-6 being produced. A possible explanation is that there is a redundancy in the function of these cytokines and other cytokines are able to maintain proliferation and differentiation when IL-2 and IL-6 concentrations are low(Reference Yarilin and Belyakov8).
Zn-deficient rats had a lower proportion of splenic new T-cells (both helper and cytotoxic) compared with the pair-fed, marginally Zn-deficient and control rats (Table 2). New T-cells are essential to ensure T-cell repertoire diversity(Reference Mackall, Hakim and Gress15), thus over time the Zn-deficient rat may become more vulnerable to infection. We have previously reported that Zn-deficient rats have a lower proportion of new T-cells (TCRαβ+CD90+); however, it was not clear whether the lower proportion was due to a lower number of new helper T-cells, a lower number of new cytotoxic T-cells or both(Reference Hosea, Rector and Taylor16). The present study builds on this previous work by reporting that there was a specific effect of severely reduced Zn status on the proportion of both new helper T-cells and new cytotoxic T-cells (Table 3). The production of new helper and new cytotoxic T-cells could also be adversely affected by thymulin (a hormone involved in thymocyte development), as in Zn deficiency there is insufficient Zn to sustain thymulin in its active form(Reference Dardenne, Savino, Wade, Kaiserlian, Lemonnier and Bach17).
Only Zn-deficient splenocytes produced less IL-2 compared with control, indicating a specific effect of severe Zn deficiency on peripheral T-cell cytokine production. These results support previous findings in Zn-deficient humans(Reference Beck, Prasad, Kaplan, Fitzgerald and Brewer18) and provide a possible explanation for the lower number of new peripheral T-cells. New T-cells respond to cytokine proliferation signals from IL-2 without any other stimulus and this response is lost as T-cells develop in the periphery(Reference Hassan and Reen19). This could explain why the new T-cells would be more vulnerable to low IL-2 concentrations than the mature T-cells, resulting in a lower proportion of the new T-cells but not the mature T-cells. IFN-γ pushes Th1 cells to produce their cytokines(Reference Mosmann and Sad4). A lack of a difference in splenocyte IL-2 production among the pair-fed, marginally Zn-deficient and control rats may be explained by the higher production of IFN-γ by the splenocytes in these groups compared with the Zn-deficient group. A report by Shi et al. (Reference Shi, Scott, Stevenson and Koski20) indicated that splenic T-cells from Zn-deficient mice that were infected by a parasite (Heligmosomoides polygyrus) produce less IL-4 and IL-5 (Th2 cyokines not examined in the present study) compared with control and pair-fed animals when exposed to the parasite antigen ex vivo, suggesting that Th2 cytokine production can also be lowered by Zn deficiency. Taken together, these studies suggest that there is not a preferential shift in cytokine production due to Zn deficiency; however, there is an overall decreased ability to respond to antigen in Zn deficiency and the shift in cytokine production may be reflecting whether the stimulus elicits a predominantly Th1 or Th2 response.
IL-6 is known as a glucocorticoid-increasing factor, which stimulates the hypothalamus–pituitary–adrenal axis to increase the release of corticotrophin-releasing hormone in the paraventricular nucleus of the hypothalamus, which stimulates secretion of pituitary adrenocorticotropic hormone which turns on the production of corticosterone in the adrenal gland(Reference Wang and Dunn21). IL-6 production by splenocytes was not affected by dietary treatment; therefore, the higher serum corticosterone concentration in the Zn-deficient and pair-fed groups compared with the marginally Zn-deficient and control groups cannot be explained by increased IL-6 production by splenocytes in these groups. A possible explanation for the lack of a difference in IL-6 cytokine production among dietary treatment groups could be that 48 h was not optimal to catch the peak production of each of the cytokines examined. In the present study, serum IL-6 was not measured; however, a previous study by our laboratory showed that plasma adrenocorticotropic hormone and serum TNFα concentrations (another glucocorticoid-increasing factor) were not altered in Zn-deficient or pair-fed groups compared with control(Reference Hosea, Rector and Taylor22); thus the signalling mechanisms for elevated serum corticosterone require further elucidation.
In summary, the present study indicates that severe Zn deficiency was associated with a lower proportion of both new cytotoxic T-cells and new helper T-cells in spleen as well as lower production of Th1 cytokines (IL-2, IFN-γ) but not Th2 cytokines (IL-6, IL-10) by stimulated splenocytes. Cytokine production (IL-2 and IL-6) by stimulated thymocytes was reduced in Zn-deficient, pair-fed and marginally Zn-deficient rats despite no alteration in thymocyte numbers relative to thymus weight. In vivo corticosterone concentrations were not associated with altered cytokine production ex vivo. The results also indicate that a mild reduction in Zn status (marginally Zn-deficient group) can alter cell function and that cell dysfunction can be detected before any phenotypic alterations occur. The present study demonstrates the value of including a marginally Zn-deficient group, a model that may be more clinically relevant than the Zn-deficient group that is frequently used in studies of this type.
Acknowledgements
There are no conflicts of interest. Funding to C. G. T. was provided by the Natural Sciences and Engineering Research Council of Canada. H. J. H. B. performed all the laboratory work, analysis of the data derived from the various experimental procedures, statistical analysis, wrote the manuscript and received feedback from the co-authors. E. S. R. operated the flow cytometer and acquired all of the flow cytometry data. C. G. T. provided intellectual guidance at all stages. We thank the staff of the Animal Holding Facility, Laura Burr, Jody Van Deynze and Lisa Rigaux for their assistance with animal care. We also thank Dr Keith Fowke, Department of Medical Microbiology at the University of Manitoba, his technician Steve Wayne, Dr Magdy Dawood from Cadham Provincial Public Health Laboratories and his technician Gerry Smart for allowing us access to the Luminex system.


