


The consumption of fruit has been linked to decreased risk of degenerative disease( Reference Bazzano, He and Ogden 1 , Reference He, Nowson and Lucas 2 ). Berries are known to contain a wide array of bioactive phytochemicals, and there has been a vast amount of research focusing on dark berries, and Blueberries (Vaccinium corymbosum) in particular, towards a health-related role( Reference McAnulty, Collier and Landram 3 , Reference Seeram 4 ). Although fruit intake is established as part of a healthy lifestyle, the actual intake of fruit still remains lower than UK government recommendations( Reference Albani, Butler and Traill 5 ). Different approaches are being sought to increase fruit consumption( Reference Ruxton 6 , Reference Kuntz, Rudloff and Asseburg 7 ); for example, juices and smoothies are increasingly popular products representing one portion of fruit per 150 ml drink for juice, and two for smoothies( Reference Ruxton 6 , Reference Kuntz, Rudloff and Asseburg 7 ). One issue with fruit juice is the higher content or bioavailability of sucrose released during processing( Reference Caswell 8 ), and this is thought to have detrimental health effects( Reference Khan and Sievenpiper 9 ). However, the processing of fruit into juices influences bioavailability of bioactive components in unknown ways.
Blueberries contain significant amounts of nutrients, such as vitamin K, vitamin C, folate, K, Mn, Cu and an array of phenolics that have been heavily researched in respect to their health benefits. For example, blueberries contain high amounts of flavonoids – the major class present being the anthocyanins. These compounds are responsible for the dark colourisation of the fruit and, importantly, have a major contribution towards the health benefits( Reference Manach, Mazur and Scalbert 10 , Reference Scalbert, Manach and Morand 11 ). Although consumption of anthocyanins can be in the range of 200 mg/d( Reference Zamora-Ros, Knaze and Lujan-Barroso 12 ), the bioavailability appears low as they are believed to be poorly absorbed and rapidly excreted( Reference Manach, Williamson and Morand 13 ). The relative bioavailability of blueberry bioactives has been investigated extensively in humans( Reference Kuntz, Rudloff and Asseburg 7 , Reference Bitsch, Janssen and Netzel 14 – Reference Keane, Bell and Lodge 17 ). Targeted analysis of bioactives reveals plasma concentrations of 0 to 4 micromolar from an approximately 50-mg dose with excretion ranging from 0·3 to 43 %( Reference Manach, Williamson and Morand 13 ). Studies have pointed to an approximately 1–2-h peak max in plasma( Reference Borges, Mullen and Mullan 18 – Reference Kay, Mazza and Holub 20 ), with a peak max in urine from 2 h( Reference Kay, Mazza and Holub 20 , Reference Kalt, Liu and McDonald 21 ), but metabolites can persist in urine for 5 d after consumption( Reference Kalt, Liu and McDonald 21 ). Although targeted studies on known bioactives are available, there remains a lack of studies using a non-targeted approach that aims to measure global differences between the range of metabolites present after consumption of either whole or processed blueberries.
Blueberries are commonly processed by juicing, canning, pureeing or being baked into other food items. Processing has been shown to influence the anthocyanin content of similar fruit( Reference Tomas, Toydemir and Boyacioglu 22 ). For example, the juice of mulberries was found to contain 60–70 % of the anthocyanin content of the unprocessed fruit( Reference Tomas, Toydemir and Boyacioglu 22 ), and the processing of tomatoes decreased the content of bioactives( Reference Kamiloglu, Demirci and Selen 23 ). A cell culture model of absorption has found that the food matrix influences the uptake of bioactives from processed and unprocessed fruit( Reference Toydemir, Boyacioglu and Capanoglu 24 ). A better understanding of the impact of processing is important to maximise the retention of phytochemicals from berries.
Metabolomics is now recognised as an important research tool in nutritional studies and has been used to investigate the influence of dietary patterns( Reference Primrose, Draper and Elsom 25 ) and single nutrients on metabolism( Reference Wong and Lodge 26 ). More recently, biomarkers of nutrient intake, including those for specific fruits( Reference Lloyd, Beckmann and Fave 27 ) and even carbohydrate( Reference Beckmann, Joosen and Clarke 28 ), were identified in metabolomics studies. As a more global approach, metabolomics offers the potential to investigate the relative appearance of a variety of species in biological fluids after ingestion of an amount of blueberries, including metabolites that have known bioactive properties, those with unknown function and even metabolites that have not yet been fully characterised. Targeted approaches, although very specific, are limited to relatively few preselected species and are usually more hypothesis testing. For this reason, the aim of this study was to use a non-targeted metabolite profiling approach to investigate the difference in the class of blueberry metabolites that appear in plasma and urine samples at a single time point (2 h) after the ingestion of either whole blueberries or blueberries that have been juiced.
Methods
Study design and protocol
This was a randomised acute two-way cross-over study to compare the relative bioavailability between consuming juiced blueberries v. whole blueberries in humans.
After recruitment, participants were randomised into their treatment arms to receive either whole or juiced blueberries first, using a web-based tool (Randomisation.com). Five subjects received the whole blueberry treatment first and four received the juiced berries. Participants were told to avoid consumption of all berries for a period of 5 d before study days, as this may compromise the results of the study.
The day before the study day, participants fasted overnight (no food after 20.00 hours the previous evening, only water to be consumed) and did not consume any foods or beverages before testing on each occasion. The participants visited the clinical nutrition unit according to a scheduled timetable. Participants were weighed (kg) using SECA scales and had their height (m) measured on their first visit. Participants first provided a blood and spot urine sample as described below. Next, participants were given their blueberry treatment, but no other food or drink was provided. Participants relaxed in the clinical unit for a 2-h duration after which they provided a second 2-h post-blood and spot urine collection. After these samples were collected, they were free to leave.
The washout period used was 7 d, based on previous observations( Reference Serafini, Testa and Villano 29 ), after which the participant underwent the same testing methods with the other treatment arm, and during this washout period participants were instructed again not to consume any berries as part of the exclusion criteria.
This study was conducted according to the guidelines laid down in the Declaration of Helsinki, and all procedures involving human subjects/patients were approved by the Department of Applied Sciences Ethical Committee, reference RE120612950. Written informed consent was obtained from all participants.
Subjects and sample size
The non-targeted metabolite profiling used in this study involves identifying an unknown number of species with unknown inter-individual variation from complex high-dimensional data, with no effect size, and therefore it is not straightforward to perform a sample size calculation( Reference Nyamundanda, Gormley and Fan 30 ). Furthermore, no standard methods for determination of sample size in metabolomic studies are available( Reference Nyamundanda, Gormley and Fan 30 ). For discriminant analysis methods, such as partial least-squared discriminant analysis (PLS-DA), which rely on data reduction into vectors of covariance or principal components, you need at least the same number of samples as the number of relevant principal components. For most data, the first eight to ten principal components contain most of the variance; hence, this would be an absolute minimum. Initially, we aimed for twelve participants, and this sample size has been used in a number of studies aimed at blueberry bioactive bioavailability( Reference Kuntz, Rudloff and Asseburg 7 , Reference Aschoff, Rolke and Breusing 31 , Reference Rock, Lovalvo and Emenhiser 32 ). Two subjects withdrew before the study began, and a further subject withdrew after the first treatment arm, so full data were obtained from nine participants.
The participants were healthy males and females aged between 18 and 35 years. Participants were excluded if they had a history of repeated illness, GI problems, high or low blood pressure, a diagnosed illness, if they were currently taking prescribed medication or supplements and were pregnant or were currently trying to conceive.
Blueberry preparation
Blueberries were purchased from a local supermarket the day before the study day. All procedures were standardised to ensure that all samples underwent the same processing technique, which resulted in an identical final product. The blueberries were washed and weighed into 250-g portions using a digital scale, and stored refrigerated overnight (4°C). For the juiced blueberry treatment, individual 250-g portions were gradually added to a juicer, and once all the blueberries were added the blueberries were juiced using a Primra juice extractor for 60 s. The remnants from the juiced berries were squeezed through a muslin cloth into a measuring beaker. The blueberry juice was poured into a sealable bottle (per participant) ready for consumption, and stored in the refrigerator at 4°C overnight. No other treatment was applied to the 250-g portion of whole blueberries.
On the study day, each participant received 250 g of fresh blueberries either in the whole or juiced form. They were told to consume the treatment within 5 min, and no other food and drink was allowed for the duration of the sample collection period (2 h).
Spot urine collection and preparation
A urine sample (no preservatives added) was taken from each participant on two occasions: at baseline before berry consumption and 2 h after berry consumption. These were spot urine collections with no collection window, and this approach has previously been shown to be robust for nutritional metabolomic studies( Reference Fave, Beckmann and Lloyd 33 ). Urinations outside of these times were not collected, and the first morning void collection was avoided. An aliquot (10 ml) was transferred to a storage tube where it was sealed, immediately frozen and stored at −20° before analysis.
Blood collection and preparation
A blood sample (20 ml, heparinised) was taken from each of the participants on two occasions: at baseline before berry consumption and 2 h after berry consumption. The baseline sample was fasted. After collection of all samples, the blood was centrifuged for 20 min at 3500 rpm at 10°. Once the sample had been spun, the separated plasma was aliquoted into storage tubes, immediately frozen and stored at −20° before analysis.
Biological sample processing
In brief, plasma (200 μl) was extracted with 800 μl of pre-chilled LCMS-grade methanol (Fisher Scientific) through three series of vortex-mixing, and then centrifuged for 2 min at 4°C and 13 000 rpm (Biofuge Fresco; Hareaus). For LCMS, 500 μl of the supernatant was dried and reconstituted into 500 µl of mobile phase and transferred to a glass sample vial. Urine samples (50 μl) were diluted with 450 μl of pre-chilled methanol–water (4:1), vortexed and centrifuged as for plasma, and the supernatant was transferred to glass sample vials for analysis.
LCMS analysis
Urine and plasma samples were analysed separately in randomised batches. In brief, LC–MS analyses were carried out on a Dionex UltiMate 3000 RSLC HPLC System (Dionex), equipped with an UltiMate 3000 RS pump, an UltiMate 3000 RS autosampler and a QExactive Quadrupole-Orbitrap Mass Spectrometer (Thermo Fisher Scientific). Electrospray ionisation at both negative and positive ion modes was performed with a spray voltage of 2·00 kV and capillary temperature of 280°C. The total ion current with a range of 50–1000 m/z and 70 000 resolution was measured. Sample aliquots (2 µl) were injected on an Accucore (Thermo Fisher) C18 (150×2·5 mm, 5-μm particle size) reverse-phase column, thermostatically regulated at 40°C. The mobile phase consisted of water with 0·1 % formic acid (solvent A) and acetonitrile with 0·1 % formic acid (solvent B). Starting conditions were 95 % A, and compounds were separated with a gradient of 95 % A to 5 % A over 18 min, with a 5-min wash cycle before being re-equilibrated to 95 % A; flow rate was 0·35 ml/min. All samples were randomised in their running order, and a quality-control sample was analysed on ten occasions throughout the batch. The quality-control was a pool of all samples in a single aliquot.
Data processing and mining
LCMS data were processed using the software Progenesis QI (Waters), which incorporates chromatographic alignment, peak picking, statistical analysis and putative identification based on accurate mass. After alignment, profiles were normalised to all compounds detected, using the quality control as a reference. The data set was subjected to unsupervised and supervised multivariate classification using principal components analysis (PCA) and PLS-DA, respectively, using SIMCA version 14.0 (UMetrics). PCA was used to visualise associations in the data and to identify any outliers, whereas PLS-DA models were constructed to identify associations in the data based on sample group. For further statistical analysis, features were subjected to comparison of means analysis, depending on the study design, and P values were corrected for false discovery rate (q values are shown). PLS-DA models comprised either four groups (pre-whole, pre-juice and post-whole and post-juice) or two groups (post-whole and post-juice). R2Y and Q2 were used to provide metrics of discrimination and classification. For all statistical analysis, the two-sided significance level used was 0·05. For data filtering purposes, features with P>0·05 were removed from the data set before the two-component model construction. Permutation tests were performed to assess validity and overfitting of models. Internal cross-validation methods using a predictive and training set from the data with seven iterations were used to determine classification uncertainties (SIMCA version 14.0). Variable Importance in Projection (VIP) plots were used to highlight the importance of each variable (ion) in the model using a threshold of >1·9. Those features that were highlighted as discriminatory between whole and juiced blueberries were then processed further for putative annotation using Progenesis Metascope software that utilises several metabolite databases (e.g. HMDB, Metlin, KEGG) and searches for matches based on m/z and isotope ratio using the accurate mass data.
Results
Subjects
The nine subjects who completed both arms of the trial had an average age of 23 (sd 3) years, and an average BMI of 23 (sd 2) kg/m2. Their lipid status was normal (cholesterol 4·3 (sd 1·1) mmol/l; TAG 0·7 (sd 0·3) mmol/l). The sex distribution was five males and four females.
Filtering of metabolomic data
To check for sample outliers, data were analysed by principal component analysis to visualise the variation between samples; no outliers were identified or removed (online Supplementary Figs S1–S3). PCA also revealed that quality-control samples were clustered closely together towards the centre of the axis, indicating low analytical variation (online Supplementary Fig. S1). Analysis resulted in a large number of features in both plasma and urinary analysis, and the vast majority of these were not significantly different between sample groups (P>0·05) or were anomalies and false positives. Applying a filter to remove features that were not significantly different between treatment removed approx. 94 % in urine samples and 88 % in plasma samples (Table 1). The number of features significantly influenced by blueberry treatment ranged from 455 in urine in positive mode to 1004 in urine in negative mode (Table 1). Overall, urine in negative ionisation mode was found to be the most informative as we found 193 features that were higher at the 2-h time point, of which 157 features were higher after the whole blueberry treatment and thirty-six after the juiced blueberry treatment. This pattern was also found for urine in positive mode. In plasma, fewer overall features were found 2 h after treatment: twenty-nine in positive mode and thirty-one in negative mode. Comparing post-whole v. post-juice samples in a pairwise manner, a lower number of ions were significantly different; in positive ion mode, seventy-one features were increased in urine after whole fruit treatment compared with juiced in which only one was higher in intensity (Table 1). Over 7-fold (positive mode) and 4-fold (negative mode)-higher number of ions were present after whole blueberry intake rather than the juice in the urinary metabolome, and there was a relatively similar number of ions following either treatment in the plasma metabolome.
Table 1 Number of ion features in the intervention
* Ion features that were significantly different from univariate analysis of post-treatment groups only.
Discrimination between treatments
The full sample list with all variables (following removal of false positives and anomalies) was used when constructing the four-component PLS-DA models to determine whether the samples could be discriminated by treatment. Permutation plots revealed a negative Q2 intercept showing the models were valid (urine negative −0·30 and −0·27; urine positive −0·61 and −0·54; plasma negative −0·09 and −0·16; plasma positive −0·27 and −0·1; online Supplementary Fig. 4). A representative score plot for urine samples using negative ionisation mode is shown in Fig. 1. Although some visual differences were observed, PLS-DA demonstrated only weak discriminating models in all the data sets (R2Y and Q2 <0·5), and therefore weak discriminating ability between treatment (Table 2). Nevertheless, it is noticeable that samples taken before the treatment (pre) clustered together and lie apart from samples taken after treatment. Power analysis of these models revealed that a high percentage of species had power >0·8 in urine samples, but it was lower for plasma samples. As we are interested in the ion species discriminating between whole and juiced treatments, we constructed PLS-DA models of post-treatment samples only, and score plots of these models are provided (online Supplementary Fig. S5). This resulted in high discriminating ability in urine samples, especially with a high percentage of correct classifications (Table 2 and Supplementary information, Table 1). However, these two component models had low power in comparison. To determine which ions were responsible for discrimination between treatments, loadings and VIP plots were generated for each treatment. Fig. 2 shows a representative example of a PLS-DA loadings plot with associated VIP plot (urine data, negative mode). This resulted in a shortlist of ions for each sample set that were followed further for further pairwise statistical analysis of post-samples and putative identification. The top species from the VIP data for both urine and plasma (threshold >1·9) are shown in Table 3 with P values corrected for false discovery rate (q values). This table shows statistical analysis of the ion intensities between treatments (all sample groups) and pairwise analysis of post-whole v. post-juice, and highlight that although the ion intensities maybe be significantly different between all sample groups there was sometimes no statistical difference between post-samples only.
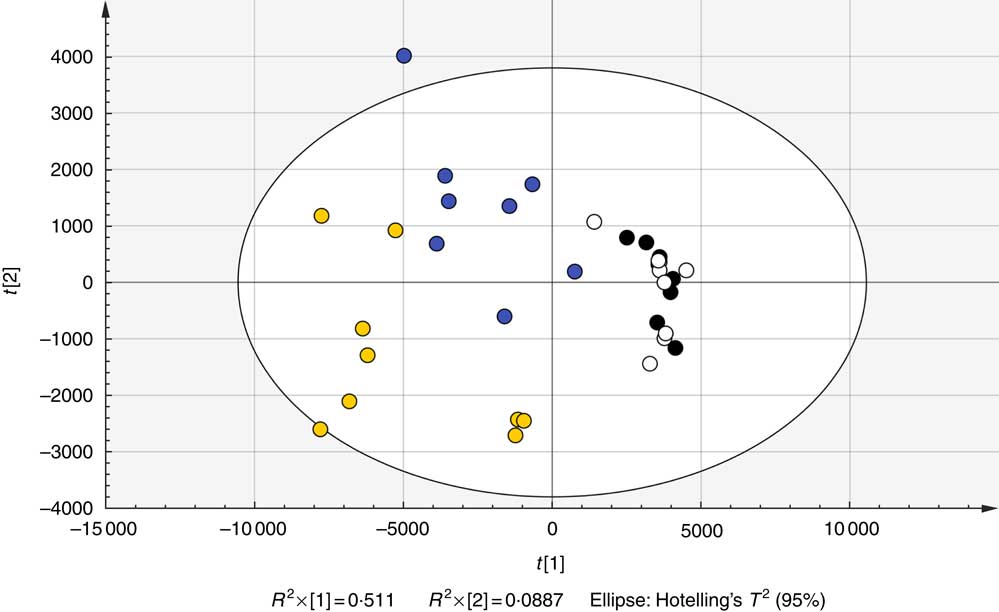
Fig. 1 Representative partial least-squared discriminant analysis score plot of urine samples taken both before and after treatment with whole and juiced blueberries obtained in negative ion mode. Parameters are shown in Table 2. ![]() , Post-whole;
, Post-whole; ![]() , post-juice;
, post-juice; ![]() , pre-whole;
, pre-whole; ![]() , pre-juice.
, pre-juice.
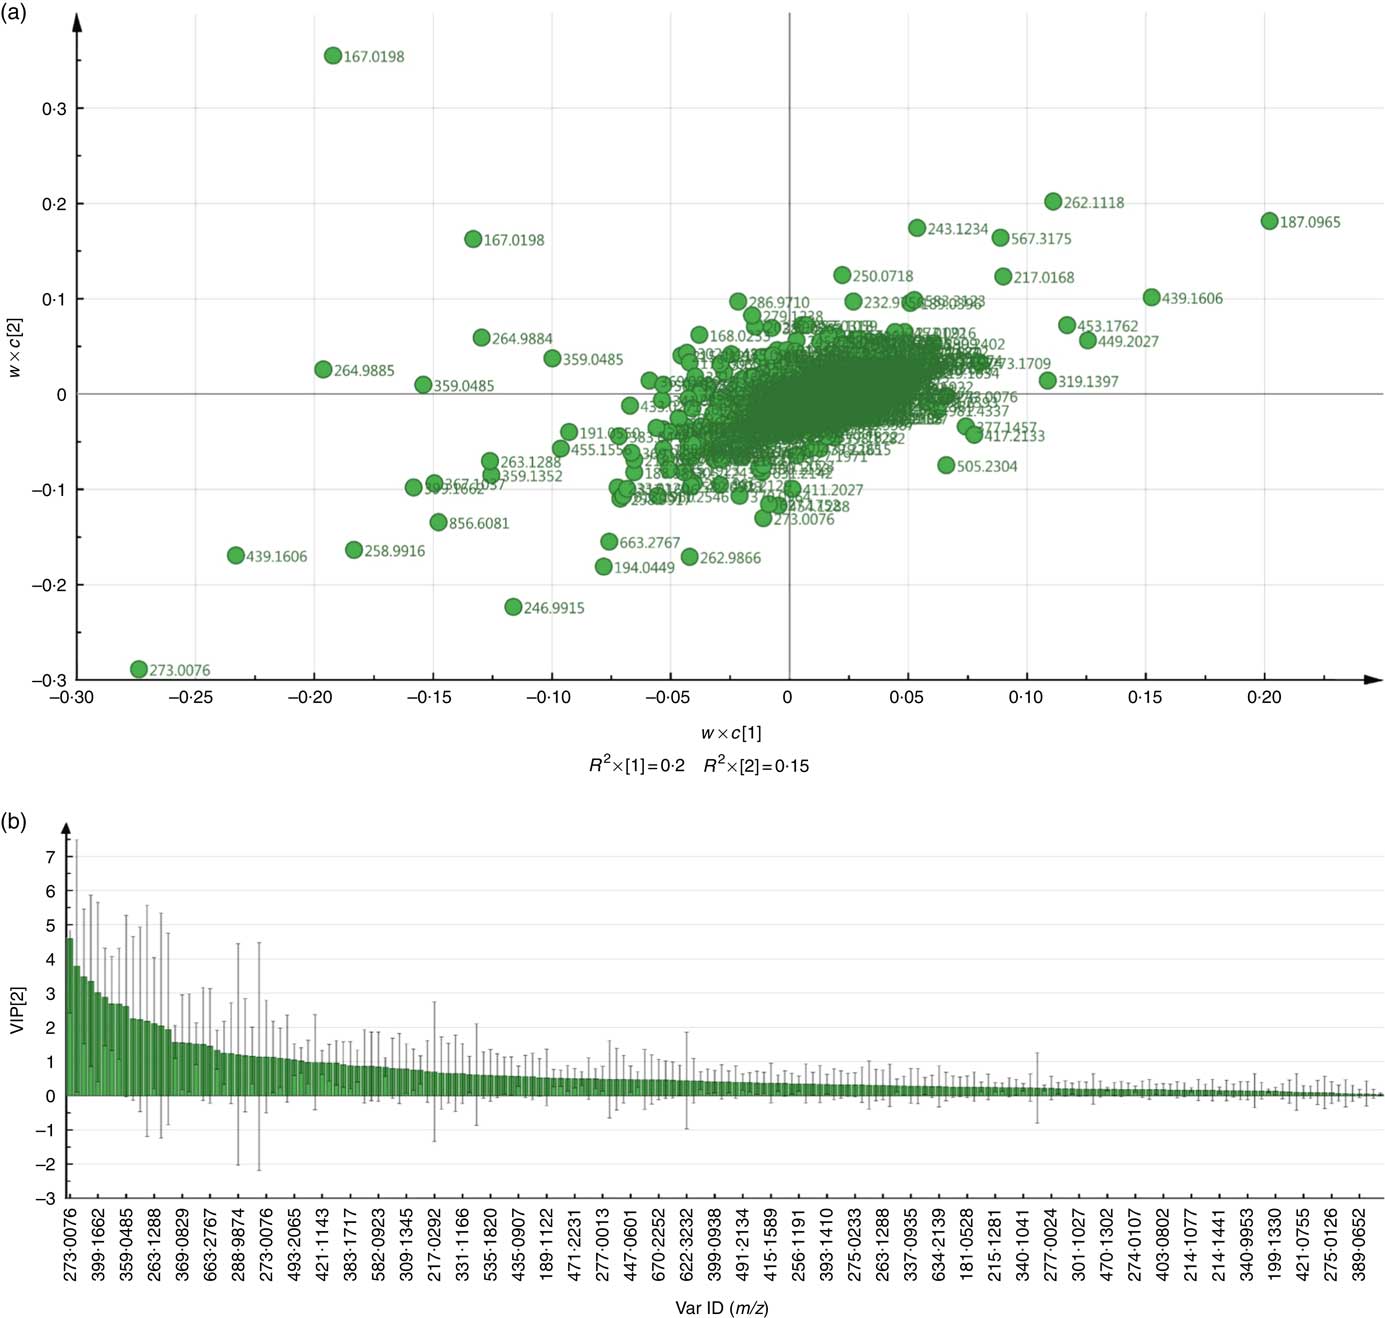
Fig. 2 Representative partial least-squared discriminant analysis (PLS-DA, (a)) loadings plot and Variable Importance in Projection (VIP, (b)) plot of urine samples comparing post-whole and post-juice treatments obtained in negative ionisation mode.
Table 2 Partial least-squared discriminant analysis (PLS-DA) model parameters
* Average value for classification of sample groups.
† Percentage of species with power >0·8.
Table 3 Top discriminatory ion species in biological samples from Variable Importance in Projection (VIP) data
Intensity profiles
To verify those features that are only increased by treatment, we investigated the abundance profiles for each ion feature. Examples of these for urine samples in negative ionisation mode are shown in Fig. 3. Certain metabolites have increased intensity either after whole or after juiced treatment. Inter-individual differences in response are also seen; responses differ by a factor of 10, and this was found to be consistent within an individual. Differential behaviour between ion species is also shown in the fold difference data in Table 3 for the top discriminatory ions. The majority of signals that were increased after ingestion were present in baseline samples and then were increased after ingestion of either treatment, and the differences between treatment were highly significant (Table 3). No signals were found that were only present in samples after either whole or juiced blueberries. Examples of highly discriminating ion intensities from VIP data following either whole or juiced blueberries from both urine and plasma samples are shown in Fig. 4.
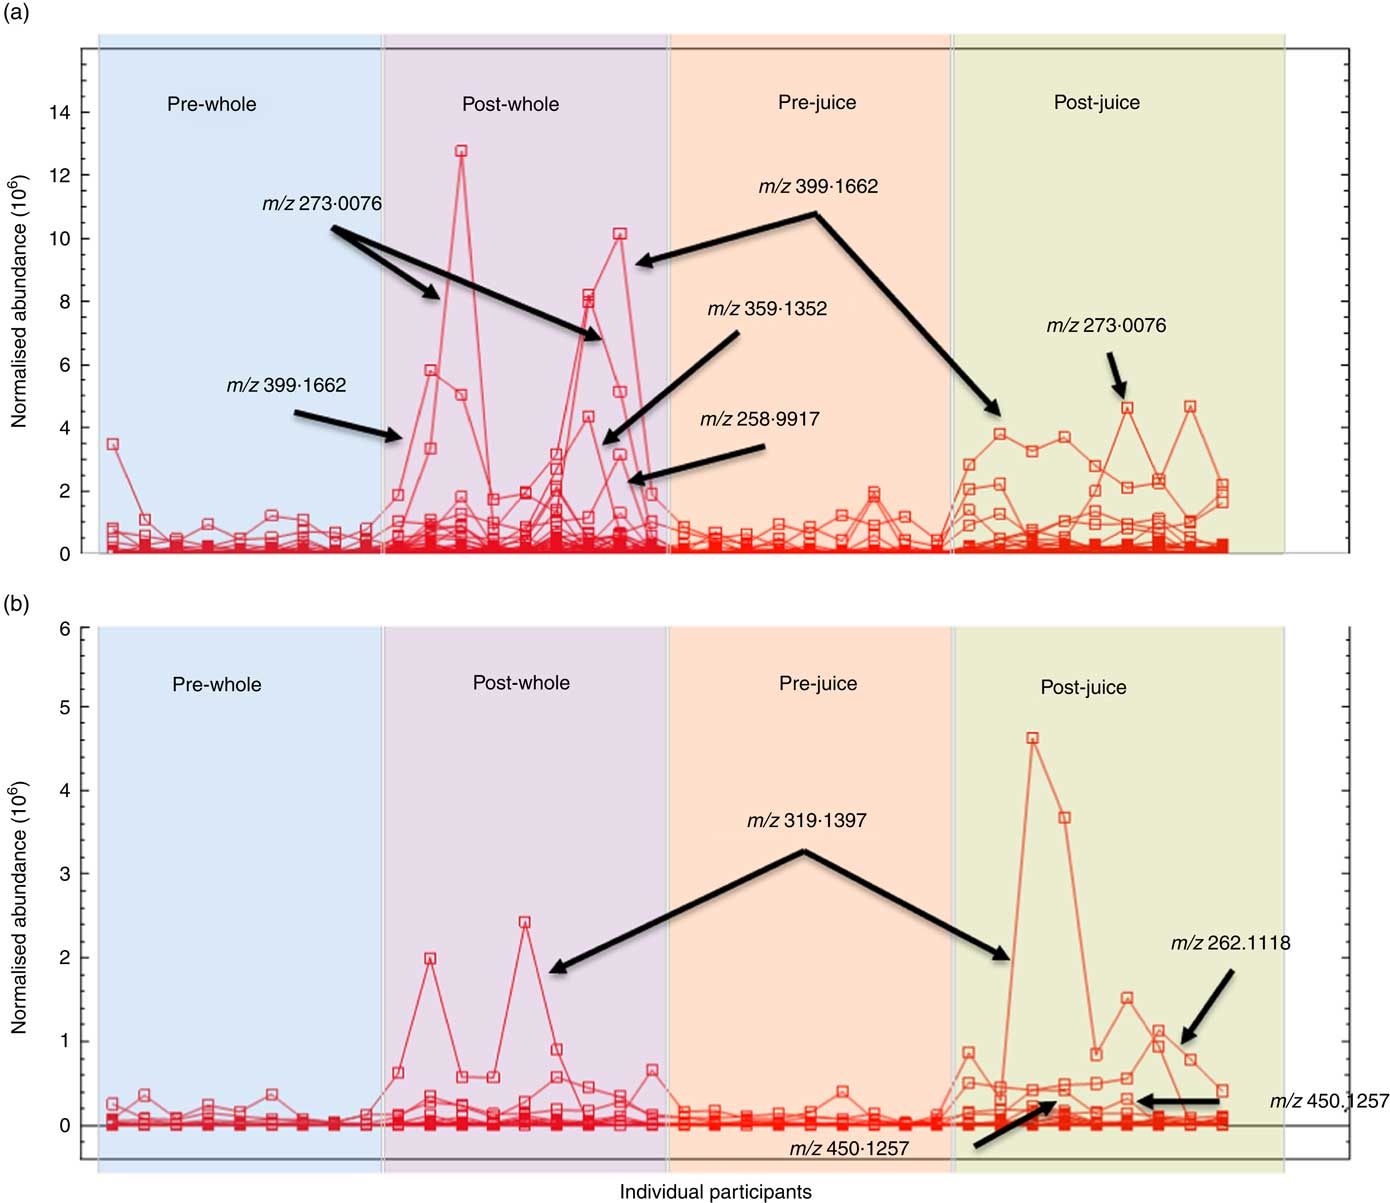
Fig. 3 Individual profiles of negative ions covering a range of intensities in urine samples after treatment with either whole or juiced blueberries. Metabolites filtered to show those with the highest intensities after (a) whole and (b) juiced blueberries.
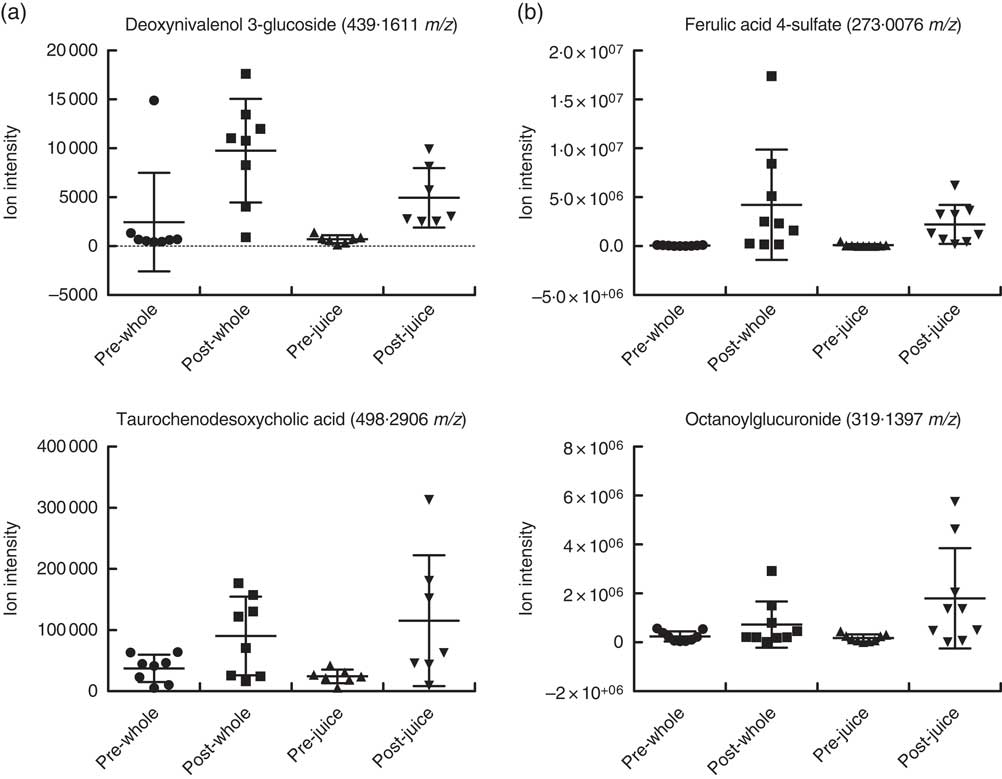
Fig. 4 Individual graphs of ions that differ between whole and juiced berry consumption in plasma (a) and urine (b) samples. Example profiles are given for selected ions that are higher intensity following either whole or juiced blueberry intake and in negative mode ionisation. Individual data are shown with means and standard deviations.
Annotation of discriminatory features
Ion spectra were processed using Progenesis Metascope software, and potential matches are shown in Tables 3 and 4. Although these annotations remain putative and are not confirmed, they are based on high-resolution data (70 000) and closest match (<5 parts per million (ppm)). The majority of annotated species were found in urine from negative ionisation data; plasma offered fewer annotations. Many assignments were of flavonoids and associated metabolic products – for example, caffeic acid, abscisic acid, ferulic acid, citbrasine and lucuminic acid. It is noticeable that on occasion the same metabolite was found in both plasma and urine following the same treatment (e.g. caffeic acid and ferulic acid metabolites). Metabolites conjugated to glycosides, sulphates and glucuronides were abundant in urine and plasma after ingestion of whole blueberries. Some of the putative annotations were lipid related, and found mainly in plasma.
Table 4 Putative metabolite annotation after each treatment and for each ionisation modeFootnote *
* Based on closest m/z match where found.
Discussion
We are continually reminded of the health benefits of consuming more fruit. One consumer-friendly strategy to increase fruit consumption is through juices and smoothies( Reference Ruxton 6 ). However, the juicing process can influence the nutritional value of fruit; for example, the content of fibre in juices is negligible compared with whole fruit or smoothies( Reference Ruxton 6 ), and research has suggested that the content of certain bioactives is lower in juices( Reference Kamiloglu, Demirci and Selen 23 ). Processing can occasionally increase the bioavailability of bioactives( Reference Porrini, Riso and Testolin 34 ). Nevertheless, a systematic review has demonstrated that the intake of fruit and vegetable juice offered similar health benefits to the intake of whole fruit and vegetables( Reference Ruxton, Gardner and Walker 35 ), and thus a similar proportion of bioactive phytochemicals must remain in the processed products. Juices and whole fruit contain a similar content of sugars; although the juicing process can ‘free’ the naturally occurring sugars( Reference Caswell 8 ), a study has shown that whole and juiced fruits release similar amounts of fruit acids and sugars into the mouth( Reference Beighton, Brailsford and Gilbert 36 ), and consumption of fruit juices is not associated with weight status in children( Reference Nicklas, O’Neil and Kleinman 37 ).
The aim of this study was to use a more global view of the appearance of blueberry metabolites into biological fluids after the consumption of whole or juiced fruit using a metabolite profiling approach. We show here that consumption of either whole or juiced blueberries influences the plasma and urinary metabolome 2 h after consumption. Whole blueberry consumption resulted in a 4- to 7-fold-higher number of features appearing in the urine and plasma than juiced blueberry consumption. The majority of features detected (>90 %) were not influenced by blueberry consumption, and out of the features that were influenced (approx. 1000) only 3–19 % were significantly increased after blueberry treatment (plasma or urine, respectively). The low proportion of features influenced by the intervention suggests that processing of blueberries into a juice does not have a great effect on the bio-accessibility of metabolites in the time frame studied, but we appreciate that using one time point is a major limitation. Our study used a profiling approach as it can highlight global differences between the delivery of the fruit that more specific targeted approaches cannot. We found spot urine samples to be more information-rich than plasma samples. Spot urine samples are being increasingly used in nutritional metabolomic studies( Reference Lloyd, Beckmann and Fave 27 , Reference Beckmann, Joosen and Clarke 28 , Reference Rothwell, Fillatre and Martin 38 , Reference Garcia-Aloy, Llorach and Urpi-Sarda 39 ) as they appear to be representative of timed collections, and are robust and reproducible( Reference Fave, Beckmann and Lloyd 33 , Reference Beckmann, Lloyd and Haldar 40 , Reference Lloyd, Fave and Beckmann 41 ). Spot collections avoid the necessity for collecting large volumes of urine that may deteriorate over the collection time and are very reflective of dietary exposure( Reference Fave, Beckmann and Lloyd 33 , Reference Beckmann, Lloyd and Haldar 40 , Reference Lloyd, Fave and Beckmann 41 ). Therefore, spot urines were used in the current study.
PLS-DA models of all treatment groups in both plasma and urine were poor and lacked good discriminating ability. The samples from both pre-treatments clustered together, implying a similarity of their metabolic profiles; this highlights that even in the absence of a dietary control the variation in metabolite profiles was limited and did not influence the impact of the blueberry treatment. Importantly, when comparing whole v. juiced profiles, there was good discriminating ability, highlighting that each treatment caused differential changes to each metabolome after 2 h. Permutation tests showed the validity of all models, as overfitting can be an issue when analysing data containing thousands of variables. Even so, the number of species that had good power (>0·8) was relatively low. When pairwise analysis was performed on post-treatments only, fewer species were significantly different (Table 3). For example, out of 455 features in urine that were significantly influenced by the intervention, only one ion was significantly higher following juice than whole blueberry treatment in positive ion mode, whereas seventy-one features were significantly higher after whole blueberry treatment.
Blueberries are rich in both anthocyanins (approximately 92 mg/100 g) and phenolic acids (approximately 31 mg/100 g)( Reference Serafini, Testa and Villano 29 ). The major anthocyanin components (out of a total fourteen anthocyanin species, approximately) are malvidin-3-O-arabinoside and the 3-O-galactosides of cyanidin, dephinidin, petinidin and malvidin( Reference Del Rio, Borges and Crozier 42 ). The major phenolic acids in blueberries are chlorogenic, cumaric and ferulic acid, and quercetin (a flavonol). Furthermore, a wide array of compounds are formed following ingestion of blueberries; anthocyanin metabolites, in the form of their glucuronide, sulphate and glycoside derivates( Reference Borges, Mullen and Mullan 18 – Reference Kay, Mazza and Holub 20 ) formed during phase 2 metabolism, are present in large diversity and intensity( Reference Kalt, Liu and McDonald 21 ). Some of the known blueberry bioactives were found in the current study. For example, the sulphate and glucuronide derivatives of ferulic acid, caffeic acid and quercetin were of significantly higher intensity in both urine and plasma after treatment with blueberries. These are all structurally related and have antioxidant properties. Previous work has also shown that such conjugates are commonly observed after consumption of anthocyanins( Reference Kay, Mazza and Holub 20 , Reference Pimpao, Dew and Figueira 43 , Reference Pimpao, Ventura and Ferreira 44 ). Furthermore, these compounds were among the highly ranked species that differed between sample treatment (Tables 3 and 4). Indeed, ferulic acid 4-sulphate and corcoinoside B were found in the highest abundance following whole blueberry ingestion. Ferulic acid sulphate is a hydroxycinnamic acid, and the sulphate derivative has been demonstrated previously as a major metabolite found after consumption of a fruit puree within a similar time frame( Reference Pimpao, Ventura and Ferreira 44 ). Corchoionoside B is a terpine glycoside predominant in green vegetables, but research on health-relating properties is limited, and there have been no previous reports of corchoionosides being a predominant metabolite of fruit such as blueberries.
The metabolites that were higher in intensity following whole blueberry intake were a combination of phenolic metabolites, glucosides and glucuronides, and fatty acyl derivatives, whereas those that were higher from the juiced treatment did not appear to follow such a pattern and included citibrasine (an alkaloid), theogallin (related to chlorogenic acid) and citrusin E (phenolic glycoside). Octanoylglucuronide (shown in Fig. 4) was the predominant metabolite found in urine after juiced blueberries treatment. It is likely that this is an endogenous metabolite formed through metabolism of octanoic acid and the reasons for this being excreted following juiced blueberries are unknown. Interestingly, we previously found a series of fatty acid derivatives that were positively correlated with sucrose intake( Reference Beckmann, Joosen and Clarke 28 ), and it is tempting to speculate that this could be owing to the increased availability of sugars in the juice. There were a number of acyl derivates after blueberry consumption found here, presumably a consequence of endogenous metabolism. A mixture of exogenous and endogenous metabolites has been previously observed in a metabolomic approach to cranberry juice consumption( Reference Liu, Garrett and Su 45 ).
The differences in bioavailability of bioactives after processing as opposed to unprocessed fruit is poorly understood. The food matrix itself is an important determinant for bio-accessibility( Reference Sensoy 46 ). With blueberries, the most valuable part, in terms of anthocyanins, is the outer layer of skin( Reference Michalska and Lysiak 47 ), and this is removed in the juicing process. Fibre, an important dietary component with positive health benefits, is also removed through juicing, and fibre is thought to interact with phytochemicals and either reduce or improve their bioavailability( Reference Palafox-Carlos, Ayala-Zavala and Gonzalez-Aguilar 48 ), and fibre will decrease stomach transit times. Therefore, interactions between matrix components and bioactives is dependent on the type of metabolite. Juicing would be expected to exert a large effect on bioavailability and transit times, and these are reflective of the digestion process and the release of metabolites from the matrix and subsequent absorption. Furthermore, transit times are quicker for liquid than solid meals( Reference Bennink, Peeters and Van den Maegdenbergh 49 ), and these differences need to be taken into account when interpreting the results. We found here that the difference between treatments was not as significant as expected, with only approximately 15 % of metabolites being higher after whole compared with juiced (approximately 3 %) blueberries, and the same array of metabolites were observed at the 2-h time point. Evidence from the literature using more targeted approaches has been quite contradictory. For example, Kuntz et al.( Reference Kuntz, Rudloff and Asseburg 7 ) compared the bioavailability of selected anthocyanins from grape/blueberry juice with a smoothie and found no difference in plasma pharmacokinetics and recovery of the major anthocyanin species, but found significantly higher concentrations of the phenolic acid 3,4-dihydrobenzoic acid after ingestion of the juice( Reference Kuntz, Rudloff and Asseburg 7 ). In a cellular model, cherry anthocyanins were transported three times more efficiently from a processed nectar than from whole fruit( Reference Toydemir, Boyacioglu and Capanoglu 24 ). In a human bioavailability study in ileostomy patients, significantly more polyphenols reached the bags when a smoothie was ingested v. a juice, indicating that the matrix plays an important role in the availability of fruit bioactives( Reference Hagl, Deusser and Soyalan 50 ). In a study comparing the effects of four processed apple products on the plasma metabolome, it was found that whole apples had a stronger modifying effect on the metabolome than other treatments, including apple juice( Reference Rago, Guerdeniz and Ravn-Haren 51 ). The current study also supports the notion that the matrix has an important influence on the bioavailability of bioactives. We found no examples of features that only appeared after either whole or juiced treatments; features were generally present after both treatments with varying intensities.
The process of juicing itself is thought to decrease the content of anthocyanins and metabolites in blueberries. One study suggested that approximately 15 % of monomeric anthocyanins can be lost after blueberry pressing into juice( Reference Brownmiller, Howard and Prior 52 ), whereas losses of up to 55 % during pressing to juice have been reported( Reference Lee, Durst and Wrolstad 53 ). When juices are prepared using common domestic appliances, such as the juice used in the current study, there could be a reduction in flavonoid content as many flavonols and anthocyanins are concentrated in the skin( Reference Manach, Williamson and Morand 13 ). One would expect that altering the food samples by breaking up the matrix would increase bioavailability, and in some instances this is indeed correct. In the present study, there were many hundreds of signals that were similar between treatments, and as such we can assume that the juicing process itself had minimal degrading effects on global blueberry metabolites before ingestion.
The current study has a number of limitations. The major limitation that has consequences on the overall impact of the study is that only a single time point (2 h) was used to compare the difference between treatments. Therefore, we cannot comment on total bioavailability or other biokinetic parameters. This time point has been shown to represent the approximate T max for a number of expected metabolites( Reference Del Rio, Borges and Crozier 42 , Reference Feliciano, Boeres and Massacessi 54 ), and hence was chosen judiciously. Maximal plasma concentrations of fruit polyphenols appear between 0·7 and 4 h post-ingestion, whereas urinary excretion, typically comprising 0·03–1 % of the ingested dose, peak between 1 and 4 h, with a half-life of 0–2 h( Reference Borges, Mullen and Mullan 18 – Reference Kalt, Liu and McDonald 21 ). In an extensive study of cranberry metabolite bioavailability, it was found that flavonol metabolites, as well as benzoic acids and cinnamates, appeared in the plasma at 1–2 h after consumption, whereas phenylacetic acids, catechols, hippuric and analogues of cinnamic acid appeared later, after 4 h( Reference Feliciano, Boeres and Massacessi 54 ). Many of the metabolites found in the present study have been shown to have a T max of between 0·5 and 2 h, such as caffeic acid, ferulic acid derivatives and quercetin( Reference Del Rio, Borges and Crozier 42 , Reference Feliciano, Boeres and Massacessi 54 ). Similar results were found with the appearance of anthocyanin metabolites after consumption of aronia berries( Reference Xie, Lee and Vance 55 ) and bilberries( Reference Sakakibara, Ichikawa and Tajima 56 ), with T max ranging from 1 to 6 h. As processing the blueberries into a juice could also influence bio-accessibility in biological fluids, a single time point gives no information on kinetics of absorption and appearance. Indeed, several studies have shown differences in bioavailability in processed fruit in targeted studies( Reference Kuntz, Rudloff and Asseburg 7 , Reference Toydemir, Boyacioglu and Capanoglu 24 , Reference Hagl, Deusser and Soyalan 50 ). Although spot urine collections are useful approaches for metabolomic studies, when collecting a limited number of time points, as in the current study, then collection windows may be more appropriate for investigating the influence of an external factor.
The metabolite annotations provided here are putative and were not confirmed against known standards. It was beyond the scope of the current investigation to identify all the metabolites differing between treatments. Our MS-based analysis used a high resolution of 70 000, and the data we have provided represent the best matches within a relatively small threshold of mass accuracy (<5 ppm). Furthermore, the metabolite annotations included several species that would be expected to be found after consumption of blueberries – for example, phenolic acid metabolites (Table 4).
In conclusion, we have shown that a metabolite profiling approach can be used to globally compare the appearance of blueberry metabolites after consumption of either whole or juiced fruit. This study demonstrates the potential for information-rich techniques in this area. We have shown that consuming whole blueberries resulted in higher intensity of phenolic metabolites when compared with ingestion of juiced blueberries, although only the 2-h time point was used. The differences in overall metabolite profiles of plasma and urine after either whole or juiced blueberry consumption were relatively minor.
Acknowledgements
The authors thank the volunteers who participated in the study.
The work was funded through internal sources from Northumbria University.
J. K. L. was the principal investigator, and he designed and directed the study. A. K. co-ordinated the study from recruitment to sample collection. S. L. analysed the samples. J. K. L. wrote the manuscript, and all authors checked the manuscript.
The authors declare that there are no conflicts of interest.
Supplementary material
For supplementary material/s referred to in this article, please visit https://doi.org/10.1017/S0007114518000855


