


Cognitive function in dogs, like that of other mammals, declines over the course of ageing( Reference Milgram, Head, Weiner and Thomas 1 ) and accelerated brain ageing in dogs results in cognitive dysfunction syndrome (CDS)( Reference Ruehl, Bruyette and DePaoli 2 , Reference Ruehl and Hart 3 ), a condition similar to human dementia including Alzheimer’s disease (AD), which has no known cure. Epidemiological studies have reported CDS in 28–29·5 % of 11–14-year-old dogs and 47·6–68 % of dogs over 15 years( Reference Azkona, Garcia-Belenguer and Chacon 4 , Reference Neilson, Hart and Cliff 5 ). For dogs, as humans, CDS is associated with severe brain atrophy due to irreversible loss of brain cells and synapses( Reference Borras, Ferrer and Pumarola 6 – Reference Uchida, Nakayama and Goto 11 ). The risk factors of CDS in dogs have not been fully studied( Reference Pan 12 ), but are likely similar to those associated with human dementia. Many nutritional factors are associated with higher risk of dementia, including DHA deficiency, high blood homocysteine, and low status of vitamin B6, vitamin B12 and folate. Other risk factors include high blood pressure, cerebral vascular lesion, increased oxidative stress and chronic inflammation( Reference Cole, Ma and Frautschy 13 – Reference Taupin 21 ).
Once established, CDS appears to be irreversible, which argues for the development of a preventative rather than disease modifying strategy. We have previously proposed a novel strategy for promoting healthy brain ageing that focuses on nutritional modifications targeting multiple risk factors associated with brain ageing and dementia in people( Reference Pan 12 ). Consistent with this strategy, we have developed a blend of nutrients, referred to herein as the Brain Protection Blend (BPB), which is intended to minimise or eliminate many of the risk factors associated with brain ageing and dementia. The blend includes fish oil, arginine, B vitamins and selected antioxidants. Fish oil, such as menhaden fish oil, ocean white fish oil and hake fish oil, contains DHA and EPA and was included to correct for DHA deficiencies and to provide anti-inflammatory benefits( Reference Ciubotaru, Lee and Wander 22 , Reference Wall, Ross and Fitzgerald 23 ). l-Arginine was selected to enhance nitric oxide (NO) synthesis, which has been linked to circulation, blood pressure control and cognition( Reference Dong, Qin and Zhang 24 , Reference Yamada, Noda and Nakayama 25 ). B vitamins prevent and correct any B vitamin deficiency and minimise the risk of elevated blood homocysteine( Reference Selhub, Bagley and Miller 19 , Reference Bryan, Calvaresi and Hughes 26 , Reference Smith, Smith and de Jager 27 ). A few studies have been done to determine blood homocysteine levels in normal dogs and dogs with various diseases, and elevated homocysteine was observed in dogs with renal (18·86 (sem 10·15) µmol/l) and heart diseases (10·21 (sem 6·09) µmol/l), compared with the control dogs (5·72 (sem 3·26) µmol/l)( Reference Lee, Jeong and Kang 28 ). Rossi et al.( Reference Rossi, Rossi and Giordano 29 ) reported that elevated homocysteine levels were positively correlated with the stages of myxomatous mitral valve disease (MMVD) in dogs, and the mean blood homocysteine concentrations in control, stage B MMVD, stage C MMVD and stage D MMVD were 6·72 (sem 1·65), 13·37 (sem 4·16), 18·86 (sem 6·73) and at 28·26 (sem 4·48) µmol/l, respectively. Antioxidants including vitamin E, C and Se offer protection against oxidative damage and inflammation-induced damage in both brain tissue and blood vessels( Reference Frank and Gupta 30 – Reference Schwenke and Behr 35 ).
We have previously assessed this strategy in middle-aged (5–6 years of age) and old cats (7 years and older) which were divided into two food groups, one of which was placed on a BPB-supplemented diet and the other on an identical base diet without the supplementation. The cats were maintained on the diets for approximately a year and the cats fed the supplemented diet performed superior to the control fed cats on three of four cognitive test protocols( Reference Pan, Araujo and Burrows 36 ).
We hypothesised that the BPB blend, by targeting the known risk factors associated with brain ageing, should be able to maintain or enhance cognitive functions in old dogs. Aged beagle dogs were assigned to either treatment or control groups and were then evaluated on several cognitive test protocols that assessed learning ability, visuospatial function and attention over the course of 6 months. In the first test protocol, learning ability and visuospatial memory and attention were assessed using a landmark discrimination learning protocol. The protocol intended to assess allocentric spatial processing, which entails utilisation of external landmarks to localise objects in space, and is distinct from egocentric spatial ability, in which subjects use their own body position to identify location of external objects( Reference Milgram, Adams and Callahan 37 , Reference Milgram, Head and Muggenburg 38 ). We have previously found that performance on the landmark protocol is sensitive to age as well as a variety of interventions, including maintenance on an antioxidant-supplemented diet( Reference Milgram, Head and Muggenburg 38 ) and treatment with a combination of α-lipoic acid and acetyl-l-carnitine( Reference Milgram, Araujo and Hagen 39 ).
The second test protocol focused on egocentric spatial ability, and has been described by Christie et al. ( Reference Christie, Studzinski and Araujo 40 ). The protocol first examined the ability of the dog to selectively respond to an object based on proximity of the object to its left or right side and second, to reverse its original response.
Methods
Study design
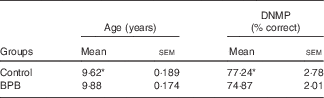
The study consisted of a baseline and test phase. During the baseline phase, all dogs were evaluated on a variable delay version of the delayed non-matching to position (DNMP) task( Reference Chan, Nippak and Murphey 41 ). Performance on the DNMP tests was ranked. After ranking the dogs, they were blocked and within each block, equal numbers were randomly assigned to each group, resulting in two cognitively equivalent groups.
At the start of the treatment phase, the dogs were given a 1 week wash-in and immediately following, were trained on a landmark discrimination protocol over a maximum 92-d period. At 100 d after the start of the treatment phase, all dogs were evaluated on an egocentric protocol, which continued over a maximum of 90 d. For all cognitive testing, dogs were evaluated once daily on one task at a time, each dog was evaluated approximately at the same time each day, and dogs in both groups were tested at the same time each day. The task order was based largely on previous test protocols. The evaluation procedure was adopted from a similar task order in previous studies( Reference Christie, Studzinski and Araujo 40 , Reference Milgram, Zicker and Head 42 ).
Animals and housing
Subjects were twenty-four Beagle dogs of both sexes, which were assigned to control and treatment groups equated for baseline cognitive ability. At the start of the treatment phase, the control group (n 12) ranged in age from 9·1 to 11 years of age (mean=9·62 (SEM 0·189); 6 females and 6 males); the treatment group (n 12) ranged in age from 9·3 to 11·5 (mean=9·88 (SEM 0·174); 6 females and 6 males). The study protocol was approved by the CanCog Technologies Institutional Animal Care Committee (no. CCT1-04-7871), and followed the guidelines of the Ontario Ministry of Agriculture. All of the dogs had previous cognitive training before the start of the study. At a minimum, this included completing a pre-training protocol( Reference Milgram, Head, Weiner and Thomas 1 ) and training on a DNMP task( Reference Chan, Nippak and Murphey 41 ) . Dogs were group housed based on compatibility up to four per pen, in five by 16·5 ft pens. Over the course of the study, the dogs were provided with environmental enrichment consisting of toys, beds and the opportunity to play outside on a daily basis. Housing temperature and humidity were maintained by automated temperature control and continuous ventilation. Room environmental conditions have design specifications as follows: single-pass air supply with 2200 c.f. filtered air changes per minute, relative humidity of 60±10 %, temperature of 21±3°C, and a natural light–dark cycle.
Test diets and feeding
The dogs were weighed weekly at the beginning of the study and food provided was adjusted in order to maintain relatively constant body weights.
The control diet was an experimental diet for adult dogs, and all the essential nutrients of this diet exceeded the minimal nutrient requirements for adult maintenance defined by the Association of American Feed Control Officials. The test diet was based on the control diet supplemented with fish oil and vitamin C, and elevated levels of B vitamins, vitamin E and arginine. Both diets were isoenergetic, manufactured by Nestlé Purina PetCare, Inc., and contained comparable levels of protein, fat, carbohydrates, and sulphur amino acids. Dietary ingredients, chemical composition, and the levels of individual ingredients of the nutrient blend are provided in Table 1. Diet samples were sent to Nestlé Purina Analytical Laboratories (Nestlé Purina PetCare, Inc.) for chemical analyses. Ash, crude fat, crude fibre, crude protein, moisture and fatty acid profile were measured based on Association of Official Agricultural Chemists Methods 942·05, 922·06, 962·09, 990·03, 930·15 and 996·06, respectively.
Table 1 Ingredients and chemical composition of diets
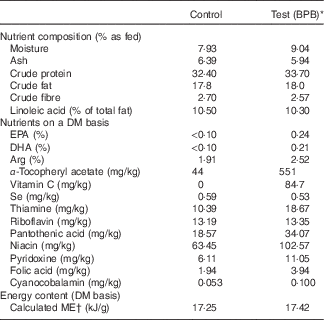
BPB, brain protection blend; ME, metabolisable energy.
* BPB including addition of DHA, EPA, vitamin C and elevated levels of arginine, B vitamins and α-tocopherol.
† Calculated based on the predictive equation for ME in dog foods( 43 ).
The dogs were fed once daily with access to food over approximately 1 h time period. The initial individual food amounts were calculated using the formula ‘energy requirement=460 kJ/d (110 kcal/d)×(BW0·75)’, which was intended to maintain a constant body weight. Dogs had free access to water via a wall-mounted automatic system and/or water bowls. The dogs were weighed weekly at the beginning of the study and food provided was adjusted in order to maintain a relatively constant body weight.
Cognitive testing apparatus
The testing apparatus was a modified version of one previously described( Reference Milgram, Head, Weiner and Thomas 1 ) and consisted of a Plexiglas box approximately 0·609×1·15×1·08 m (16). The front contained three height-adjustable gates through which the dog responds. The investigator was separated from the dog by a plastic partition containing a one-way mirror and a hinged-door. The tray was made of Plexiglas and contained either one medial and two lateral food wells, or four equally spaced food wells, depending on the task.
Baseline assessment
Variable DNMP -test. Each trial of the DNMP task consisted of a sample and test phases( Reference Pocernich, Lange and Sultana 34 ). During the sample phase, the dog was presented with a red block covering one of the three food wells. The dog was required to displace the block to retrieve a food reward in the well below the block. The block was then removed from view of the subject and a delay initiated. The test phase was instituted at the end of the delay: the dog was presented with two identical blocks – one at the sample location and the second covering one of the other two wells. Subjects were required to respond to the new position to obtain the food reward. A 30-s inter-trial interval was used to separate each trial.
Subjects received twelve trials daily with half of the trials at a delay of 20 s and the remaining trials at a delay of 90 s. Performance accuracy in terms of percent correct over the fourteen sessions was used as a grouping variable.
Test phase
Landmark discrimination learning. The Landmark discrimination protocol assessed the dogs’ ability to learn to approach one of two objects based on their proximity to an external landmark. The protocol included three phases, referred to as land-0, land-1, and land-2( Reference Milgram, Adams and Callahan 37 , Reference Milgram, Head and Muggenburg 38 ). The land-0 utilised a yellow peg (2×2×9 cm) and two identical white coasters. The yellow peg was attached to one of the coasters. On each trial, the investigator placed the food reward in either the left or right food well and positioned the landmark accordingly. In this and subsequent tasks, food inaccessible to dogs was placed in the bottom of the coaster associated with non-reward in order to prevent the dogs from responding based on olfactory cues. Subjects were able to obtain a food reward if they displaced the coaster attached to the yellow peg. The dogs received ten trials per day, with an inter-trial interval of 30 s. Testing was once a day and 6 d/week. The door was raised and tray moved to approximately 25 cm from the dog for a brief inspection interval, to enable the subject to see the spatial arrangement on the tray. The tray was then presented to the dog, and the dog was allowed to respond within 60 s. In this and all subsequent levels, the dogs were required to respond to the coaster closest to the landmark to obtain a food reward. The correct side was determined randomly by computer, with the constraint that each side was correct on half of the trials of each test session. Each dog was allowed a maximum of thirty test sessions (300 trials) to learn to respond to the landmark-coaster combination used for land-0. A partial correction procedure was used in which dogs were permitted to switch their response to the correct object after responding incorrectly to the coaster alone. Each dog was only allowed a single correction trial per session.
The dogs were tested on the second task (land-1) after they had successfully completed a two-stage criterion. The first stage required the subject to respond correctly on at least nine of ten trials, or on eight of ten trials over 2 consecutive days. The second stage was achieved when the subject responded correctly on at least twenty-one trials (70 %) over three consecutive sessions. If a dog did not respond on a trial, it was assigned a score of 0·5, which is the score that would have been obtained had the dog responded randomly. In this case, the dog was then given one extra day of testing to complete the thirty trials, and an average score of 70 % over all test days was required to pass the second stage.
For the land-1 task, the landmark was moved 1 cm medially and diagonally away from the edge of the coaster. Each dog was allowed a maximum of thirty test sessions (300 trials) to learn to respond to stimulus associated with the landmark for land-1. A partial correction procedure was used in which dogs were permitted to correct their response after making an error once each session. Dogs that passed land-1 were then tested on land-2, which was the same as land-1, except that the new landmark position was diagonally one cm away from the edge of the previous landmark position, and 2 cm from the edge of the coaster. Dogs received ten sessions on land-2.
The egocentric protocol had three phases, a preference phase, an acquisition phase and a reversal learning phase( Reference Christie, Studzinski and Araujo 40 ). The preference phase occurred over a single test day and consisted of presenting the dog with ten discrete trials with identical objects covering both lateral food wells and provided food reward on each trial. The side chosen most frequently was designated the preferred side, and assigned to be the positive side for the initial acquisition phase of testing. Thus, if the dog chose the object to its left most frequently, then the dogs’ left side was designated its preferred side. For dogs that did not show a side preference (and responded five times to each side), a coin toss was used to determine the rewarded side.
The acquisition (original learning) phase evaluates dogs’ spatial learning ability by using a body-centred coordinate system to locate objects. Dogs were tested with twelve trials per session. Each trial consisted of a single presentation of the stimulus tray with a stimulus covering a reward on the preferred side lateral well, or centre well. A second non-rewarded stimulus object covered a well towards the subject’s non-preferred side. Consequently, the object closest to the dogs’ preferred side was always rewarded. On any given trial, there were three possible spatial configurations (left–centre, left–right or right–centre). Each configuration occurred four times per test session. The original learning phase was successfully completed when the subject responded correctly on at least thirty-three of thirty-six trials over three consecutive test sessions.
The reversal phase measured the dogs’ flexibility and executive functions. All dogs were given two reversal tests (reversal 1 and reversal 2). The reversal phase was initiated on the day following completion of initial learning. The test procedure was identical to that followed during the acquisition phase except that the rewarded position was switched to the opposite side. Thus, if the object closest to a dog’s right was rewarded in acquisition testing, the object closest to its left was rewarded in reversal 1 testing. Reversal 1 testing was successfully completed when the subject responded correctly on at least thirty-three of thirty-six trials over three consecutive test sessions. Dogs that passed reversal 1 testing were then tested on reversal 2, which was identical to reversal 1, except that the rewarded position was switched to the opposite side of the reversal 1 testing.
A two-stage learning criteria was used. The first stage required dogs to either perform with at least 90 % accuracy 1 d or at least 80 % accuracy over 2 consecutive test days. The second stage required dogs to perform above 70 % accuracy over 3 consecutive days subsequent to passing the first stage criterion. The dogs had to pass the learning criteria in the first phase before they moved on to the next phase.
Body weight, food intake and blood sample collection.
Before the start of the study and at the end of the study, jugular blood samples were collected by a veterinary technician for measurements of complete blood count, blood chemistry and metabolomic analyses. Food intake was recorded daily and body weight was recorded at 2-week intervals. Blood samples were sent to Metabolon for metabolomic analysis. Samples for clinical chemistry, and complete blood count were sent to Advance Vet Lab for analyses.
Metabolomic analysis
Metabolomic profiling was performed as described previously( Reference Evans, DeHaven, Barrett, Mitchell and Milgram 44 , Reference Sha 45 ). Metabolites were extracted from 100 µl plasma by the addition of cold methanol. The precipitated extract was split into four aliquots and dried under nitrogen. The samples were re-suspended in platform specific solutions before they were applied into the instruments. The untargeted metabolomic profiling platform employed for this analysis was based on a combination of three independent platforms: ultra-HPLC/tandem MS (UHPLC/MS/MS)( Reference Evans, DeHaven, Barrett, Mitchell and Milgram 44 ) optimised for basic species, UHPLC/MS/MS optimised for acidic species, and GC/MS( Reference Sha 45 ). Metabolites were identified by matching the ions’ chromatographic retention index and mass spectral fragmentation signatures with reference library entries created from authentic standard metabolites. For ions that were not covered by the standards, additional library entries were added based on their unique retention time and ion signatures. Peak ion counts for each compound in each sample were used for statistical analysis, resulting in the comparisons of relative concentrations. A given compound was reported from only one of the three platforms.
Statistical analysis
Errors were used as the dependent measure and group comparisons were made using both Student’s t test and repeated-measures ANOVA. Values are means with their standard errors except the cognitive data in the figures.
Statistical analysis for metabolomic data
An a priori power analysis was conducted to determine the sample size. Using previous work with the landmark discrimination test( Reference Milgram, Araujo and Hagen 39 ), the control group had a mean of 136 errors to criterion and a standard deviation of 16. To detect a 15 % difference between the control and treatment group with power of 0·80 and a significance level of 0·05, it was determined that eleven animals per group were needed. We then added one animal to each group to ensure that we would have adequate power in the rare case that an animal would have to drop out of the study.
The metabolomic analyses were done with Array Studio version 10.0 (OmicSoft). Missing values (if any) are assumed to be below the level of detection. However, biochemicals that were detected in all samples from one or more groups but not in samples from other groups were assumed to be near the lower limit of detection in the groups in which they were not detected. In this case, the lowest detected level of these biochemicals was imputed for samples in which that biochemical compound was not detected. Following log transformation and imputation with minimum observed values for each compound, Welch’s two-sample t test was used to identify biochemicals that differed significantly between experimental groups. Pathways were assigned for each metabolite, allowing examination of overrepresented pathways.
For all analysis, we used the 0·05 level to assume statistical significance. We also targeted values between 0·05 and 0·1 as evidence of potential trends.
Results
Baseline data
Table 2 shows baseline performance of the two groups before start of the treatment phase. Overall, the groups did not differ significantly on the DNMP. Data were expressed as means with their standard errors.
Table 2 Age and cognitive performance at baseline (Mean values with their standard errors)
DNMP, delayed non-matching to position test.
* Groups were compared using Student’s t tests. There were no statistically significant baseline differences in both age and DNMP test (P>0·10).
Landmark discrimination protocol
All animals were tested on both land-0 and land-1, and the data were analysed with a repeated-measures ANOVA with task (land-0 and land-1) as a within subject variable and food as a between subject variable. The analysis revealed a significant main effect of food (P=0·0493) and a highly significant effect of task (P<0·001). Fig. 1 shows that the treatment effect reflected better overall performance by the dogs on the BPB-supplemented diet, while the task effect was due to the Land-1 being more difficult than the land-0 task. The groups were then compared on both tasks using two-tailed t tests. They did not differ significantly on the land-0 task (P=0·29) but showed a significant difference on the land-1 task (P=0·0446).

Fig. 1 Effects of brain protection blend (BPB) diet on dogs’ performance in the landmark tests. Values are means (n 12 for each group), with their standard errors represented by vertical bars. The performance was expressed as errors to criterion. ![]() , Land-0;
, Land-0; ![]() , land-1. * Mean values were significantly different between the control and BPB groups (P=0·0446).
, land-1. * Mean values were significantly different between the control and BPB groups (P=0·0446).
Because of time restrictions, testing on the land-2 task was completed on eleven control dogs and on nine dogs from the BPB group. The control dogs averaged 41·14 (sem 1·33) errors, while the BPB group averaged 34·17 (sem 3·99). The group differences showed a trend (P=0·092) of better land-2 performance by the BPB group.
Egocentric learning and reversal
Group comparisons on the egocentric task first compared the two groups on the initial learning and on the first two reversal tasks using a repeated-measures ANOVA. The analysis revealed a statistically significant effect of group (P=0·0032) and a statistically significant effect of task (P<0·001). Fig. 2 shows that the dogs on the BPB diet showed more accurate performance than the controls, which accounted for the group effects. The task effect reflected reversal learning being acquired with more errors than original discrimination learning. However, the second reversal learning task was learned more rapidly than the first. We also compared the two groups on each task separately using t tests and found statistically significant differences on both the first reversal task (P=0·005) and on the second (P=0·01). The groups did not differ on the original egocentric discrimination learning task (P>0·1).
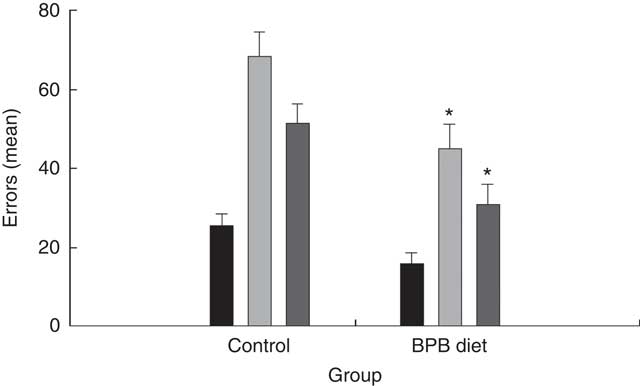
Fig. 2 Effects of brain protection blend (BPB) diet on dogs’ performance in egocentric tests. Values are means (n 12 for each group), with their standard errors represented by vertical bars. The performance was expressed as errors. ![]() , Egocentric discrimination;
, Egocentric discrimination; ![]() , egocentric reversal 1;
, egocentric reversal 1; ![]() , egocentric reversal 2. * Mean values were significantly different between the control and BPB groups (P=0·005 for the reversal 1; P=0·01 for the reversal 2).
, egocentric reversal 2. * Mean values were significantly different between the control and BPB groups (P=0·005 for the reversal 1; P=0·01 for the reversal 2).
Effect on body weight, food intake, and blood levels of complete blood count and clinical chemistry
Body weight at the beginning and end of study was compared for each group using paired t tests. Both groups showed a decrease in body weight. For the control dogs the decrease was non-significant (mean=10·464 (sem 2·33) kg at baseline and 10·145 (sem 2·95) kg at the end of the study). By contrast, the decrease was statistically significant (P=0·0042) for the BPB-fed dogs (mean=12·118+3·386 at baseline and 10·072+4·092 at the end of the study).
Mean food intake for each dog completing the study was calculated by taking average daily food intake over the course of the test phase. Overall, There was no significant difference (P=0·101) in food intake between the control (178·99 (sem 11·82) g/d) and test group (154·52 (sem 6·69) g/d).
There were no significant differences in any of the complete blood count and clinical chemistry measures at baseline and at the end of the study between two groups (data not shown).
Metabolomic analyses
Metabolomic analyses of the plasma samples at the end of the study were summarised in Figs 3–5. Many of the nutrients supplemented in the BPB diet were significantly higher in plasma, including arginine, α-tocopherol, DHA and EPA (Figs 3 and 4). Arginine can be metabolised via nitric oxide synthase to citrulline resulting in the release of NO. Significantly elevated levels of arginine (1·34-fold and P=0·0428) and higher levels of citrulline (data not shown, 1·27-fold and P=0·07) suggested that greater NO formation may have been promoted by BPB. The supplementation of n-3 fatty acids DHA and EPA was associated with not only significantly increased DHA (20·67-fold over the control), EPA (5·63-fold over the control), DPA (3·44-fold over the control), and stearidonate (10·58-fold over the control) but also significantly decreased levels of the n-6 fatty acids linoleate (0·87-fold under the control) and adrenate (0·74-fold under the control).
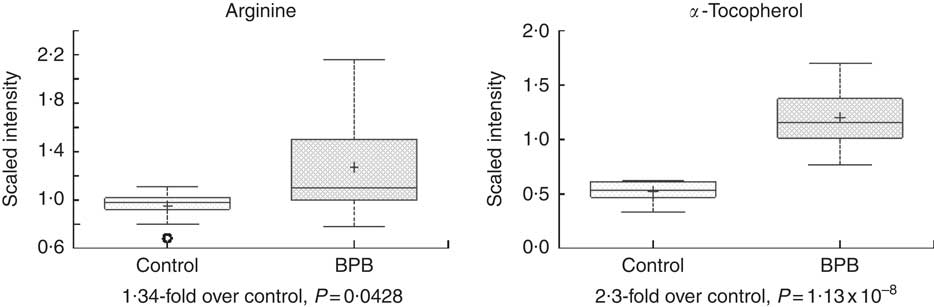
Fig. 3 Effects of the brain protection blend (BPB) diet on fasting blood arginine and α-tocopherol level in the dogs. Box plots of arginine and α-tocopherol. The x-axis shows the groups and the y-axis shows the relative normalised intensity for the compounds, respectively. In the box plots the top and bottom of the box represent the 75th and 25th percentile, respectively. The top and bottom bars (‘whiskers’) represent 1·5xthe interquartile range (IQR). Anything outside of 1·5xIQR is listed as an extreme point. The cross inside the box indicates the mean value and the line inside the box indicates the median value. Fold differences between the groups and associated P values are indicated below each plot.
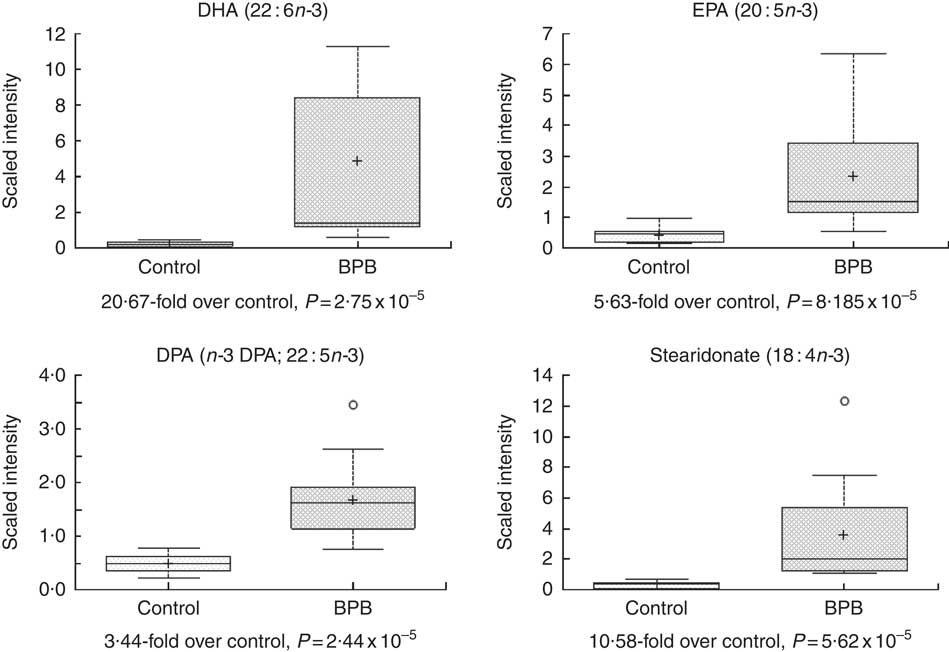
Fig. 4 Effects of the brain protection blend (BPB) diet on fasting blood n-3 fatty acid level in the dogs. Box plot of DHA (22 : 6n-3), EPA (20 : 5n-3), DPA (n-3 DPA; 22 : 5n-3) and stearidonate (18 : 4n-3). The x-axis shows the groups and the y-axis shows the relative normalised intensity for the compounds, respectively. In the box plots the top and bottom of the box represent the 75th and 25th percentile, respectively. The top and bottom bars (‘whiskers’) represent 1·5xthe interquartile range (IQR). Anything outside of 1·5xIQR is listed as an extreme point. The cross inside the box indicates the mean value and the line inside the box indicates the median value. Fold differences between the groups and associated P values are indicated below each plot.
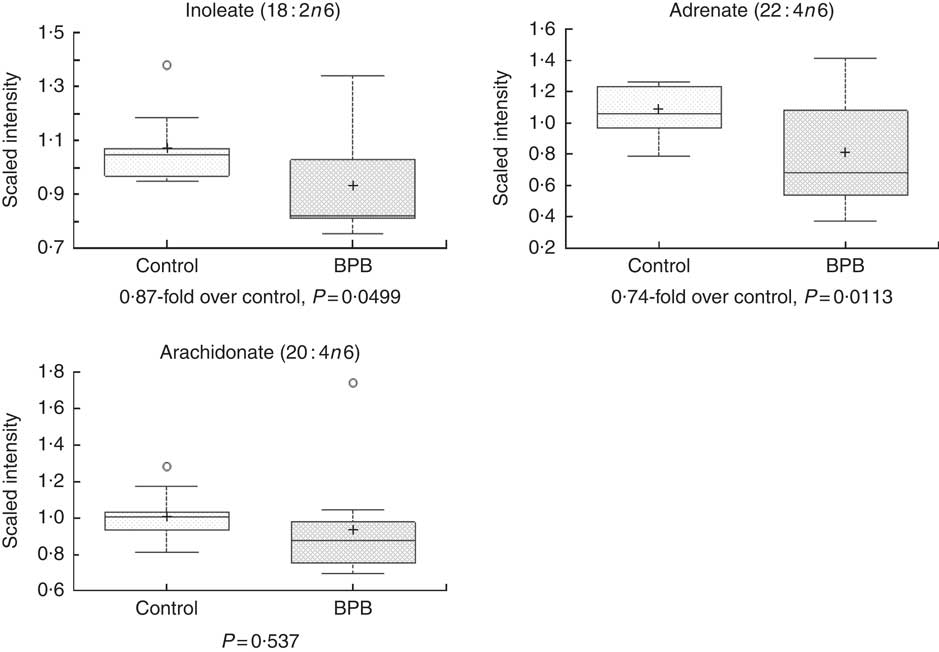
Fig. 5 Effects of the brain protection blend (BPB) diet on fasting blood n-6 fatty acid level in the dogs. Box plots of linoleate (18 : 2n-6), adrenate (22 : 4n-6) and arachidonate (20 : 4n-6). The x-axis shows the groups and the y-axis shows the relative normalised intensity for the compounds, respectively. In the box plots the top and bottom of the box represent the 75th and 25th percentile, respectively. The top and bottom bars (‘whiskers’) represent 1·5xthe interquartile range (IQR). Anything outside of 1·5xIQR is listed as an extreme point. The cross inside the box indicates the mean value and the line inside the box indicates the median value. Fold differences between the groups and associated P values are indicated below each plot.
Discussion
This study assessed the effectiveness of dietary supplementation with a specially formulated nutrient blend that targets the main risk factors associated with brain ageing. We have previously reported that this BPB confers cognitive benefits to aged cats( Reference Pan, Araujo and Burrows 36 ). This study focused on evaluating the effectiveness of the supplement on cognitive ability in aged dogs.
Dogs were first given a cognitive test (DNMP test) to provide a basal level of cognitive function that could be used to place dogs into two cognitively equivalent groups. After an initial wash-in period, all dogs were tested on a series of cognitive test protocols, which assessed landmark discrimination learning, egocentric discrimination learning and reversal learning. The groups were maintained on the diets for 6 months. The BPB-supplemented group showed significantly better performance than the controls on the second component of the landmark discrimination task, and on reversal learning of an egocentric discrimination task. The groups did not differ significantly on the first phase of the landmark discrimination task and on the initial egocentric discrimination task.
The specificity of the benefits may be reflective of concomitant selectivity in cognitive benefits. Floor effects provides a more likely explanation. The two tasks that did not show significant improvement were both acquired relatively rapidly with a limited number of errors making it difficult to detect significant group differences. The tasks showing benefits, by contrast, were more difficult.
These results, like the data previously reported in cats( Reference Pan, Araujo and Burrows 36 ), indicates that the nutrient blend provides global cognitive benefits in both dogs and cats. The key ingredients of the BPB are present in the fruits, vegetables, cereals, seeds, legumes, vegetable oils and oils from fatty fish, all of which are the components of the Mediterranean diet, which has been found to provide cognitive benefits in older adult humans( Reference Feart, Samieri and Barberger-Gateau 46 ).
The control diet was formulated to contain all nutrients needed by dogs at, or above the required levels (Table 1). This is important because it indicates that the results are more likely due to beneficial effects of the BPB diet rather than deficiencies present in the control diet. On the other hand, metabolomic analyses confirmed that higher levels of the BPB ingredients in the test diet resulted in higher levels of n-3 fatty acids, α-tocopherol, arginine, along with reduced n-6 fatty acids in the dogs, which suggests that dogs must consume the nutrients in the BPB at least at the levels tested in the present study to protect against age-induced cognitive decline. Our results were also supported by a recent study in elderly people with mild cognitive impairment, which showed that B vitamin supplements slowed down cognitive decline only in subjects with high plasma n-3 fatty acids, and had no effects in subjects with low plasma n-3 fatty acids( Reference Oulhaj, Jernerén and Refsum 47 ).
Oxidative stress and inflammation are among the important causes of brain ageing and dementia( Reference Markesbery 16 , Reference Weninger and Yankner 20 ). The BPB diet significantly increased blood levels of α-tocopherol (Fig. 3), and n-3 fatty acids (Fig. 4, DHA, EPA, DPA, and stearidonate), and decreased levels of the n-6 fatty acids (Fig. 5, linoleate and adrenate), possibly reflecting a stronger anti-oxidation and anti-inflammatory environment. Those changes may help to reduce oxidative stress-induced damages and low-grade inflammation in the whole body including the brain. DHA has neuroprotective effects through multiple mechanisms including reduced pro-inflammatory metabolites from n-6, enhanced trophic factor signalling, increased brain-derived neurotrophic factor, enhanced antioxidant defences, increased GLUT, enhanced neurogenesis and improved membrane fluidity( Reference Cole, Ma and Frautschy 13 ). In addition, higher EPA may be able to maintain effective levels of resolvins of the E series, while higher DHA may be able to sustain effective levels of either resolvins or protectins (neuroprotectins) of the D series or maresin 1. Those resolvins, protectins, and maresins help tissues return to normal status by promoting resolution of inflammation( Reference Kohli and Levy 48 – Reference Weylandt, Chiu and Gomolka 50 ). As both the control and test diets used the same food ingredients and the same trace mineral premix, Se levels in both diets were comparable (Table 1). Our data indicate that high Se alone in the control diet didn’t improve cognitive functions in senior dogs.
The B vitamins came from many of the food ingredients used in both the control and test diet, the control diet contained all the B vitamins higher than the daily requirements for dogs. Vitamin premix was used to further increase the B vitamins in the test diet. The potential benefits of higher levels of B vitamins in the BPB were consistent with a recent study showing that B vitamin supplementation reduced total blood homocysteine and the decline in cognition in people with mild cognitive impairment( Reference De Jager, Oulhaj and Jacoby 51 ).
Hypertension is a risk factor for AD in people( Reference Duron and Hanon 14 ). The BPB diet resulted in significantly higher level of fasting blood l-arginine (Fig. 3), a precursor for NO. Arginine can be metabolised via nitric oxide synthase to citrulline resulting in the release of NO. Significantly elevated levels of arginine (1·34-fold and P=0·0428) and higher levels of citrulline (1·27-fold and P=0·07) suggested that greater NO formation may have been promoted by increased arginine in the test diet. NO plays a critical role in normal cognitive functions and administration of NO precursors in rats protected against the development of cognitive disorders( Reference Manukhina, Pshennikova and Goryacheva 52 ). Peripherally, optimal level of NO is essential in maintaining normal blood pressure, and dietary l-arginine supplementation was able to decrease both systolic and diastolic blood pressure in subjects with mild hypertension( Reference Ast, Jablecka and Bogdanski 53 ). In addition, experimental hypertension can be counteracted by administration of l-arginine in rats( Reference Rajapakse, De Miguel and Das 54 ).
Lower DHA status in the brain is correlated with faster cognitive decline in both normal elderly human subjects and subjects with AD( Reference Cole, Ma and Frautschy 13 ). Fish oil supplementation has been shown to improve cognitive function in people( Reference Yurko-Mauro, McCarthy and Rom 55 ) and aged mice( Reference Jiang, Shi, Wang and Yang 56 ). Harris( Reference Harris 57 ) proposed that a concentration of 8 % erythrocyte fatty acids as EPA+DHA may offer maximal cardiovascular protection in humans. Additional studies are needed to determine the optimal levels of EPA+DHA for maximal protection against brain ageing and CDS in dogs.
Further studies are required to determine the minimum levels needed for each nutrient to have maximal beneficial effects on brain health and functions. The present results provide further support for the use of nutritional intervention strategies, which focus on a consumption of a blend of nutrients to modulate decline in brain function associated with ageing. It might be possible, for example, to develop a more effective nutritional intervention by adding other nutrients and/or bioactives. For example, we have found that dietary supplementation with medium chain TAG (MCT) also has cognition-enhancing properties, possibly by providing the brain with an additional source of energy( Reference Pan, Larson and Araujo 58 ). This could potentially be exploited by combining the MCT diet with the BPB diet. In summary, the results from this study strengthen the support for the hypothesis that the healthy brain ageing and cognitive functions may be successfully promoted by retarding ageing-induced changes in the brain and reducing or eliminating risk factors associated with brain ageing and dementia( Reference Pan 8 ).
Acknowledgements
The authors thank Nestlé Purina Pilot Plant for manufacturing the diets used in this study. The authors also would like to thank technologists at Cancog Technologies for carrying out the feeding study, performing cognitive tests, and collecting sample and raw data.
The study was entirely funded by Nestlé Purina Research.
Y. P. and N. W. M. designed the study, interpreted the results and prepared the manuscript. A. D. K. and T. J. J. prepared the writing and plots related to the metabolomic analyses of the blood samples and interpretation of the metabolomic data.
Y. P. is an employee of Nestlé Purina Research, and has not been involved in dog recruitments, randomisation, data and sample handling, data analysis and storage. A. D. K. and T. J. J. are employees of Metabolon, Inc. and, as such, have affiliations with or financial involvement with Metabolon, Inc. The authors have no other relevant affiliations or financial involvement with any organisation or entity with a financial interest in or financial conflict with the subject matter or materials discussed in the manuscript apart from those disclosed. N. W. M. is the President and CEO of CanCog Technologies, and served as the Scientific Director responsible for carrying out the research and preparing the final report. N. W. M. has no other financial involvement with Nestle Purina or financial interest in the subject matter and materials discussed in the manuscript.


