


For many years seafood, i.e. fish, molluscs and crustaceans, has often been the focus of attention in nutritional research and recommendations. These products are considered to be an important source of iodine, vitamin D, proteins and fatty acids, especially the n-3 long-chain (LC) PUFA, although only half the French population follows the recommendation of the French National Nutritional-Health Programme to consume fish at least twice a week(1).
The protective role of n-3 PUFA has been demonstrated in primary prevention and, above all, secondary prevention of CVD. n-3 LC PUFA might help to reduce mortality from CVD, though not morbidity(2, Reference Bucher, Hengstler, Schindler and Meier3). n-3 LC PUFA supplements might help to reduce cardiovascular risks by lowering the risk of sudden death of people with a history of cardiovascular problems(Reference Breslow4). Dietary n-3 LC PUFA and n-3 LC PUFA supplements have been demonstrated to be linked with n-3 LC PUFA concentrations in blood, plasma, tissues or human milk, being responsible for beneficial effects on visual and mental health and neurodevelopment(5, Reference Arterburn, Hall and Oken6).
Nevertheless, at present, the respective mechanism of action of each of EPA and DHA is debatable. As described in the Symposium ‘n-3 fatty acids: recommendations for therapeutics and prevention’ convened by the Institute for Human Nutrition of Columbia University on 21 May 2005(Reference Akabas and Deckelbaum7), confusion exists about the recommendations and the biological link between intake and health. Recommended daily intakes (RDI) also vary depending on scientific authority. In France, for example, in adult males, for a total energy intake (TEI) of 9211 kJ/d (2220 kcal/d), the RDI are 500 mg n-3 and n-6 LC PUFA including 120 mg DHA. This corresponds to 0·2 % of the TEI for n-3 and n-6 PUFA, and 0·05 % of the TEI for DHA. In the same manner, for French adult females, for a TEI of 7536 kJ/d (1800 kcal/d), the RDI are 400 mg n-3 and n-6 LC PUFA including 100 mg DHA. This corresponds to 0·2 % of the TEI for n-3 and n-6 PUFA, and 0·05 % of the TEI for DHA. The ratio n-6/n-3 should tend towards 5(Reference Martin8). Then a discussion has got underway on an update of these values. On an international level, the International Society for the Study of Fatty Acids and Lipids (ISSFAL) recommends a minimal daily intake of 500 mg n-3 LC PUFA (EPA + DHA) with regard to the prevention of CVD(9). In 2004, the Scientific Advisory Committee on Nutrition (UK) revised the previous population guideline recommendation about n-3 LC PUFA, to make it consistent with the recommendation for fish consumption by raising it from 0·2 to 0·45 g/d(5). The American Heart Association recommends a daily consumption of 1 g of EPA and DHA for patients with documented CHD(Reference Kris-Etherton, Harris and Appel10). Lastly, the Australian Health and Medical Research Council recommended an n-3 LC PUFA intake of 90 mg/d for adult women and 160 mg/d for men(11).
The principal dietary sources of α-linolenic acid (ALA), the precursor of n-3 LC PUFA, are vegetable products, in particular rapeseed oil and soyabean oil. And apart from dietary supplements, seafood products remain the major source of n-3 LC PUFA, since in humans the conversion of ALA into these long-chain derivatives is low: it has been shown that less than 1 % of the ALA is converted into DHA(Reference Pawlosky, Hibbeln, Novotny and Salem12, Reference Goyens, Spilker, Zock, Katan and Mensink13). This conversion rate seems to be greater in women than in men(Reference Burdge and Wootton14, Reference Burdge and Calder15).
The present study focused on French people consuming fish and seafood at least twice weekly. This criterion was defined according to the 1999 French national consumption survey INCA results(16) and the recommendations through the French National Nutritional-Health Programme, which are the same for the UK(5). The median consumption frequency calculated from the individual seafood consumption data in the population of INCA was twice weekly. People selected were living in French coastal zones, which concentrate the ‘high consumers’, as confirmed by a study of the French Food Consumption Observatory carried out in 1996 (unpublished data). It appears that fish consumption declines as we move away from the coast, which may partly be explained by widespread self-procurement of seafood by coastal populations. This hypothesis is supported by a 1998 survey of the French Research Center for the Study and Monitoring of Living Standards(17).
The CALIPSO study (Consommations ALimentaires de poissons et produits de la mer et Imprégnation aux éléments traces, PolluantS et Oméga 3/Fish and seafood consumption study and exposure to trace elements, pollutants and omega 3) is the first French study on high fish and seafood consumers. The present study provides seafood consumption data of these particular consumers by examining their food consumption habits and analysing the real nutritional benefits of these habits, notably those associated with n-3 LC PUFA with regard to French and international recommendations on n-3 PUFA intake and fish consumption.
Subjects and methods
Selection of study zones and subjects
Four French coastal zones have been selected for this survey: Le Havre in Normandy/Baie de Seine, Lorient in south Brittany, La Rochelle in Gironde/south Charente Maritime and Toulon in the Mediterranean/Var (Fig. 1). Individuals were recruited within a radius of 20–25 km around these points. A total of twenty to twenty-seven towns were visited in each zone and the number of individuals questioned per town was proportional to the number of inhabitants published in the 1999 French National Institute of Statisctics Survey(18). Individuals were randomly recruited using the so-called ‘random route’ method, i.e. choosing the first address at random then by door-to-door canvassing every five doors. The first questions allowed us to determine the person who was selected: the member of the family whose first name was the first according to the alphabetical order and who used to regularly consume fish and seafood. If the person was not present at home or did not fulfil the selection criteria, it was the second one and so on. The inclusion criteria were the age (>18 years), permanent residency in the coastal zone and the consumption of fish and seafood at least twice weekly according to French recommendations.
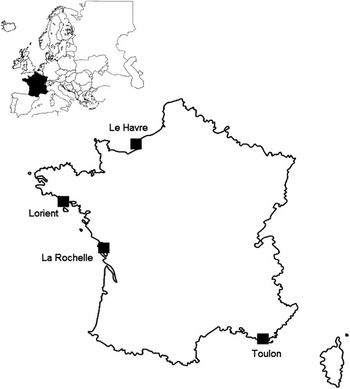
Fig. 1 Location of the study areas
Over and above these criteria, the female population aged 18–44 years, corresponding to women of childbearing age, was over-represented. The aim was to obtain a representative sample of this population and to provide data on seafood consumption of this particular group in view of the effects of consumption of fish on the health of the fetus during pregnancy with regard to the fatty acids and contaminants, especially methylmercury, which have been addressed in the CALIPSO study(19), and with regard to the particular recommendations for this population(Reference Martin8). The survey was carried out in all the selected zones between October and December 2004. A total of 6379 people were contacted and 43 % agreed to participate. Of these 2768 people, almost 66 % failed to meet the inclusion criteria: 24 % said they do not eat any fish or seafood, 34 % did not consume seafood at least twice weekly, 2 % did not reside permanently in the town concerned and 3 % were under 18 years of age. In the four zones, a total of 1011 interviews were carried out (about 250 per zone). The female population was effectively over-represented (about 2·5 times more than men) and in particular in women aged 18–44 years.
Consumption survey
The survey involved an interview concerning the fish and seafood consumption, eighteen questions about the sociodemographic profile of the participant and twelve closed questions concerning his or her perception of the dietary risks associated with seafood.
For eighty-two fishes, molluscs, crustaceans and seafood-based dishes, consumption frequencies were collected by an interviewer-administered FFQ. People were asked if they consumed each product once daily, three or four times weekly, twice weekly, once weekly, two or three times monthly, once monthly, less than once monthly or never. The portion sizes usually consumed were estimated using a validated book of sample photographs(Reference Le Moullec, Deheeger, Preziosi, Montero, Valeix, Rolland-Cachera, Potier de Courcy, Christides, Galan and Hercberg20), and consumptions were assessed by crossing the frequency and the portion size for each product. Information was also collected on preservation methods (fresh, frozen, canned, etc.) and on the usual origin of the consumed seafood (commercial and self-provisioning).
The FFQ was first validated by a pilot survey by means of 7 d consumption diaries insofar as FFQ are well known for being less precise than questionnaires concerning short periods, such as consumption diaries or 24 h recalls. This pilot survey was performed from March 2002 to June 2002 in two of the coastal zones, La Rochelle and Toulon, and involved sixty-one people aged 15 years or over. Consumptions were recorded using a diary and the FFQ, which was then corrected for the full-scale survey using comparisons between both methods.
Lipid and fatty acid composition of fish and seafood
To estimate lipid and fatty acid intake as precisely as possible, a local sampling covering mainly consumed fish and seafood (88–100 % of the total local consumption depending on the site) was conducted in each zone, based on the methodology of the total diet studies already developed in the French total diet study(Reference Leblanc, Tard, Volatier and Verger21) and recommended by international bodies(22–24). In all, 824 products were sampled, including 690 fresh and frozen products and 134 canned products, smoked fish or prepared seafood-based dishes, and pooled to make 138 composite samples for fresh and frozen fish, molluscs and crustaceans, and twenty-one composite samples for canned products, smoked fish or prepared seafood-based dishes. The sampling and analytical methods have already been described in detail elsewhere(Reference Sirot, Oseredczuk, Bemrah-Aouachria, Volatier and Leblanc25).
Fatty acid intake
Fatty acid intakes were calculated by crossing the individual consumption data from the food consumption survey with the composition data obtained by analysis of the representative food samples in the consumption/provisioning sets selected in each study zone. Because of seasonal unavailability, herring was not sampled during the sampling step of the study, and therefore no herring was analysed. So, for this particular highly consumed species, lipid and fatty acid composition data were taken from French and German food composition databases(26, Reference Souci, Fachmann and Kraut27). The estimation of these intakes takes into account a coverage exceeding 90 % of the individual consumption levels of fish and seafood declared by the populations studied in each of the four zones.
Data and statistical analysis
Fifteen individuals were eliminated because of their seafood consumption declarations of more than 5 kg of seafood per week (714 g/d) or less than 200 g per week (29 g/d). Consequently, the results are presented for 996 individuals. In order to ensure consistency between the exploitation of the data and the national and/or international recommendations concerning n-3 PUFA intake, the population was divided into three categories and one sub-category: male adults (aged 18–64 years, n 243), female adults (aged 18–64 years, n 630), including women of childbearing age (aged 18–44 years, n 344), and elderly people (aged 65 years or over without distinction of gender, n 123).
The total fish, mollusc and crustacean consumption data were not normally distributed, which is consistent with the fact that the subjects are only high seafood consumers corresponding to the distribution upper tail of the seafood consumptions of the total French population. Consequently, data have been converted using Box–Cox transformations (not presented) to allow for comparisons between groups using a variance analysis associated with Tukey’s test. Student’s t-tests were used to check intakes against recommendations. All statistical analyses were performed using SAS software version 8·2 (SAS Institute Inc., Cary, NC, USA).
Results
Fish and seafood consumption
Table 1 shows that the average consumption of fresh and frozen fish excluding canned or smoked products was found to be 633 (sd 497) g/week in men aged 18–64 years (P95 1491 g/week), 636·5 (sd 460) g/week for women in the same age group (P95 1521·9 g/week) and 787·8 (sd 539) g/week for subjects over 65 years of age (P95 1783·1 g/week), which is significantly higher than the mean consumption of adult men and women (P < 0·05). Moreover, the consumption of lean fish (<5 g lipid/100 g) is significantly higher in older subjects than in adult men or women (P < 0·05). There is no significant difference concerning oily fish (>5 g lipid/100 g).
Table 1 Consumption of fresh and frozen fish by high seafood consumers (g/week)

Values in the same line with different superscript letters are significantly different, P < 0·05 (Tukey’s test).*Consumer rate.
For all population groups, cod is the most consumed fish, not only in terms of quantity but also in terms of consumer rate, which is between 81 % and 88 %. Women of childbearing age conform to the same trend as female adults, but with an even higher consumer rate of cod. Salmon, saithe and sole are also among the most consumed fishes by each group even if the difference is not significant for all the species.
The distribution of the consumed species is slightly different between groups. For example, elderly people consume much more herring than the other groups (32·2 v. 7·7 and 8·9 g/week for male and female adults, respectively). Elderly people also consume more ray (42·3 v. 25·2 and 25·6 g/week, respectively).
Some regional differences have also been determined (not presented). Generally, people in Le Havre consume significantly less fish than those in Lorient (P < 0·01) and La Rochelle (P < 0·05).
Concerning molluscs and crustaceans, weekly average consumption is 270·3 (sd 225) g for men aged 18–64 years, with a 95th percentile of 703·4 g; 259·9 (sd 258) g for women in the same age group, with a 95th percentile of 665·3 g; and 279·3 (sd 253) g for people over 65 years, with a 95th percentile of 648·8 g (Table 2). There is no significant difference of intake between these groups. In each group, average consumption is the highest for oysters, shrimps, mussels and great scallops.
Table 2 Consumption of molluscs and crustaceans by high seafood consumers (g/week)

Values in the same line with different superscript letters are significantly different, P < 0·05 (Tukey’s test).*Consumer rate.
Concerning geographical differences, people in Lorient and La Rochelle consume significantly more molluscs and crustaceans than people in Le Havre and Toulon (P < 0·05, not presented).
Consumption of canned and smoked fish and other seafood-based products must be interpreted with care since the recipes of products such as fish soup and paella vary highly between individuals and commercial brands; their fish or crustacean content can differ. Table 3 includes the consumption of a few complete dishes without taking into account the recipe or the proportion of seafood they contain. Consequently, these data might overestimate the intake.
Table 3 Consumption of canned food, smoked fish and other seafood by high seafood consumers (g/week)

Values in the same line with different superscript letters are significantly different, P < 0·05 (Tukey’s test).*Consumer rate.
The weekly consumption of canned and smoked fish and seafood-based dishes is 312·3 (sd 237) g for men aged 18–64 years, which is significantly higher than the mean consumption of 272·2 (sd 220) g for women of the same age and is also significantly higher than the average 187·7 (sd 151) g for elderly people (P < 0·05). Moreover, the consumption by women is significantly higher than the consumption by the elderly. Tuna is the most consumed canned product in all the groups, and salmon is the most consumed smoked product. Paella and fish soup are widely consumed in all the population groups, though with a marked preference for soup among elderly people.
For total products, significant differences between the average consumption levels are observed between the study zones for all the groups studied. In particular, consumption levels in Toulon are higher than in the other regions (P < 0·05, not presented).
Fatty acid intake
Fatty acid intakes through fish and seafood consumption for the four study zones and for each group are presented in Table 4. One should bear in mind that they do not correspond to fatty acid intakes through the total diet; however, marine products are the main source of n-3 LC PUFA as explained in the introduction section. Average EPA intakes are 419–517 mg/d for adult males and 403–509 mg/d for adult females; DHA intakes are 739–960 mg/d for men and 713–885 mg/d for women.
Table 4 Mean dietary intake of fatty acids from fish and other seafood (mg/d)

DPA, docosopentaenoic acid; AM, adult men; AW, adult women; OS, older subjects; WCA, women of childbearing age.
Table 5 shows that the main contributors to n-3 PUFA exposure are salmon (26·6 %), mackerel (11·5 %), sardine (9·53 %), and anchovy and herring (about 5 %). Salmon consumption contributes on average to 66·2 % of the RDI of EPA and DHA (500 mg/d), mackerel to 28·0 % and sardine to 23·8 %. Indeed mackerel, sardine and salmon are major contributors (>5 %) in all four study zones, providing 7–16 %, 6–17 % and 24–31 %, respectively, of the intake (details per area not presented). Herring, another oily fish, accounts for at least 5 % of the intake only in Le Havre and La Rochelle, while anchovies contribute to more than 5 % of n-3 LC PUFA intake in Lorient and Toulon.
Table 5 Contributors to the average intake of n-3 PUFA (ALA, C18 : 4 n-3, EPA, DPA and DHA) in % of contribution – mean values for all subjects and all areas

ALA, α-linolenic acid; DPA, docosopentaenoic acid.
*For these species the different packaging forms are taken into account: herring: fresh and canned, mackerel: fresh, canned and smoked, sardine: fresh and canned, salmon: fresh and smoked, tuna: fresh and canned, anchovy: fresh and canned, crab: fresh and canned, haddock: fresh and smoked.
Discussion
The amounts of consumed fish and seafood in the CALIPSO study were compared with those of INCA (French national dietary survey in 1999). The consumption levels in the CALIPSO study are about 2·5 times higher than for the average consumers of the INCA survey for fish, mollusc and crustacean consumption, and about 1·5 times higher for the other products. For the total consumption of these products, a factor of about 3·5 is observed between the two studies, which demonstrates that our study’s objective of targeting high fish and seafood consumers was effectively reached.
Concerning total LC PUFA and DHA, the French RDI are well covered in the studied population, regardless of age and gender (P < 0·0001 for all groups for DHA and LC PUFA). For example, for women of childbearing age, the average intake of DHA is 757 (sd 633) mg/d. Regarding this particular group of women, in the four study zones fish and seafood consumption alone provide average intakes largely exceeding the RDI of DHA and LC PUFA for adult females (400 mg LC PUFA of which 100 mg is DHA) and pregnant women (1000 mg LC PUFA of which 250 mg is DHA). The intakes of n-3 LC PUFA and especially EPA and DHA are also much higher than that of the American population, which do not exceed 200 or 300 mg EPA and DHA per day(Reference Jonnalagadda, Egan, Heimbach, Harris and Kris-Etherton28–Reference Hibbeln, Nieminen, Blasbalg, Riggs and Lands30).
Compared with other high seafood consumers, for the four study zones, n-3 LC PUFA intakes are lower than the estimated intakes of the Inuit, and of the same order of magnitude as the Japanese population(Reference Hibbeln, Nieminen, Blasbalg, Riggs and Lands30–Reference Dewailly, Blanchet, Lemieux, Sauvé, Gringas, Ayotte and Holub32). The variability between individuals is also consistent with the results found in the literature.
Generally speaking, in all zones, and irrespective of the age group and gender considered, the average EPA + DHA intake remains below the upper limit of EPA + DHA intake of 2 g/d (P < 0·0001 for all groups) proposed by the Agence Française de Sécurité Sanitaire des Aliments in 2003(2). Fourteen per cent of the subjects exceed this recommendation, through fish and seafood consumption alone. However, given the rarity of available data, this limit is not considered to be an intake beyond which a health risk might appear, but rather an intake beyond which there is no proven nutritional benefit. Moreover, some studies have shown the beneficial effect of EPA + DHA intake exceeding 3 or 4 g/d(Reference Breslow4, Reference Hibbeln, Nieminen, Blasbalg, Riggs and Lands30).
Results show that the average EPA + DHA intake exceeds the 1 g/d recommended for patients with documented CHD by the American Heart Association (P < 0·0001) and, in fact, this intake significantly exceeds the ISSFAL recommendation of 500 mg/d for each sub-group of population, including women of childbearing age (P < 0·0001 for each group). Actually, 84 % of individuals have EPA + DHA intakes exceeding this recommendation of 500 mg/d. The people with an EPA + DHA intake lower than 500 mg/d consume fish and seafood at least twice weekly, which therefore qualifies them as high consumers. Their low intake of n-3 LC PUFA is explained by the fact that they consume products containing small amounts of these fatty acids, on average 596 g of fish and seafood products per week including 52 g of oily fish (8·7 % of total fish and seafood), v. 1277 g of fish and seafood including 277 g of oily fish (21·7 %) for people whose intake exceeds the recommendations. Considering the average value of EPA + DHA in oily fish, which corresponds to 22·5 mg/g, an individual has to consume 150 g of oily fish per week to reach the international recommendation of 500 mg/d. Therefore, the consumption of fish twice weekly including one serving of oily fish complies with the French National Nutritional-Health Programme recommendations.
The results provided in Table 5 are important to be taken into account by national agencies when they propose recommendations. For instance, on the one hand, in France pregnant women are recommended to eat fish twice weekly without excluding oily fish. On the other hand, they are recommended not to eat some predator fish such as swordfish, marlin and siki because of their high methylmercury levels. The scientific assessment bodies have to be coherent in their recommendations; they must not recommend some species for their nutritional benefits and to advise against the same products because of the risk. That is the reason why it is important to have a better knowledge about the fish species: on the one hand, knowledge on the beneficial nutritional contributors, and on the other hand, on the major contributors to contaminant exposure.
At this stage, only a descriptive analysis of the benefits of daily n-3 PUFA consumption regarding health could be performed, based on existing recommendations and published epidemiological data, but without correlating the impact on the health of our population. Nevertheless, the recommendation on fish consumption should be integrated into a larger discussion on the validity or the re-assessment of the nutritional recommendation concerning n-3 PUFA. A working group of the French Food Safety Agency initiated an update of the French nutritional recommendations on fatty acids published in 2001. Our data on fish, as a source of n-3 LC PUFA, should be taken into account when consequently translating these future updated fatty acid recommendations into food consumption frequency and into food-based dietary recommendations. Such a discussion should then integrate some points such as the link between health and physiological status of n-3 LC PUFA, and then the link between PUFA intake and biology, i.e. biomarkers of intake such as EPA and DHA in blood(Reference Harris33), which need further investigation and will be the topic of another paper.
Conclusion
The CALIPSO survey is the first one in France that focused on French high seafood consumers. The main inclusion criteria allowed us to reach the expected target population, since the participants consume fish or seafood at least twice weekly. The results showed that this quantity (i.e. at least twice weekly) allowed them to reach the recommended intakes of n-3 LC PUFA with some variations between regions or subgroups of the population and demonstrated the validity of the French National Nutritional-Health Programme recommendations concerning fish consumption.
Acknowledgements
Funding source: The authors would like to thank the General Directorate for Foods of the French Ministry of Agriculture and Fisheries for its financial support.
Conflict of interest: No conflicts of interest.
Author contributions: N.B. was responsible for the fish and seafood consumption survey in the CALIPSO study, V.S. was responsible for the survey on lipid and fatty acid composition and their intake, J.C.L. was the coordinator of the whole study and J.L.V. the supervisor.
Acknowledgements: The authors would like to thank the National Institute for Agricultural Research for its administrative support. The authors also express their particular gratitude to all the participants in the CALIPSO survey without whose support this study would not have been possible.


