


Introduction
The burden of malnutrition in the form of overweight and obesity, nutrient deficiency and preventable diet-related non-communicable diseases (NCD) is significant and worsening worldwide(1, 2). In particular, unhealthy diet is one of the four major behavioural risk factors for NCD in all WHO regions(Reference Alwan3), with the European region proportionately suffering the greatest NCD burden. In Europe, the four most common NCD account for 77 % of disease and almost 86 % premature mortality(1), and overweight and obesity affect a third of children aged 11 years(4). Childhood obesity has negative health impacts and is associated with educational underachievement, low self-esteem and increased obesity risk in adulthood(5).
National diet surveys (NDS) have an important role in assessing dietary patterns and intakes in the whole population and informing relevant policy decisions; the WHO European Food & Nutrition Action Plan(1) explicitly encourages member states to ‘strengthen and expand nationally representative diet and nutrition surveys’. However, NDS provision across Europe is inconsistent. A recent review found that less than two-thirds (thirty-four out of fifty-three) of WHO Europe countries have nationally representative NDS, and that the majority of gaps lie in Central and Eastern European countries (CEEC)(Reference Rippin, Hutchinson and Evans6). This is concerning, as nutrition policies in these countries may therefore lack an appropriate evidence base.
Novaković et al. (Reference Novaković, Cavelaars and Bekkering7) examined selected micronutrient intakes in CEEC compared with other European countries and found that CEEC lacked intake data across all ages, particularly in children. The aforementioned recent review by Rippin et al. (Reference Rippin, Hutchinson and Evans6) showed that under a third (seventeen out of fifty-three) of European countries reported energy and nutrient intakes for children aged<18 years from NDS conducted post-2000(Reference Rippin, Hutchinson and Evans6). This finding is not surprising, as data of this kind are limited. The Global Dietary Database houses information on food and nutrient consumption levels before 2010 in countries globally, but has limited nutrient data, includes some regional rather than national surveys and does not currently cover children(Reference Del Gobbo, Khatibzadeh and Imamura8). Merten et al. (Reference Merten, Ferrari and Bakker9) reviewed methodological characteristics and heterogeneity in European NDS, but also included regional child surveys. However, the surveys were limited to European Union member states, only included surveys employing certain dietary assessment methods and did not discuss nutrient intakes.
Despite this lack of data, nutrition and health surveys remain the main source of information on dietary risk factors. For example, a systematic analysis of disease risk in twenty-one regions worldwide between 1990 and 2010 was conducted based on information collated from NDS(Reference Lim, Vos and Flaxman10). Such data are also used to inform policy and identify food and nutrients of most concern. For example, Volatier et al. (Reference Volatier, Biltoft-Jensen and De Henauw11) used NDS to compile a reference list of indicator foods to be used for the validation of nutrient profiling schemes – a policy tool to categorise foods according to their nutritional composition to aid disease prevention and health promotion. These examples demonstrate the importance and range of use that NDS can have in monitoring population diet quality and health, and gathering information on which to base disease–risk prevention policies and address childhood obesity. NDS can help monitor NCD risk factors and malnutrition, identify specific areas of concern, highlight inequalities and evaluate policy impact, thereby ultimately contributing to the promotion of best practice for nutritional health across the region(1).
A comprehensive, up-to-date review of total nutrient intakes across different European child populations is therefore needed, which could identify where in Europe there is a need to improve diets and whether inequalities exist. In a manner consistent with that published for adults(Reference Rippin, Hutchinson and Jewell12), the present review aims to examine macro- and selected micronutrient intakes in children across the WHO European region via the latest NDS for which nutrient intake data are available, with reference to age-appropriate WHO recommended nutrient intakes (RNI).
Methods
Identifying national diet surveys
The methods for identifying and accessing NDS have been reported(Reference Rippin, Hutchinson and Evans6). Briefly, authors of national surveys within the WHO European region were identified using listed contact names and other information from two main reports of NDS(13, Reference Micha, Khatibzadeh and Shi14). Where no response was obtained from authors, further general Internet searches were performed on organisations specialising in nutrition to find other potentially useful contact details. Additionally, country responses to WHO Global Nutrition Policy Review 2017 questionnaires were mined to obtain relevant references. Contacts identified were asked to complete a questionnaire to provide information on nationally representative dietary surveys conducted on adults or children at an individual level since 1990, including links or references to relevant reports. For countries without contact details, a systematic database search was performed across Web of Science, MEDLINE and Scopus for nationally representative dietary surveys of adults and children that collected data at an individual level from 1990 to June 2016. Papers returned were screened for relevance according to the criteria in Table 1.
Table 1 Survey inclusion and exclusion criteria
We found 109(Reference Rippin, Hutchinson and Evans6) (and have subsequently added recent releases to make 110) nationally representative surveys that collected data on whole diets at an individual level since 1990 across thirty-four of the fifty-three countries in WHO Europe; sixty-nine included children, of which forty-nine were conducted since 2000. Further details of all surveys found are presented in Rippin et al. (Reference Rippin, Hutchinson and Evans6).
Data extracted
Where available, estimated energy and nutrient intakes by sex and age group were extracted from the latest NDS collected after 2000. For NDS that provided results including and excluding supplements, the latter was used; where not specified, it was assumed that intakes excluded supplements. For children this was extracted from twenty-one surveys from eighteen countries; the Netherlands had two and Ireland three surveys, which covered different child age groups. Mean values were reported in all cases except Dutch children aged 7–8 years, which used medians – these were extracted and used instead. The eighteen countries were grouped into regions – Western, Northern and Central and Eastern Europe. For some countries (France, Latvia, the Netherlands and Spain), more recent surveys had been conducted, but intake data were not yet available. Energy intakes reported in kcal were converted to MJ for consistency across studies. Appendix 1 and Appendix 2 list the availability of selected nutrients reported from the latest surveys collected after 2000.
All macronutrients reported by the twenty-one surveys were included in the data extraction (see Table 2), but micronutrients extracted (see Table 3) were limited to those explicitly mentioned in the WHO European Food and Nutrition Action Plan(1) as being currently important to population health in the region. See Appendix 1 and Appendix 2 for all nutrient intakes extracted.
Table 2 Macronutrients of interest in dietary surveys and corresponding WHO recommended nutrient intake (RNI)
N/A, not applicable; %E, percentage energy; TFA, trans-fatty acids.
Table 3 Micronutrients of interest in dietary surveys and corresponding WHO recommended nutrient intake (RNI)
* RNI are derived from the WHO except Fe, K and Na, where UK RNI have been used instead, as WHO Fe RNI values are based on different bioavailabilities and K and Na values are downweighted based on energy requirements for children relative to adults.
WHO RNI were used to assess intake adequacy in the population majority and highlight areas of concern in the absence of raw NDS data from sufficient countries to determine the prevalence of inadequacy in relation to the percentage of the population below the estimated average requirements. The exception was energy, where RNI changed in yearly increments, so were not sufficiently compatible with survey age groupings(15–20). Additionally, WHO RNI for Fe are given for different bioavailabilities, so UK Reference Nutrient Intakes (RNI) were used instead(21). UK RNI were also used for K and Na, as WHO RNI recommend downweighting values based on energy requirements for children relative to adults. The RNI for MUFA is calculated by the difference between total fat and the sum of SFA, PUFA and trans-fatty acids (TFA), so has not been included. The WHO RNI for free sugars(19) has been adopted as the RNI for added sugars, as no WHO RNI exists for added sugars, yet the majority of surveys that reported sugars used the added rather than free sugar definition. The added sugars definition is similar but more restrictive to that of free sugars, meaning that free sugar intake would not be overestimated. Depending on the nutrient, RNI were variously maximum, minimum or target amounts (see Tables 2 and 3).
Energy and selected nutrient intakes reported by age group and sex in these latest surveys collected after 2000 were graphed. To harmonise the data where possible, units of measurement were converted to common standard units. Omega-3 (n-3) and omega-6 (n-6) fatty acids were reported variously in surveys, including n-3, n-6, linoleic acid and α-linolenic acid in g/d and percentage energy (%E) and EPA+DHA in mg/d. These were converted to g and %E and grouped into n-3 and n-6 fatty acids for clarity. ‘Added sugars’ is used as a proxy term for sucrose, as the countries reporting this nutrient typically referred to it as ‘added sugars’ or did not specify.
Additionally, estimated mean intakes by sex for two age groups split roughly by those aged<10 years and≥10 years (to 18 years) were determined for each country, and also for European regions and Europe overall. This cut-off was chosen because 10 years was a common boundary for RNI split by age. Age ranges for reported and extracted means that spanned the 10-year cut-off contained a larger proportion of≥10-year-olds in all cases, so were allocated to that group. This occurred in seven countries (Cyprus, Ireland, Latvia, the Netherlands, Spain, Turkey and the UK), where only Latvia included children aged<9 years (7–16 years). The UK 4- to 10-year age group was included in the<10 years group. Some countries did not separate by sex in the youngest ages – in these instances the same mean intake was used for both girls and boys. Where mean intakes were reported by a country for more than one age group<10 years, or more than one age group≥10 years, the numbers of children/adolescents surveyed in the NDS in each age group were used to weight the reported means to produce estimated mean intakes for those aged<10 years and≥10 years. For instance, mean intakes for Belgium were reported and extracted for 3- to 5-year-olds, 6- to 9-year-olds, 10- to 13-year-olds and 14- to 17-year-olds; the mean intake reported for boys aged 3–5 years was multiplied by the number of boys surveyed for that age group, and added to a similar calculation for the 6- to 9-year-olds; the sum of these was then divided by the total number of boys aged<10 years to produce an estimated mean for<10 years for Belgium. Where countries had multiple NDS (Ireland, the Netherlands), age ranges ran concurrently rather than overlapping, so the NDS were grouped and used to estimate the mean intakes for those aged<10 years and≥10 years as described above. The mean intakes for each European region and Europe overall were estimated by multiplying the<10 years or≥10 years means for each country and sex by the national population aged<19 years for each country(22–24). The resulting value for each country was summed and then divided by the total sum of the national child populations in each European region, then Europe as a whole. The same population values were used for both the<10 years and≥10 years groups, assuming similar population ratios. These population weightings made the estimated means roughly generalisable to the European regions and Europe as a whole.
Characteristics of the twenty-one surveys were also extracted and tabled; these were: country name, survey name, year of survey (data collection), source, sample size, age range, dietary methodology and the nutrient reference database underpinning the survey. The number and percentage of WHO RNI not met were recorded for the nutrients and sex/age groups for which they were reported. Where reported, surveys presenting nutrient intakes by socio-economic group based on social class, income (continuous or grouped), occupation and education level were also noted.
Results
Data extracted
The scope of NDS coverage across Europe has previously been documented(Reference Rippin, Hutchinson and Evans6). Energy and nutrient intakes (excluding supplements) for children aged ≤18 years were extracted from twenty-one surveys across eighteen countries from three regions: two of five Northern European countries (Denmark, Norway); ten of seventeen Western European countries (Austria, Belgium, France, Germany, Ireland, Italy, The Netherlands, Portugal, Spain, UK) and six of thirty-one CEEC (Bulgaria, Cyprus, Estonia, Latvia, Slovenia, Turkey). Table 4 shows the characteristics of these surveys. Child energy and nutrient intakes could not be extracted for 66 % (thirty-five) of European countries for various reasons, from lack of availability to incompatible age-group structure. Nineteen of these countries, mainly CEEC, had no identifiable nationally representative survey, making up over a third of WHO Europe countries. The Andorran NDS surveyed children, but the lowest age group (12–24 years) spanned adults and children, so intake data were not included in the results or graphs.
Table 4 National diet surveys across countries in WHO Europe 2000–2016 with reported nutrient intakes for children and adolescents
SEG, socio-economic group; Y, yes; N, no; RNI, recommended nutrient intake; USDA, United States Department of Agriculture; FPQ, Food preference questionnaire.
* 1=email contacts; 2=general Internet searches; 3=Micha et al. (Reference Micha, Khatibzadeh and Shi14); 4=WHO Global Nutrition Policy Review 2017 extracted information.
† Countries that have reported nutrient intakes by SEG in addition to age and sex.
‡ The right values in parentheses provide the number of RNI not met by each age/sex group out of a total number of RNI for age/sex group for each nutrient reported by that country. The left value is this as a percentage.
All twenty-one NDS that reported nutrient intakes included energy; however, Latvia reported no other macronutrients. The majority (n 20) reported protein, carbohydrate and fat intakes and most reported fibre intakes (n 19) (see Table 5). Most NDS included intake data on saturated fats (n 19), and MUFA and PUFA (n 18). However, less than half (n 7) NDS included TFA intakes. Most NDS (n 16) included either total or added sugars/sucrose; however, six NDS included neither. Just over half the countries included either n-3 (n 7) or n-6 (n 7) fatty acid intakes in some form; six NDS included both.
Table 5 Estimated means for<10 years and≥10 years by country and region for macronutrients in twenty-one national dietary surveys in the WHO Europe regionFootnote *
CHO, carbohydrates; TFA, trans-fatty acids; CEEC, Central and Eastern European countries.
* Where mean intakes were reported by a country for more than one age group<10 years, or more than one age group≥10 years, the numbers of children/adolescents surveyed in the national diet survey for each age group and sex were used to weight the reported means to produce estimate mean intakes for those aged<10 years and those aged≥10 years for each nutrient. Countries that span the 10-year boundary are: Cyprus (9–13·9 years); Ireland (9–12 years); Latvia (7–16 years); the Netherlands (9–13 years); Spain (9–12 years); Turkey (9–11 years) and the UK (4–10 years). For each nutrient regional weighted means for North, West and Central and Eastern Europe and Europe overall were calculated by weighting the<10 years and≥10 years country means shown in the table by the total child population in that country(22–24).
Micronutrients were less widely covered by the twenty-one surveys – Spain reported no micronutrient intakes and Latvia only included Na (see Table 6). Ca and Fe were reported by all but two surveys (Latvia and Spain did not), whilst vitamins B12 and D were reported by all but three (Latvia, Spain and Cyprus did not). Iodine was the least reported micronutrient, by just over half (n 11) of the surveys.
Table 6 Estimated means for<10 years and≥10 years by country and region for micronutrients in twenty-one national dietary surveys in the WHO Europe regionFootnote *
CEEC, Central and Eastern European countries.
* Where mean intakes were reported by a country for more than one age group<10 years, or more than one age group≥10 years, the number of children/adolescents surveyed in the national diet survey for each age group and sex were used to weight the reported means to produce estimate mean intakes for those aged<10 years and those aged≥10 years for each nutrient. Countries that span the 10-years boundary are: Cyprus (9–13·9 years); Ireland (9–12 years); Latvia (7–16 years); the Netherlands (9–13 years); Spain (9–12 years); Turkey (9–11 years) and the UK (4–10 years). For each nutrient regional weighted means for North, West and Central and Eastern Europe and Europe overall were calculated by weighting the<10 years and≥10 years country means shown in the table by the total child population in that country(22–24).
Of the twenty-one surveys for which energy and nutrient intakes were extracted, only 38 % (n 8) reported intakes by socio-economic group in addition to age and sex (Estonia, France, all three Irish surveys, Dutch National Food Consumption Survey of young children, Norway, UK).
Energy and nutrient intakes
Means reported here are estimated weighted means for Europe overall for children<10 years and≥10 years (see Tables 5 and 6 for estimated means by energy and nutrients broken down by country/survey); values in parentheses are ranges of sex and age group means provided in the survey reports. Of the nineteen macro- and micronutrients considered, no country other than Slovenia (44 %) met more than half of the WHO RNI in the nutrients and age/sex groups for which they were reported. Though patterns were evident across sex and age, there were no apparent regional trends across Europe.
Energy
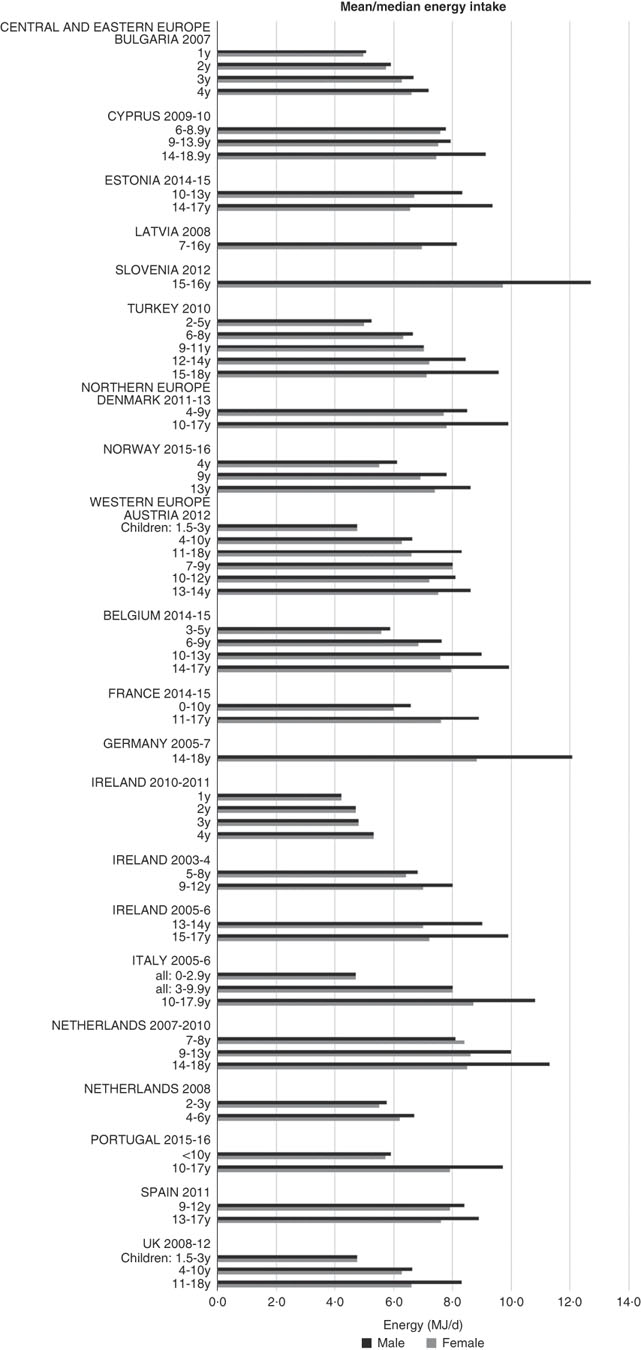
Although age groupings were not consistent across countries, where boys and girls were presented separately, boys’ intakes were generally higher than girls’ and older children had higher intakes (see Fig. 1). The mean energy intake was 6·0 (range 5·3–8·0) MJ and 7·7 (range 6·6–9·4) MJ for girls<10 years and≥10 years, respectively, and 6·3 (range 5·5–8·5) MJ and 9·4 (range 8·2–12·7) MJ for boys.
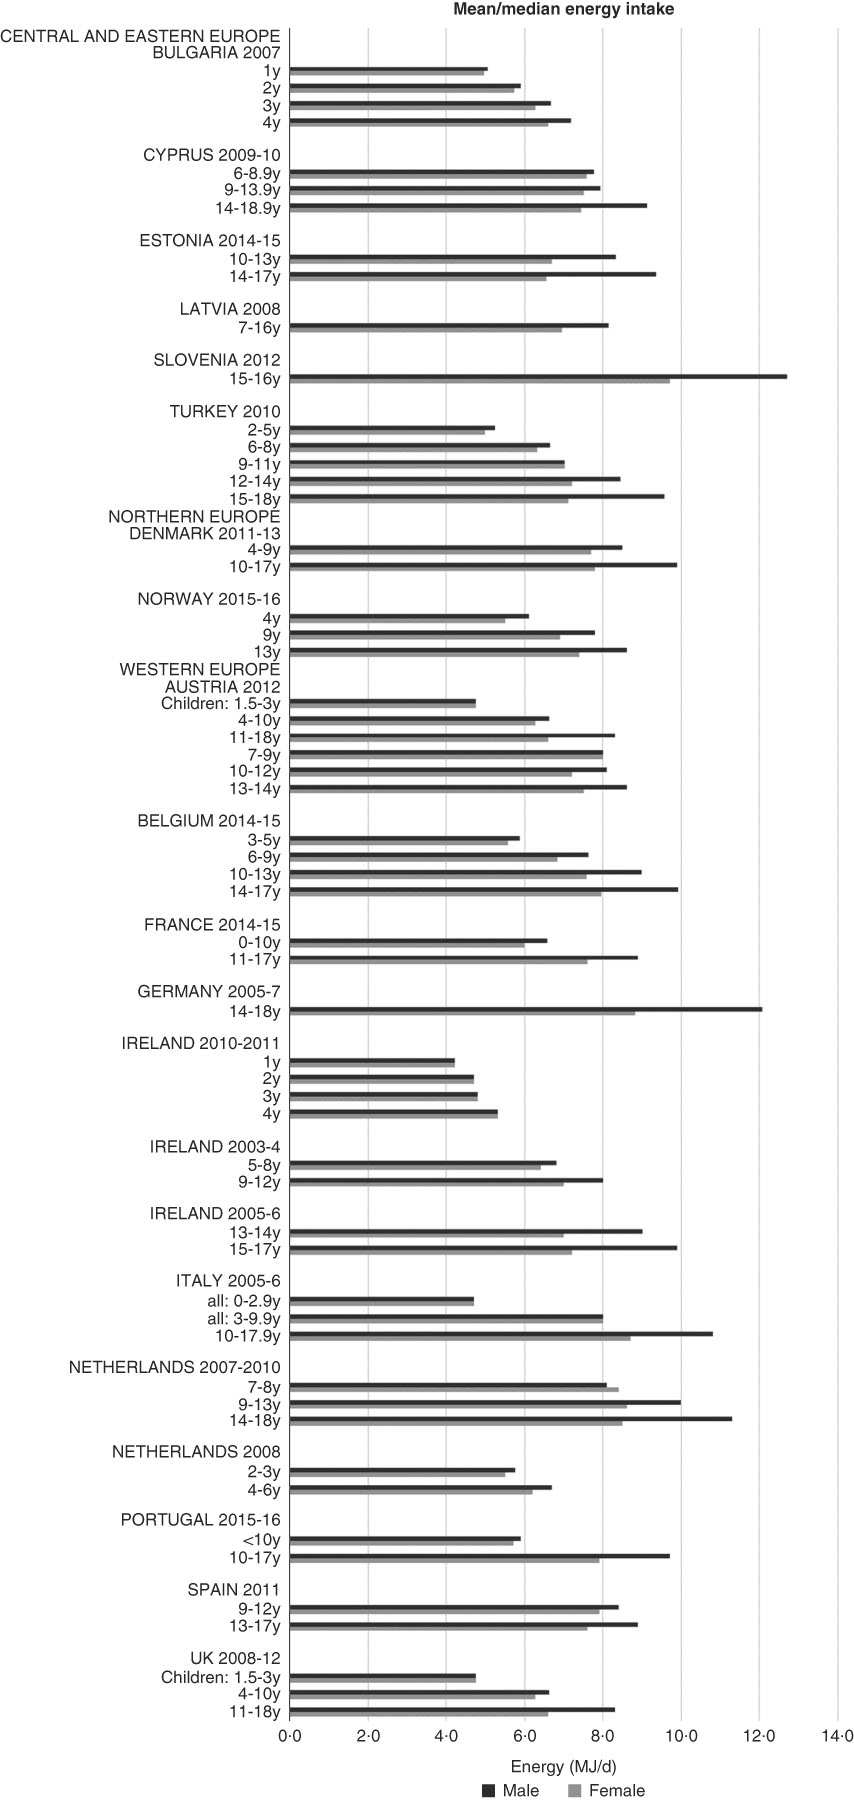
Fig. 1 Mean/median energy intake (MJ/d) (excluding supplements). y, Years.
Macronutrients
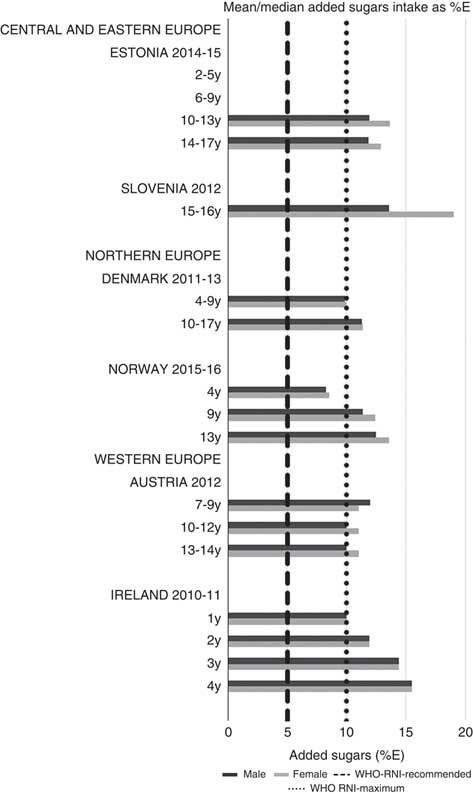
For all macronutrients, where age groups were split by sex, boys generally had higher intakes than girls in all countries except Slovenia, particularly in older children. WHO RNI(15, 21) attainment was universally poor in both sexes across all ages in the majority of macronutrients. The TFA RNI had the highest compliance, with all countries that reported intakes falling below the maximum value. No country fell short of the 10 %E minimum protein value and half the surveys fell between the 10 and 15 %E minimum and maximum boundaries. Only Slovenian teenagers and Dutch young children met the lower 55 %E carbohydrate RNI (Fig. 2). The mean carbohydrate intake was 183 (range 126–255) g and 233 (range 192–379) g for girls aged<10 years and≥10 years, respectively, and 192 (range 126–258) g and 281 (range 211–370) g for boys. Of the six countries that reported added sugars (n 6), Ireland (1 year), Denmark (4–9 years), Norway (4 years) and Austrian boys (10–12 and 13–14 years) had intakes between the recommended 5 %E and maximum 10 %E RNI and all other children exceeded the maximum (Fig. 3). Mean added sugar intakes were 46 (range 25–56) g and 58 (range 48–110) g for girls<10 years and≥10 years, respectively, and 48 (range 25–61) g and 63 (range 49–103) g for boys. Only Slovenian adolescents and German boys (14–18 years) met the 25 g fibre RNI (Fig. 4). Mean fibre intakes were 12 (range 8–19) g and 17 (range 9–31) g for girls<10 years and≥10 years, respectively, and 13 (range 8–21) g and 18 (range 11–28) g for boys.
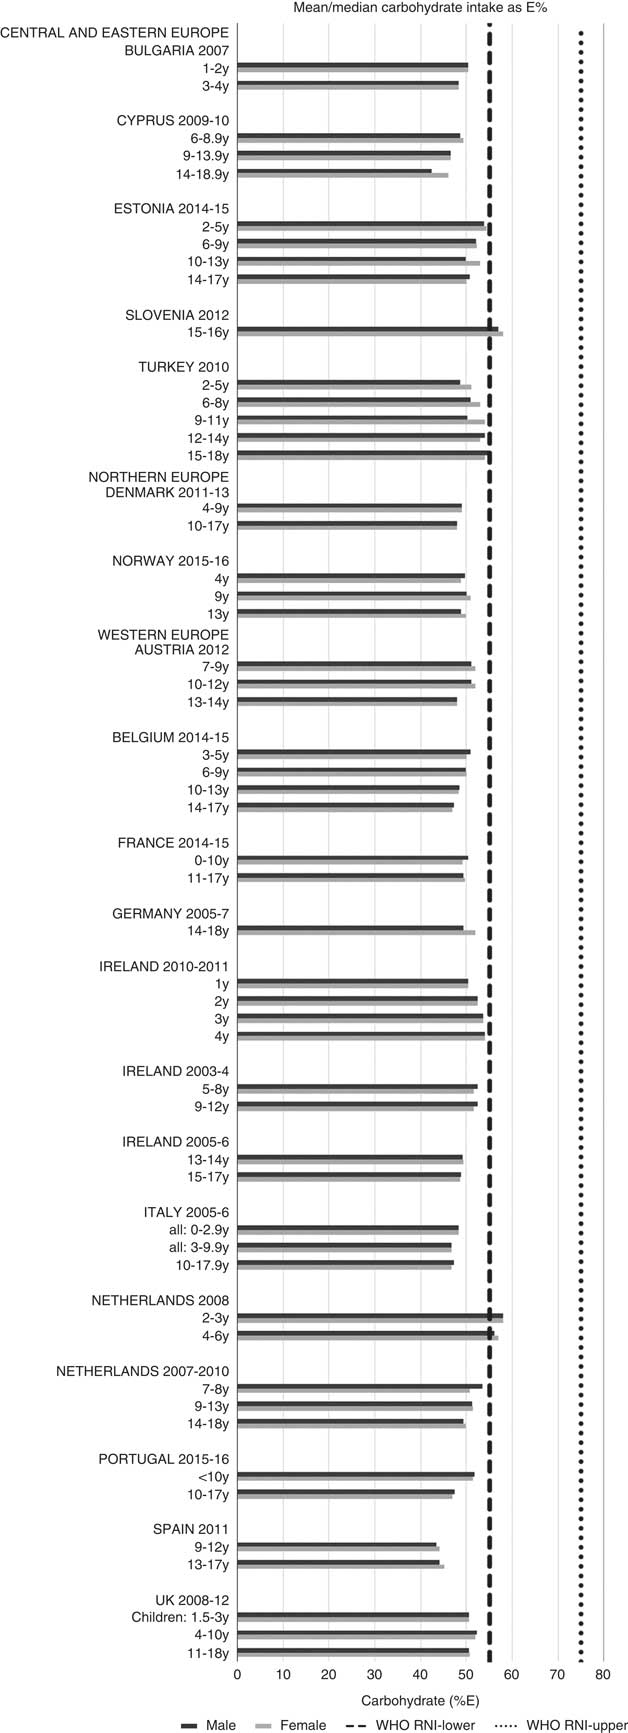
Fig. 2 Mean/median child carbohydrate intake (percentage energy; %E) (excluding supplements). y, Years; RNI, recommended nutrient intake.
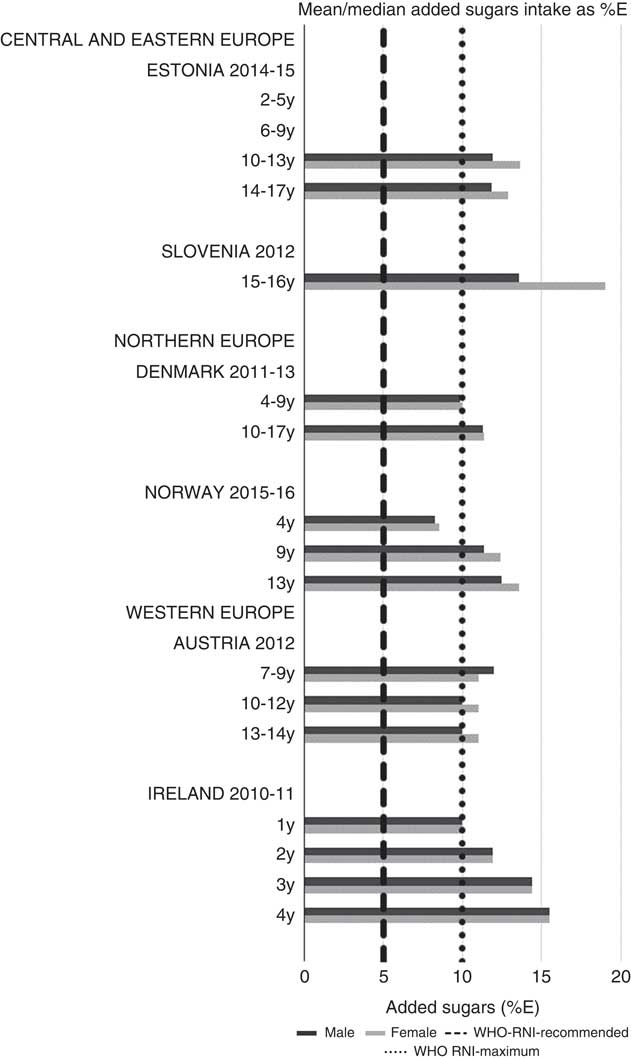
Fig. 3 Mean/median child added sugars intake (percentage energy; %E) (excluding supplements). y, Years; RNI, recommended nutrient intake.
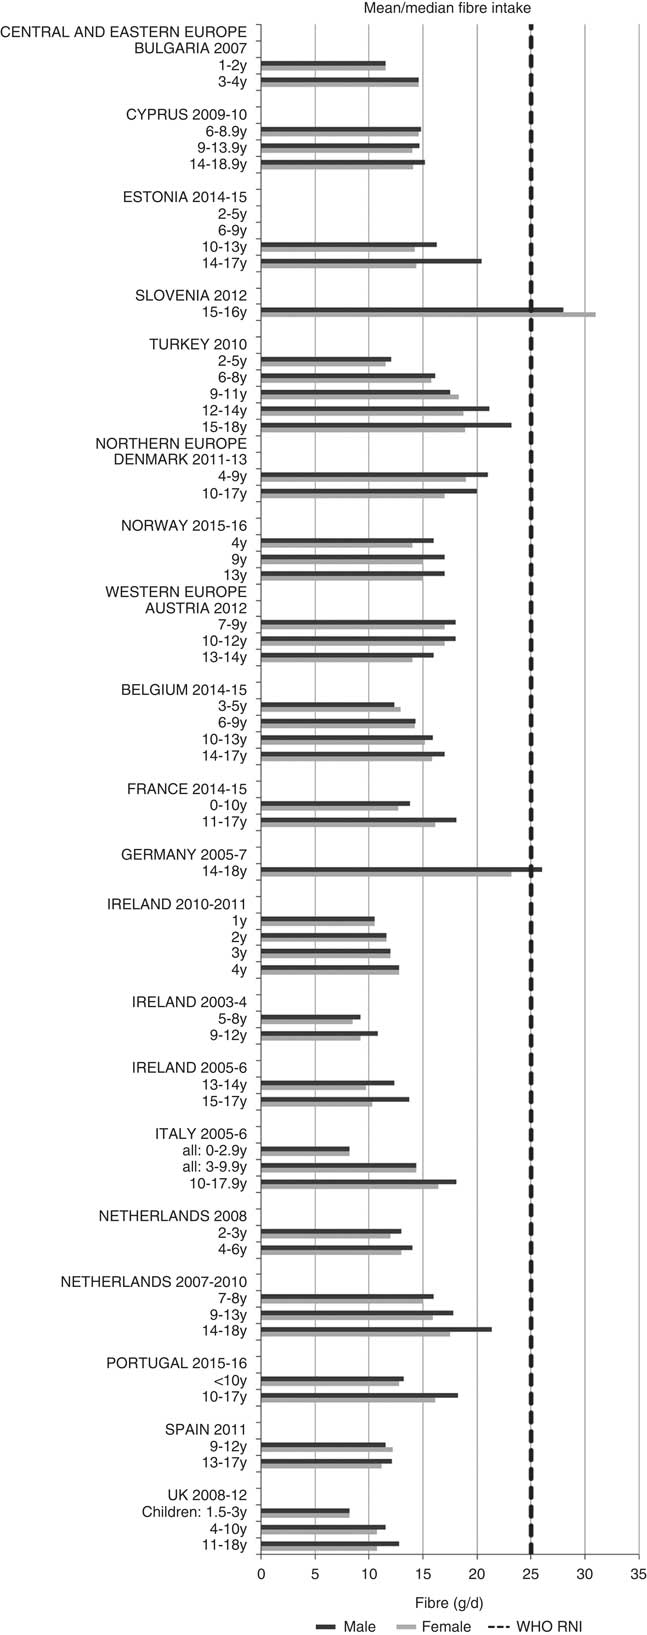
Fig. 4 Mean/median child fibre intake (g/d) (excluding supplements). y, Years; RNI, recommended nutrient intake.
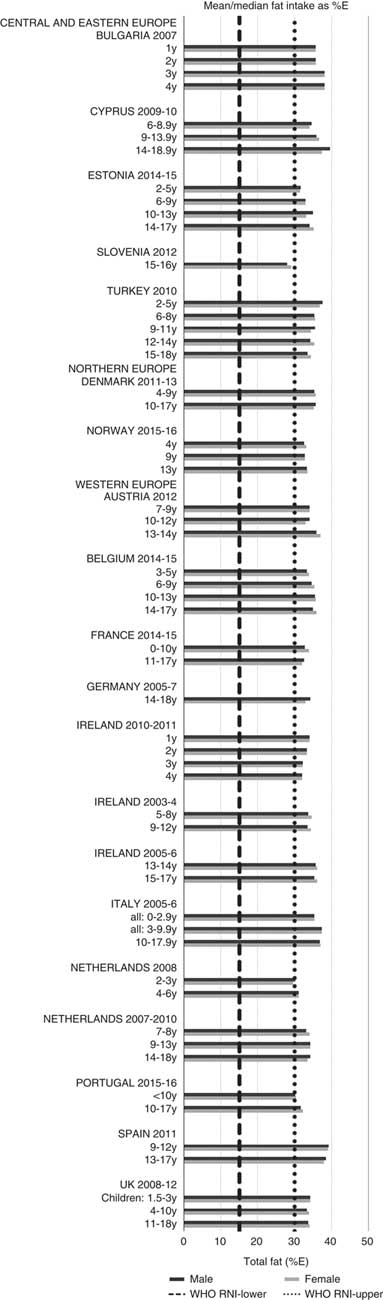
Total fat and saturated fats RNI compliance was particularly poor – all countries in all age groups exceeded the latter and only Slovenia and the Netherlands (2–3 years) had fat intakes below the 30 %E maximum RNI, but these were close to the upper boundary (Figs. 5 and 6). Mean fat intakes were 56 (range 38–80) g and 71 (range 60–148) g for girls<10 years and≥10 years, respectively, and 58 (range 38–80) g and 86 (range 66–177) g for boys. For saturated fats this was 21 (range 14–32) g and 25 (range 16–35) g for girls<10 years and ≥10 years, respectively, and 22 (range 14–34) g and 30 (range 18–38) g for boys. PUFA RNI attainment was mixed, although all countries except Turkey that achieved the RNI were very close to the lower 6 %E boundary (Fig. 7). Mean PUFA intakes were 10 (range 4–17) g for both sexes aged<10 years and 13 (range 9–19) g for girls and 15 (range 10–21 g) for boys aged≥10 years.
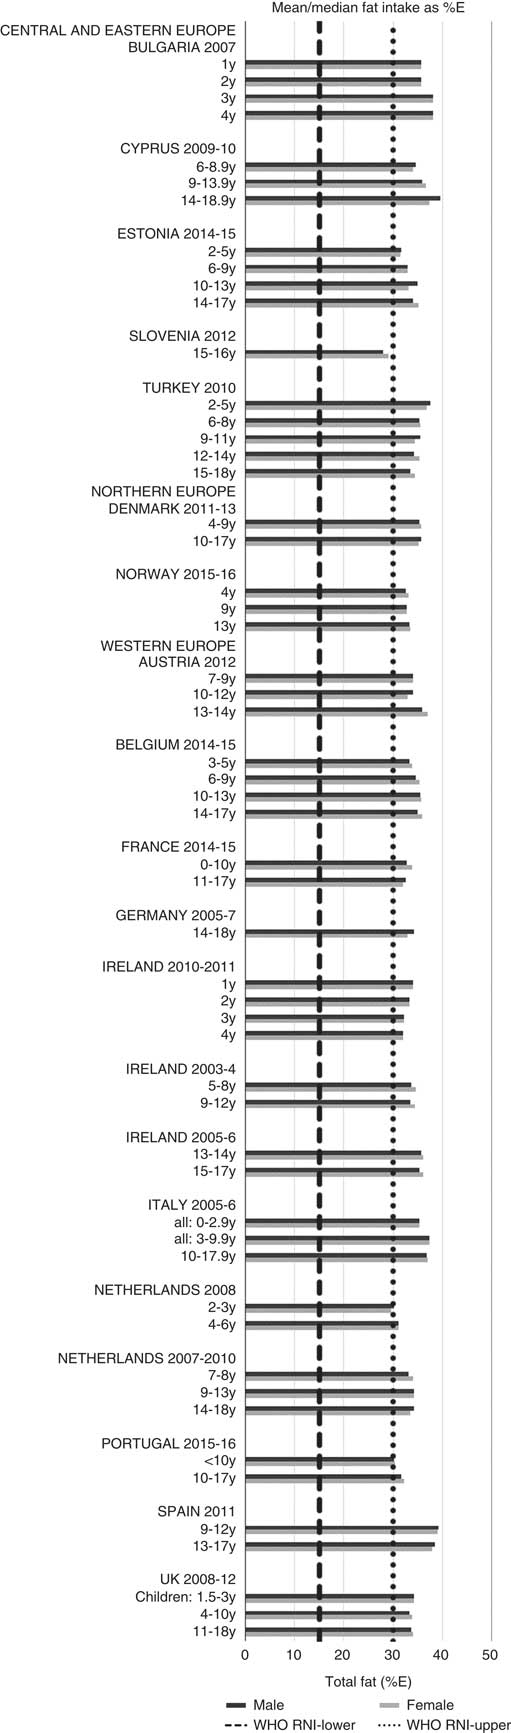
Fig. 5 Mean/median child fat intake (percentage energy; %E) (excluding supplements). y, Years; RNI, recommended nutrient intake.
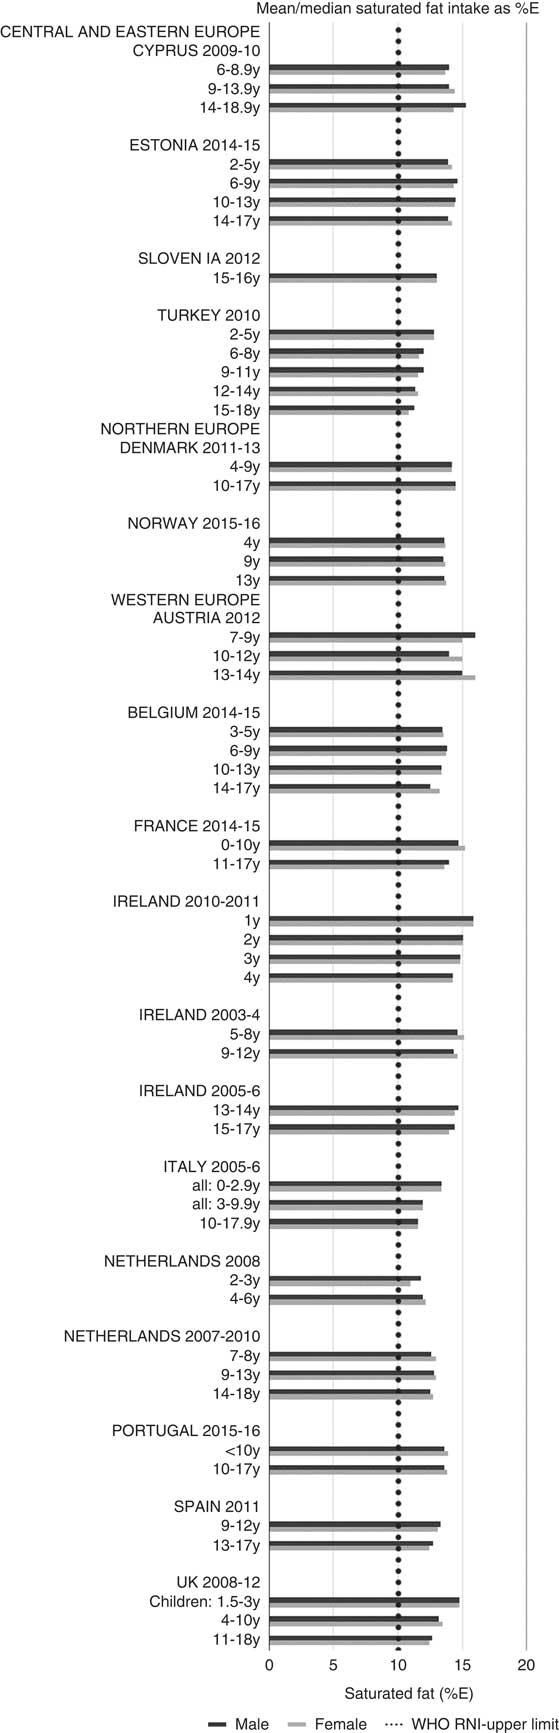
Fig. 6 Mean/median child saturated fat intake (percentage energy; %E) (excluding supplements). y, Years; RNI, recommended nutrient intake.
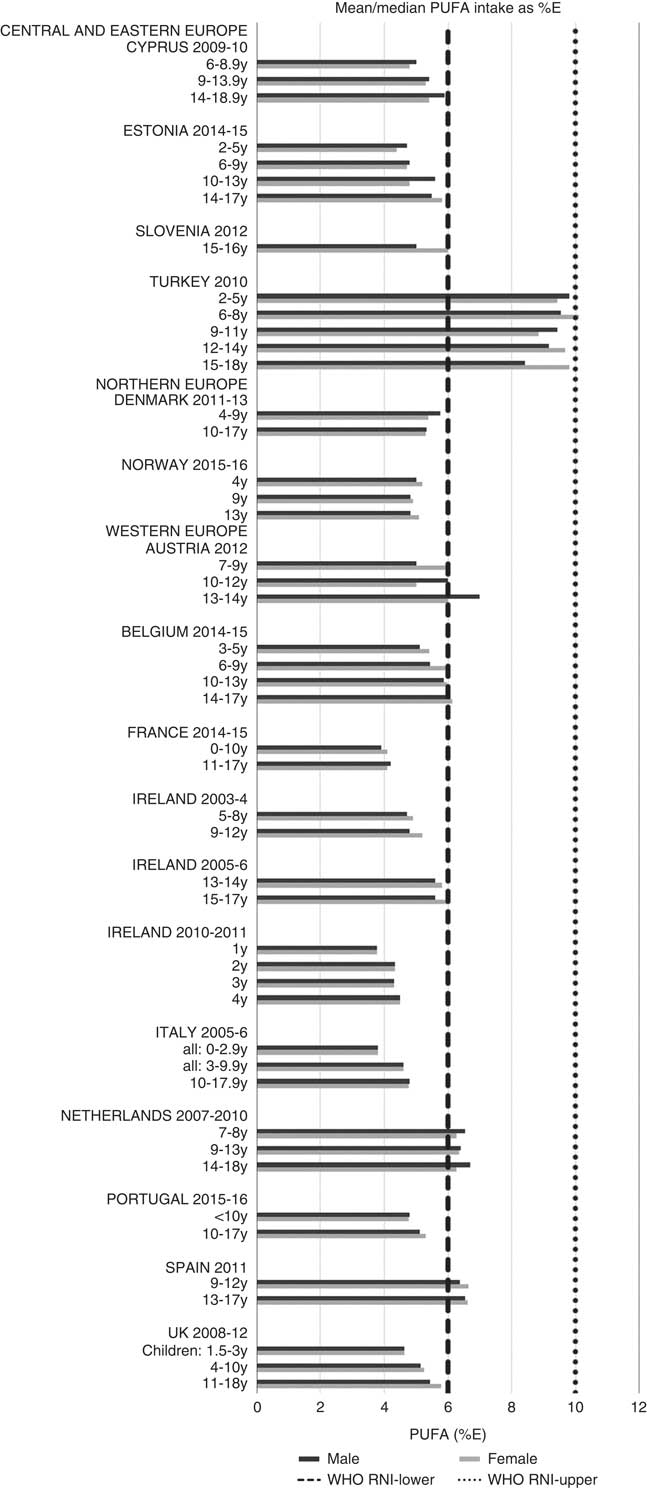
Fig. 7 Mean/median child PUFA intake (percentage energy; %E) (excluding supplements). y, Years; RNI, recommended nutrient intake.
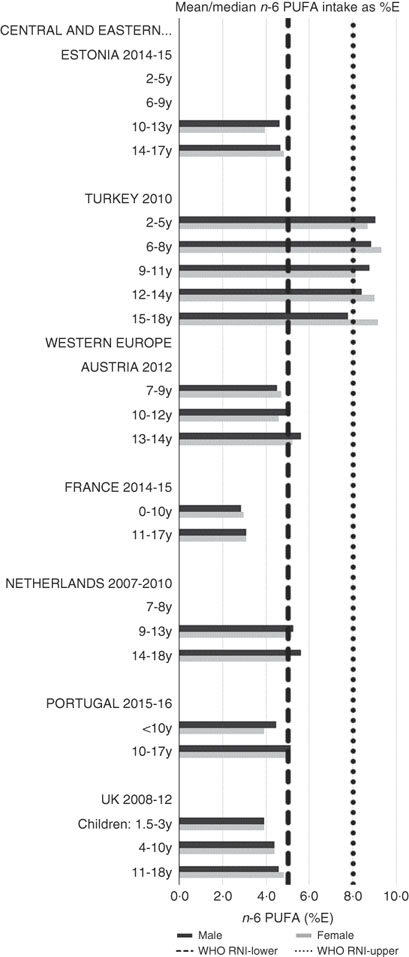
RNI attainment was relatively poor for the seven countries that reported n-3 and n-6 (omega) fat intakes; only Estonian boys (14–17 years) achieved the lower 1 %E n-3 RNI (Fig. 8). Just over half of countries reporting n-6 achieved the lower 5 %E RNI in some age categories (Fig. 9). Turkey was the only country to exceed the upper 8 %E n-6 limit in any age group. Mean n-3 intakes were 1·0 (range 0·5–1·5) g and 1·3 (range 0·5–1·6) g for girls<10 years and≥10 years, respectively, and 1·0 (range 0·5–1·4) g and 1·5 (range 0·5–2·5) g for boys. Mean n-6 intakes were 8·6 (range 3·0–15·6) g and 11·4 (range 3·1–17·3) g for girls<10 years and≥10 years, respectively, and 9·2 (range 2·9–15·6) g and 13·1 (range 3·1–19·7) g for boys.
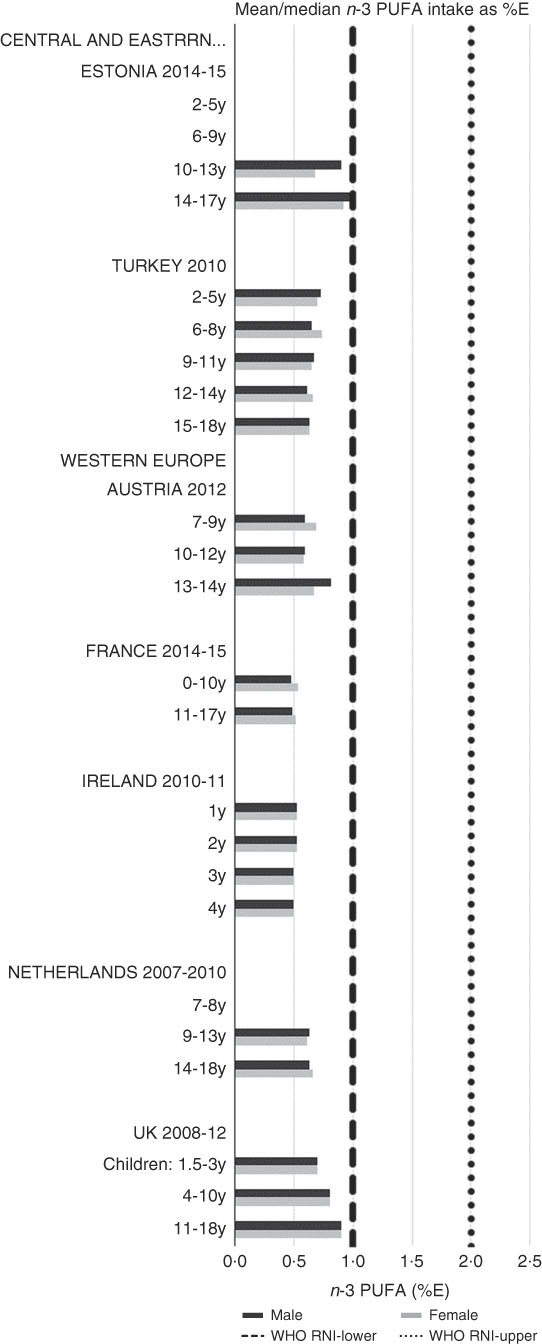
Fig. 8 Mean/median child n-3 PUFA intake (percentage energy; %E) (excluding supplements). y, Years; RNI, recommended nutrient intake.
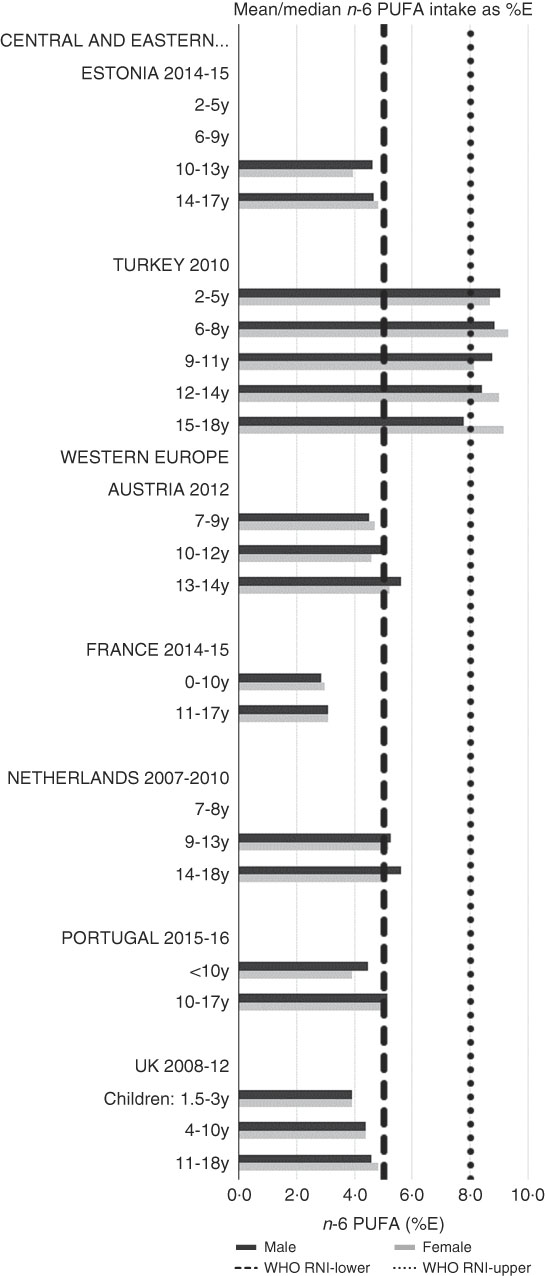
Fig. 9 Mean/median child n-6 PUFA intake (percentage energy; %E) (excluding supplements). y, Years; RNI, recommended nutrient intake.
Micronutrients
Micronutrient RNI attainment(16–18) was better than for macronutrients. Micronutrient intakes are grouped according to RNI compliance and described beginning with those with greatest compliance across the countries and ending with those that demonstrate the greatest shortfall. All micronutrients except vitamin D had age-specific RNI; Fe and Zn also had sex-specific RNI for children aged 10–18 years. RNI compliance was greater in boys and younger children aged <10 years.
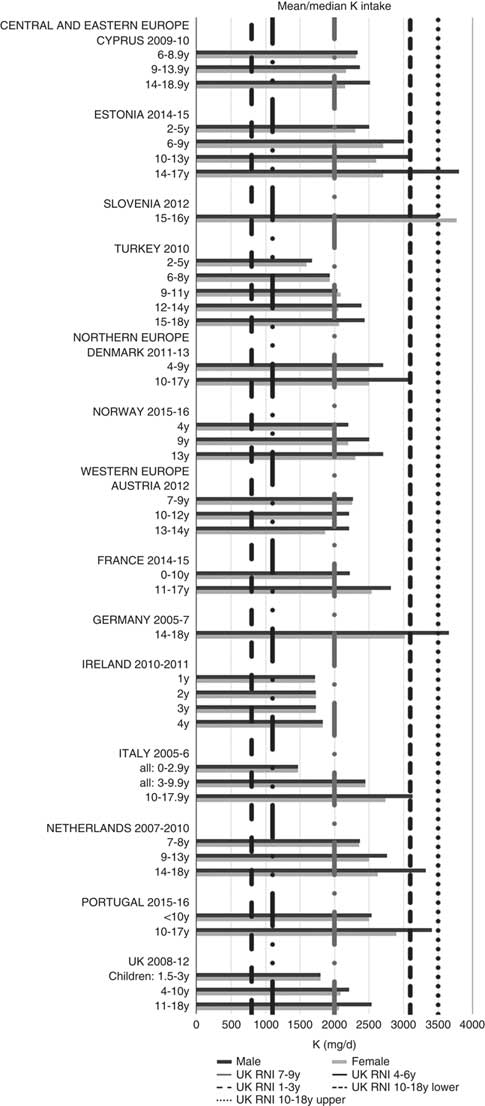
All countries met the vitamin B12 RNI across all ages, with the exception of Turkish adolescent girls. The majority of countries met the Zn RNI across the age groups surveyed; however, attainment gaps were most likely to be in adolescent girls. K and Fe intakes were mixed, but generally poorer in children aged≥10 years and girls, particularly for Fe (Figs. 10 and 11). All countries (except France) fulfilled the K RNI in some age groups and only Slovenian adolescent girls and German and Estonian adolescent boys exceeded the upper 3500 mg RNI. However, no country met the lower K RNI across all childhood stages. Mean intakes were 1974 (range 1471–2700) mg and 2481 (range 1867–3770) mg for girls<10 years and≥10 years, respectively, and 2062 (range 1471–3000) mg and 2768 (range 2039–3800) mg for boys. Bulgaria and France did not achieve the UK Fe RNI(21) in any age group. In other countries lack of compliance with the Fe RNI was dominated by adolescent girls, where only Slovenia achieved the RNI. Boys had slightly higher intakes than girls – mean intakes were 6·6 (range 5·0–10·9) mg and 9·8 (range 7·7–16·0) mg for girls<10 years and≥10 years, respectively, and 7·3 (range 5·0–11·4) mg and 11·8 (range 9·0–16·0) mg for boys. However, boys have lower requirements, resulting in higher RNI attainment.
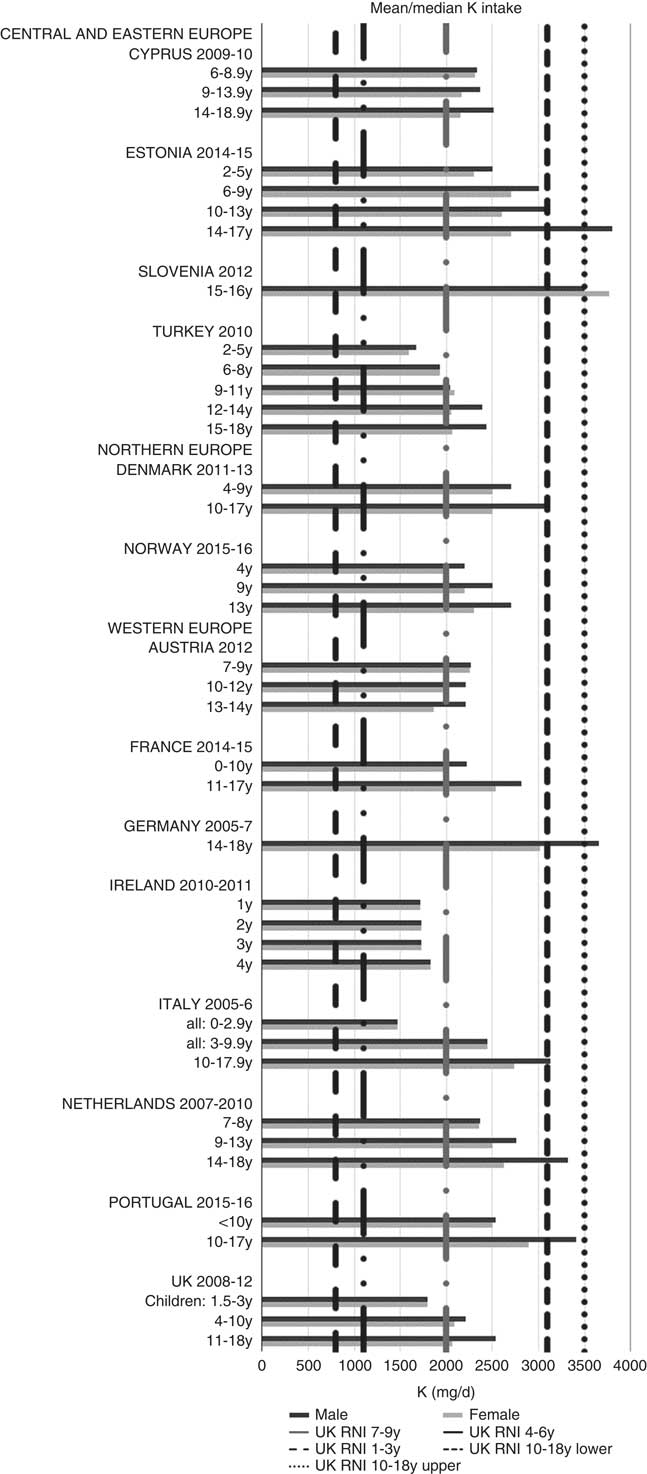
Fig. 10 Mean/median child potassium intake (mg/d) (excluding supplements). y, Years; RNI, Reference Nutrient Intake.
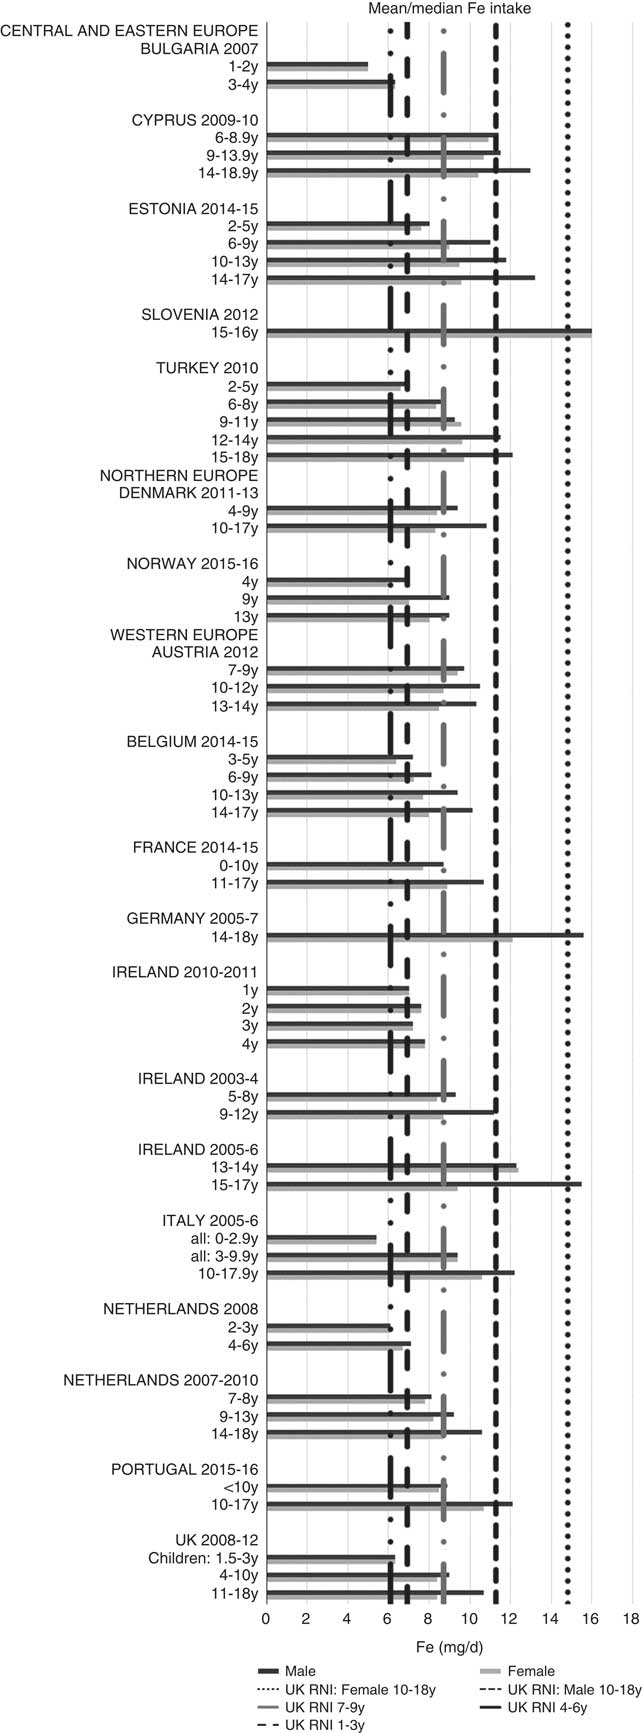
Fig. 11 Mean/median child iron intake (mg/d) (excluding supplements). y, Years; RNI, Reference Nutrient Intake.
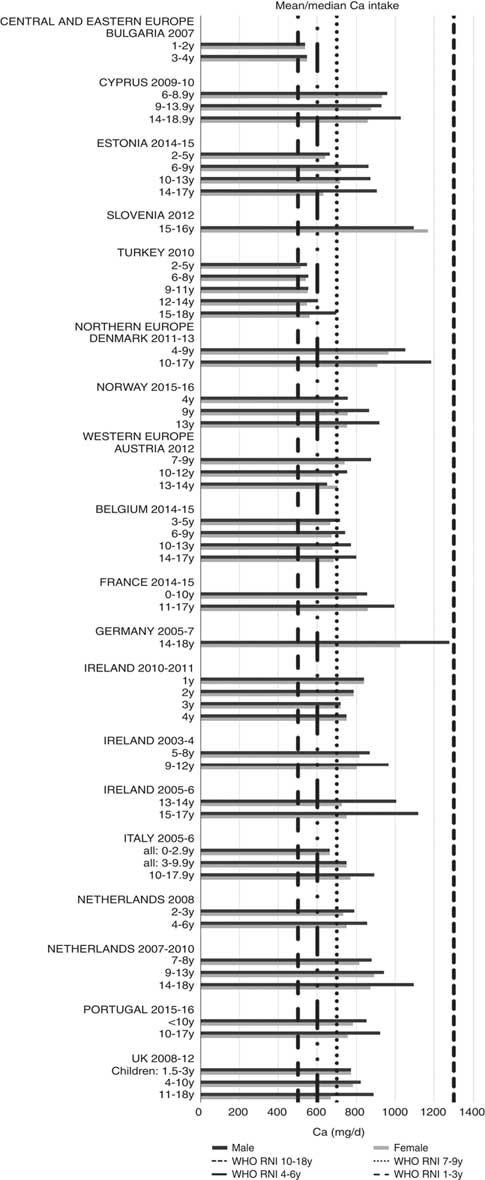
Ca and iodine attainment was also mixed; 75 % countries reporting Ca achieved the RNI in some age groups, though no country had adequate intakes in children aged≥10 years (Fig. 12). Mean Ca intakes were 691 (range 26–1113) mg and 755 (range 545–1167 mg) for girls<10 years and≥10 years, respectively, and 729 (range 515–966 mg) and 903 (range 554–1277 mg) for boys. Three of the ten countries reporting iodine (Turkey, Austria, France) did not achieve the RNI in any age group (Fig. 13); of the remainder, attainment was spread across age groups. Mean intakes were 93 (range 44–272) µg and 109 (range 52–213) µg for girls<10 years and≥10 years, respectively, and 99 (range 47–283) µg and 137 (range 53–249) µg for boys.

Fig. 12 Mean/median child calcium intake (mg/d) (excluding supplements). y, Years; RNI, recommended nutrient intake.
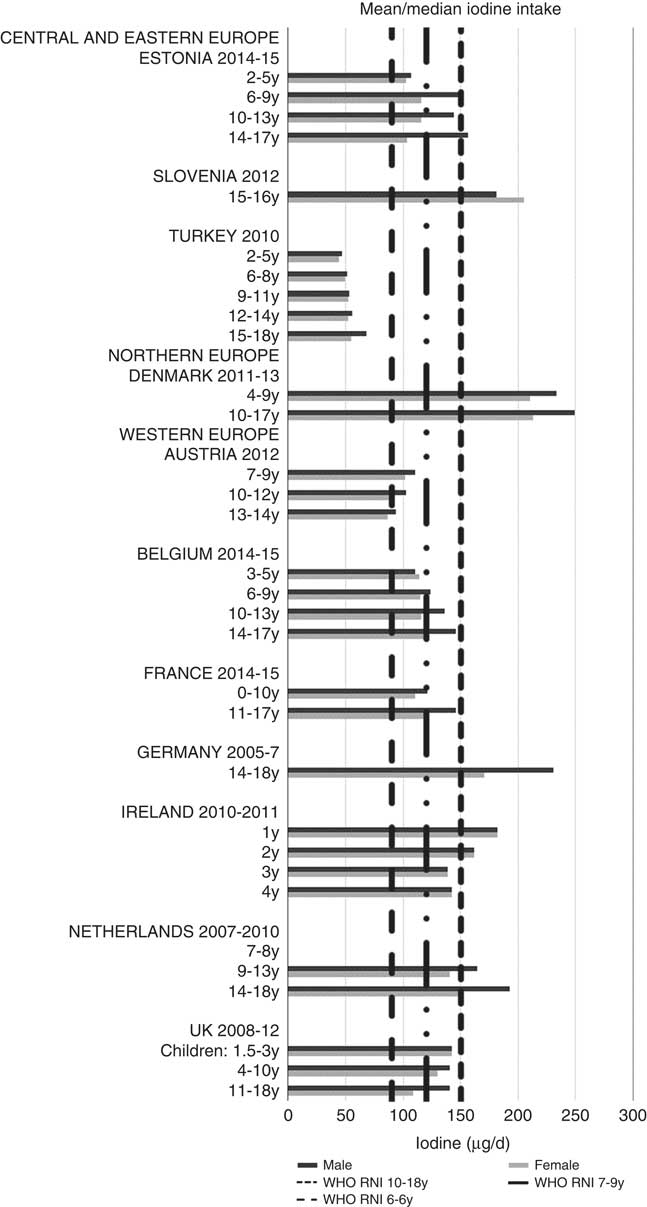
Fig. 13 Mean/median child iodine intake (µg/d) (excluding supplements). y, Years; RNI, recommended nutrient intake.
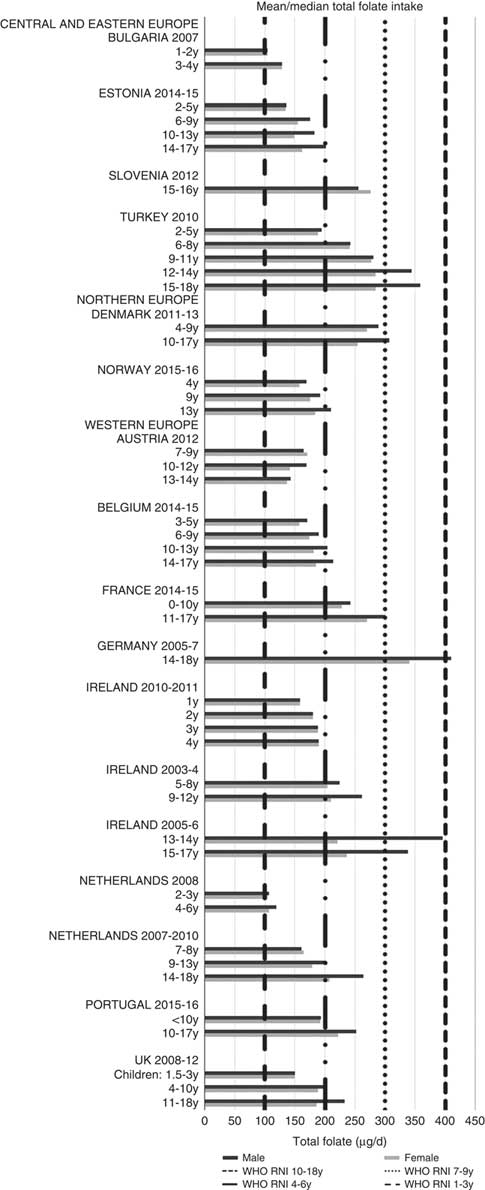
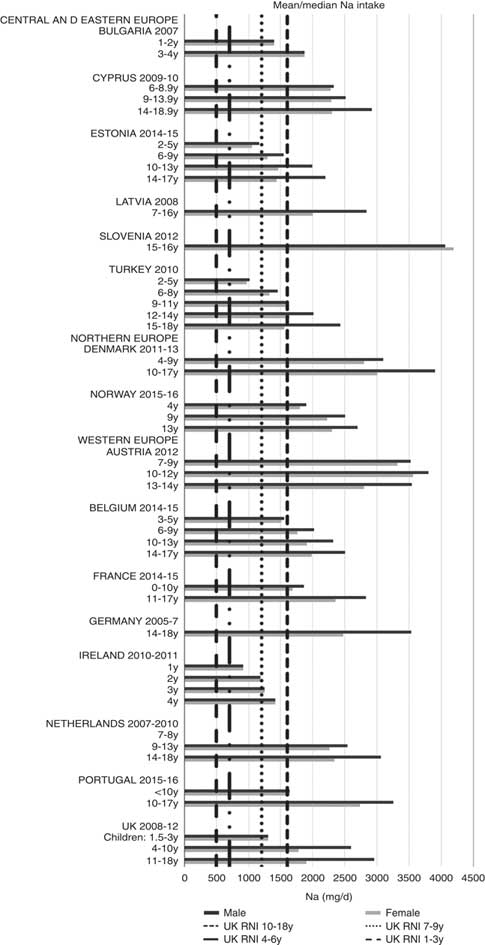
Irish boys (13–14 years) were the only group aged>3 years with adequate total folate intakes (Fig. 14). Mean intakes were 193 (range 104–270) µg and 259 (range 137–340) µg for girls<10 years and≥10 years, respectively, and 205 (range 104–289) µg and 304 (range 143–410) µg for boys. The lowest RNI attainment was in vitamin D, where only French and Portuguese children aged<10 years had sufficient intakes (Fig. 15). Mean intakes were 2·7 (range 0·8–6·4) µg and 2·0 (range 0·8–4·0) µg for girls<10 years and≥10 years, respectively, and 2·6 (range 0·8–6·7) µg and 2·4 (range 1·0–4·3) µg for boys. Most countries over-consumed Na – only Estonian girls aged≥10 years and Turkish adolescent girls did not exceed the 1600 mg RNI (Fig. 16). Mean intakes were 1492 (range 918–3320 mg) and 2095 (range 1434–4191 mg) for girls<10 years and≥10 years, respectively, and 1702 (range 918–3520 mg) and 2765 (range 1599–4059 mg) for boys.

Fig. 14 Mean/median child total folate intake (µg/d) (excluding supplements). y, Years; RNI, recommended nutrient intake.
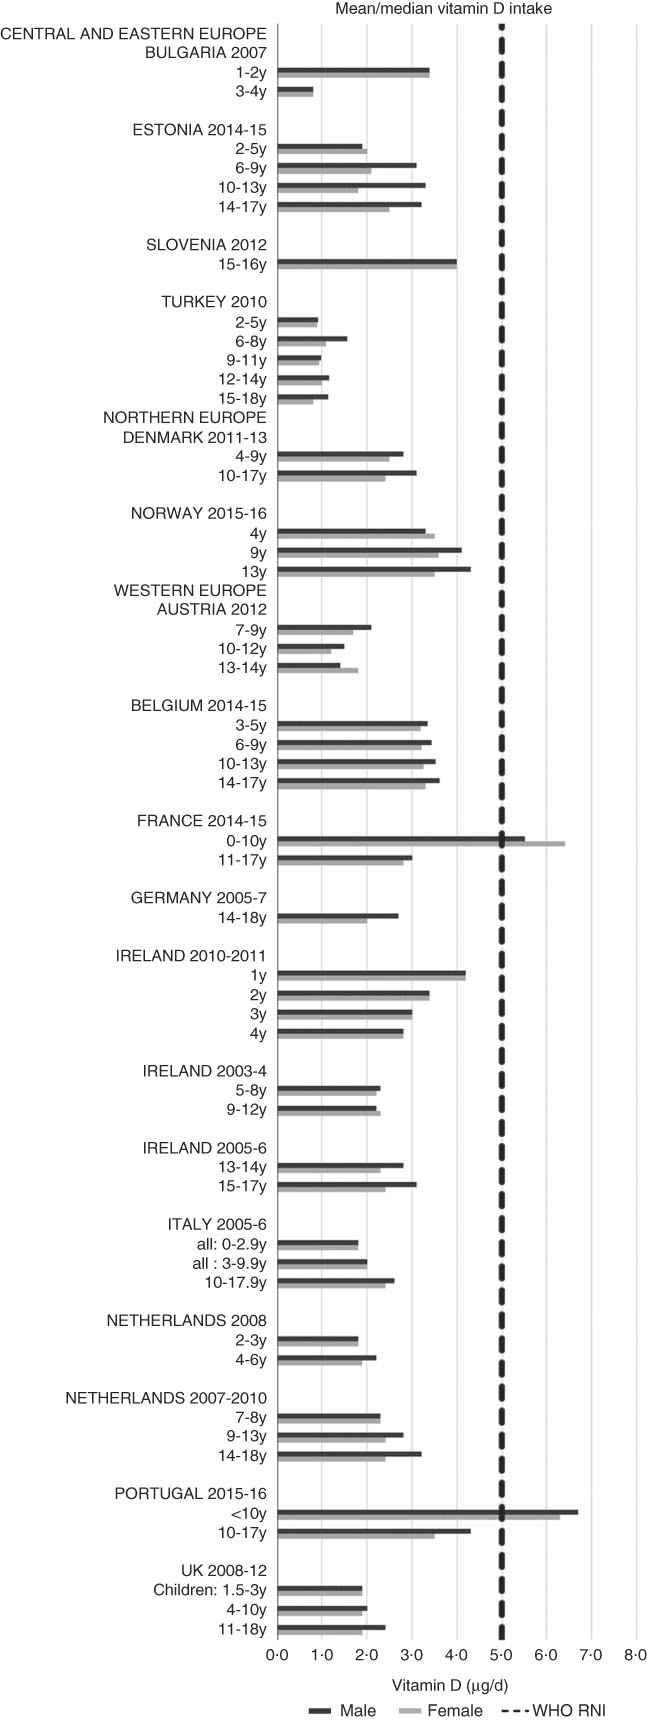
Fig. 15 Mean/median child vitamin D intake (µg/d) (excluding supplements). y, Years; RNI, recommended nutrient intake.
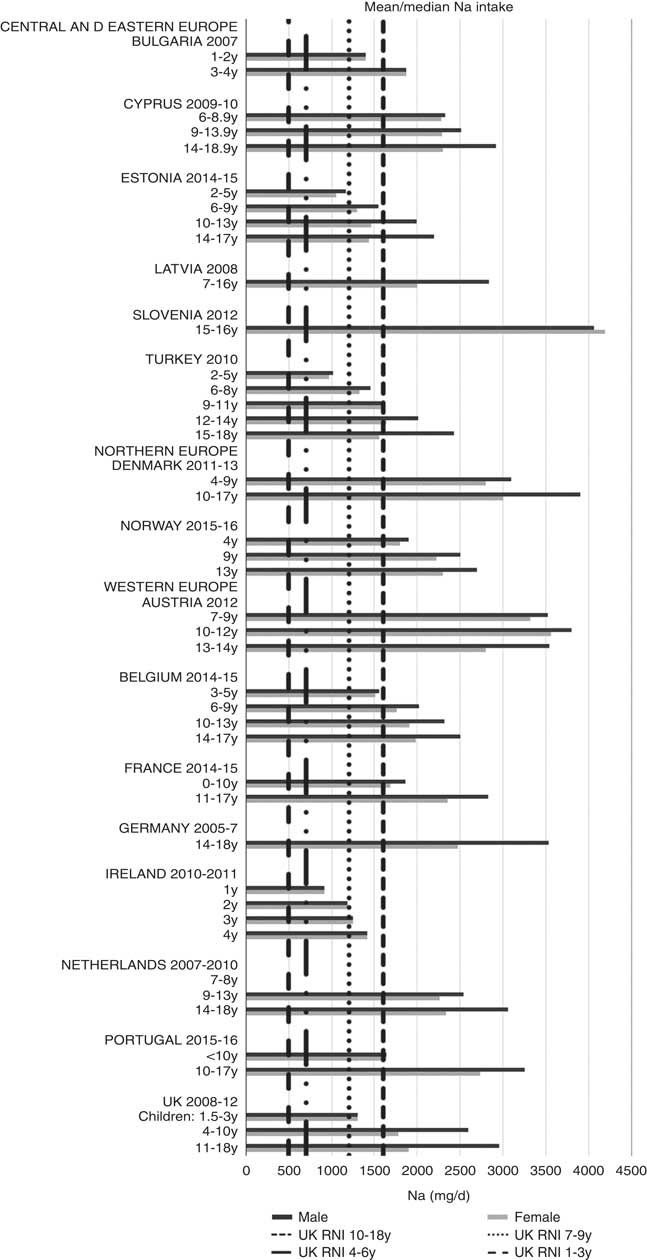
Fig. 16 Mean/median child sodium intake (mg/d) (excluding supplements). y, Years; RNI, Reference Nutrient Intake.
Discussion
Data extracted
The present review details the reporting of child intake data for energy and selected nutrients of concern in nationally representative surveys across the fifty-three countries in the WHO Europe remit(1). Only a third of countries, mostly Western European, reported intake data by sex and age group. This is concerning, as potential micronutrient deficiencies may go unidentified and nutrition policies in two-thirds of the WHO Europe region, particularly outside Western Europe, may be based on limited contextual evidence that can be critical in tailoring policies to local needs. This makes impacts on other NDS and has longer-term implications for obesity; over 60 % children who are overweight before puberty are likely to remain so in adulthood(25). Although Southern European countries have previously had the highest prevalence in children aged 6–9 years(Reference Lien, Henriksen and Nymoen26, Reference Wijnhoven, van Raaij and Breda27), there has been a particularly marked increase in childhood obesity in CEEC since 2002(Reference Inchley, Currie and Jewell28). In addition, six of the top ten countries for overweight and obesity in girls, and five of the top ten countries for boys aged 7–9 years in the Childhood Obesity Surveillance Initiative round 4 were CEEC(29). This is concerning, as increased intakes of processed foods driven by food system changes induced by the nutrition transition in CEEC(Reference Popkin, Adair and Ng30) could begin to affect later years. If dietary data are lacking, countries may struggle to advocate and design effective policies.
Energy, and macro- and micronutrients were generally widely reported in the twenty-one surveys across eighteen countries from which intakes were extracted, though some gaps were evident. Energy was universally reported, and macronutrients slightly better represented than micronutrients. This forms a good foundation for assessing child nutrient status and identifying vulnerable age/sex groups. The largest nutrient gaps in reported intakes were TFA, n-3 and n-6 (omega) fats, added sugars and iodine, all of which have been highlighted as of concern(1, Reference Lavie, Milani and Mehra31). Iodine deficiency has been linked to reduced cognitive function in children(Reference Bath, Steer and Golding32) and remains an issue in the WHO European region. Andersson et al. (Reference Andersson, Karumbunathan and Zimmermann33) examined national (about 65 %) and subnational (about 35 %) data on urinary iodine concentration and found that 43·9 % of European school-age children had insufficient intakes.
n-3 Fatty acids have established links with reduced blood pressure and CHD risk in adulthood, amongst other health benefits(Reference Aranceta and Pérez-Rodrigo34, Reference Harris, Mozaffarian and Rimm35), including brain development(Reference Innis36). Over-consumption of sugar, particularly in adolescents and often from sugar-sweetened beverages, is linked to overweight and obesity via elevated energy intake and can promote suboptimal diets by displacing nutrient-rich foods(Reference Inchley, Currie and Jewell28). Lack of intake data for these nutrients therefore hampers the identification of unfavourable intakes and policy formulation to prevent subsequent problems in childhood that affect the lifespan. Although there were no regional patterns in nutrient reporting, Latvia only reported on energy and Na intakes and Spain included no micronutrients. This has implications for national nutrition policies and identification of vulnerable groups in these countries.
Only a third of countries reported energy and nutrient intake by socio-economic group, by one or more indicators including education, occupation, income and social class (Table 4). This narrows opportunities to assess nutrient-based socio-economic inequalities in population subgroups, and prevents comparisons with countries that do include such stratification. Vulnerable groups may therefore be susceptible to malnutrition, with limited monitoring tools for preventative policy formation.
Energy intakes
As expected, boys and older children had generally higher energy intakes. There were no obvious regional trends, though German and Slovenian adolescent boys had particularly high intakes, possibly due to the age range being limited to older adolescents. The literature suggests that under-reporting affects reported intakes to varying degrees across countries, making valid comparisons difficult, particularly considering that in different surveys children reported their own intake at different ages. Rothausen et al. (Reference Rothausen, Matthiessen and Groth37) found that misreporting in Danish children aged 7–8 years was ‘modest’, and greater in those aged 12–13 years, particularly in food diaries compared with 24 h recalls. Similarly, Lioret et al. (Reference Lioret, Touvier and Balin38) found greater under-reporting in French children aged≥10 years than in those aged<10 years, and one study found under-reporting in British children aged 11–17 years as high as 73 %(Reference Albar, Alwan and Evans39). This suggests that the energy differential between younger and older children may be higher than that reported.
Nutrient intakes and WHO recommended nutrient intakes status
Countries in all WHO Europe regions had poor RNI attainment levels – only Slovenia met over half of the RNI for those nutrients and age/sex groups reported (Table 4). This is concerning, as it implies that nutritional issues affect children across Europe, to an extent that may be difficult to determine due to the limitations of the data available and the gaps in data for some countries and nutrients. Older adolescents in the≥10 years range are more likely to meet RNI based on absolute levels rather than %E, such as fibre. This could explain why Slovenia had the highest percentage compliance (42 %), having generally high intakes across the nutrients extracted. This could be due to the narrow adolescent age range surveyed (15–16 years); Germany had a similar age range (14–18 years) and also had relatively high intakes. However, other countries with similar age groupings had lower intakes, supporting the possibility of the differences being genuine.
Macronutrients
Most countries did not meet the carbohydrate, sugar or fibre RNI in any age group. The only exceptions were German boys, who met the fibre RNI, and Slovenia, which met the total carbohydrate and fibre RNI. However, both the German and Slovenian cohorts were limited to adolescents, giving them a greater chance of having intakes high enough to meet the fibre RNI, which represents an absolute amount rather than %E and is not a child-specific target. Northern European children<10 years were more likely to meet the added sugar RNI, and other than Slovenian adolescents, Dutch children aged<10 years were the only other group to meet the lower carbohydrate RNI. This suggests that in countries where sugar data were present, most children, particularly those aged≥10 years, could be at greater risk of the weight gain and associated risks linked to high sugar and low complex carbohydrate consumption(Reference Mann, Cummings and Englyst40).
Most countries had intakes indicating an unfavourable fatty acid balance across all age groups; all countries were over the upper RNI for saturated fats in all age groups and only Slovenia and very young Dutch children were below the maximum fat RNI. Dutch children aged 2–3 years were the only group with a favourable fatty acid profile, achieving the PUFA in addition to the total fat RNI. Slovenian children neither achieved the PUFA RNI nor had a substantial MUFA intake compared with other children aged≥10 years. The Netherlands and Turkey met the PUFA and n-6 RNI in all ages and Austria, the Netherlands and Portugal met the n-6 RNI in older children. Spain also met the PUFA RNI in all ages and Cyprus, Italy and Spain had relatively high MUFA intakes. The favourable intakes in these countries could indicate aspects of a Mediterranean diet pattern, which when adhered to in its complete form and supported by other factors such as physical activity, has been linked to reduced childhood obesity(Reference Tognon, Hebestreit and Lanfer41). Conversely, n-3 intakes were poor, with only Estonian adolescent boys achieving the RNI.
TFA had the highest RNI compliance for those countries which reported it. This may reflect positive moves to reduce levels in the food supply following advice from health bodies like the WHO(1), including bans, labelling legislation and voluntary product reformulation(42–44). However, the low number of countries reporting TFA demonstrates the need for a common and comprehensive blueprint for conducting NDS and gathering nutrient intake data across Europe.
Micronutrients
As with macronutrients, there were no clear regional patterns in micronutrient intakes or RNI attainment. However, compliance was highest in boys and children aged<10 years. Unlike macronutrients, micronutrient RNI are based on absolute intakes rather than %E. Yet although most micronutrients have different RNI for specific age groups, intakes in children aged≥10 years were generally not sufficient to meet RNI for older children, particularly girls. Even in Zn and vitamin B12, where RNI attainment was high, shortfalls in adolescent girls were apparent, highlighting them as a vulnerable group.
Although not the worst in overall RNI attainment, Fe was a particular issue for adolescent girls, with all countries except Slovenia having inadequate intakes. This is consistent with previous (non-national) European-based reviews and relates to higher requirements, primarily due to menstruation(Reference Hercberg, Preziosi and Galan45, Reference Lambert, Agostoni and Elmadfa46). Adolescent girls are at greater risk of Fe-deficiency anaemia, and deficiency is associated with reduced intellectual, immune and other metabolic functions(Reference Lambert, Agostoni and Elmadfa46). Deficiency in this group may also be underestimated, as UK RNI were used instead of WHO RNI because the latter have different values for different bioavailabilities and menarchal status, which would be difficult to determine(16). However, although agreement between the UK and WHO RNI was good for children aged<10 years, WHO RNI requirements are much higher for girls post-menarche, even when using the RNI that assumes the highest bioavailability from diet (15 %)(16, 21). The scale of European deficiency in this group may therefore be greater than previously thought, and policy initiatives may be required to improve Fe intakes.
Ca intakes were inadequate in older boys and girls. Ca is needed for bone and tooth development, metabolic processes including muscle and nerve function and its metabolism is linked with vitamin D intake. Vitamin D intakes, assessed by a singular absolute amount, rather than age-specific RNI, were universally lacking other than in younger Portuguese children. This is an important issue, as in addition to roles in bone, muscle and immune function, deficiency is linked to rickets(Reference Allgrove and Mughal47, Reference Michaelsen, Weaver and Branca48). Although rickets was of relatively little concern in Europe in the latter half of the 20th century, in recent years prevalence has risen, particularly in the UK and Northern European countries and for individuals with darker skin or who cover up for religious and other reasons, as less can be synthesised on exposure to sunlight(Reference Prentice49).
Total folate intakes were universally poor, with no children aged>3 years achieving the RNI. Na intakes exceeded the RNI in all children except adolescent girls from Estonia and Turkey, which are both CEEC. This is despite the potential for under-reporting due to intakes being derived from self-assessed dietary methodologies rather than 24 h urinary biomarkers. Further efforts are needed to promote the consumption of low-salt, minimally processed foods and advance reformulation of foods commonly consumed by children – these will vary by country, but might include bread, cheeses and breakfast cereals. However, salt iodisation is a primary means of increasing population iodine intakes, and iodine was the least reported micronutrient. Calls to reduce salt intake can lead to questions of compatibility with iodine intake goals, especially in CEEC. With almost half of European school-age children having insufficient intakes(Reference Andersson, Karumbunathan and Zimmermann33), which can cause reduced cognitive function(Reference Bath, Steer and Golding32), care is needed in approaches to tackle Na over-consumption, especially where iodine RNI attainment is low and salt iodisation is practised(Reference Pearce, Andersson and Zimmermann50). However, evidence is clear that appropriate Na and iodine intakes can be achieved in the context of Na reduction initiatives(18), as iodine concentration in salt can be increased or alternative vehicles for iodine sourced.
Of the micronutrients investigated, our findings show that Fe, vitamin D, total folate and Na would benefit from European-wide policy focus to improve intakes, particularly in girls and children aged≥10 years. Effective food-based approaches, including product reformulation and fortification, currently exist alongside targeted supplementation for at-risk groups. Aside from total folate, the WHO Europe Food and Nutrition Action Plan(1) identifies these as nutrients of concern, although this refers to all ages rather than specifically children. The Action Plan also highlights energy, saturated fat and sugar reduction as priorities and recommends a suite of policy options to address their excess intake, which our findings support. However, the plan does not discuss the increase of carbohydrate, fibre or n-3 and n-6 (omega) fats, and our findings show that the RNI for these were often not met. Countries across WHO Europe should also be encouraged to address this in policy and guidance, for example increased use of whole grains in manufactured products or public education on sources of n-3 and n-6 (omega) fats.
Strengths and limitations
This review presents a much-needed up-to-date review of national child energy and nutrient intakes across Europe. It also reports intakes against WHO RNI, enabling governments and policymakers to better use NDS to inform initiatives to improve diets and reduce diet-related diseases in groups and areas of greatest need. It is well documented that energy, macronutrient and Na over-consumption is linked to childhood obesity and related NCD(1) and poor micronutrient intakes continue to cause health problems in children(Reference Hercberg, Preziosi and Galan45, Reference Lambert, Agostoni and Elmadfa46, Reference Prentice49). Blundell et al. (Reference Blundell, Baker and Boyland51) found>10 % inter-country variation in obesity prevalence and cited differences in national age profiles and sociodemographic patterns as key contributors. The present review highlights both the scale and the potential hidden extent of such issues, showing that reported lack of compliance with WHO RNI may be the tip of the iceberg, with many countries’ intakes unknown. In addition to previous reviews, which document NDS provision across Europe(Reference Rippin, Hutchinson and Evans6, Reference Rippin, Hutchinson and Jewell12), the present review also highlights whether and how surveys report nutrient intakes by socio-economic group, helping to direct further research in this area.
A primary limitation is that inter-country comparisons are difficult, as age groupings were inconsistent. The most extreme example of this drawback was in Andorra, which could not be included in the present review as the lowest age group included both adults and children. Age groupings also differed within countries; Bulgaria split children into four groups for energy, but two for other macro- and micronutrients, making consistent and complete analysis difficult. In addition, several countries did not separate girls and boys in the youngest age groups. Raw survey data could be used in future work to create consistent age groups and obtain more reliable conclusions.
Differences in the reporting of nutrient intakes across and within countries further hindered comparisons and, in some cases, limited RNI assessment. For example, Estonia did not report nutrients in all age groups and the three Irish surveys reported different nutrients. Bulgaria reported some nutrients by %E and others with absolute values; because age groups for energy differed from other nutrients, the %E needed to assess macronutrient RNI could not always be calculated, resulting in knowledge gaps. Age groups did not always correspond with RNI age boundaries, particularly in micronutrients, making it difficult to assess attainment. However, examples in the literature exist where international comparisons are made despite different age groupings(Reference Novaković, Cavelaars and Bekkering7). Using RNI to assess nutrient intake adequacy also has limitations, as assertions are only as good as the data on which they are based, which may be incomplete. RNI are estimates of the amount of a nutrient needed to ensure that the needs of the majority of a group (97·5 %) are being met; therefore RNI err on the side of caution and may over-estimate inadequacies. The proportion of intakes in a population group below the estimated average requirements is a more appropriate measure of nutrient inadequacy than the proportion below the RNI; however, lack of raw data from sufficient countries prevented this(16). Additionally, although the<10 years and≥10 years age group splits were chosen to align with the RNI age cut-offs, different cut-offs will have produced different results. Despite these difficulties, the present review remains an important study that displays nutrient intakes in children, which the WHO defines as a vulnerable group(1). Any difficulties posed by lack of comparability serve to highlight the pressing need for harmonisation of methodologies and approaches.
The country means (Tables 5 and 6) for the<10 years or≥10 years groups are approximations that depend on the age ranges surveyed. For instance, the Slovenian NDS covered a small age range (15–16 years); reported mean intakes may therefore be less representative of the≥10 years group than countries that have surveyed a wider age range. Similarly, the contribution to the weighted estimated means for its region and Europe overall may be unrepresentative. The country-specific means for countries with multiple age groups above or below the 10-year cut-off are approximations based on the assumption that the numbers surveyed in each age group are proportionate to those in the total child population, the latter being used due to availability. Additionally, in some countries age ranges spanned the 10-year boundary, though broadly speaking the majority of children could be allocated to either the<10 years or≥10 years group.
The different dietary assessment methodologies used by the surveys also limit the validity of comparisons. As under-reporting is common and varies across methods and is affected by multiple other factors, the impact on reported intakes differs across countries and compounds difficulties in making comparisons. This is exacerbated by the exclusion of under-reporters by some countries (Austria, France, Norway), whereas other countries include under-reporters (Cyprus, Denmark, Ireland, Italy, the Netherlands, Slovenia and the UK) and the remainder did not specify.
Discrepancies in national food composition databases create further compatibility issues. The present review used sucrose as a proxy for added sugars, as surveys typically did not distinguish between the two. Consequently, intakes may differ as the number of mono- and disaccharides included varies. Not all surveys had available user guides to determine the methods used to derive nutrient values. With fibre, the Englyst method usually generates lower results than the AOAC for certain cereals, fruits, white beans and groundnuts(Reference Mongeau and Brassard52). Certain micronutrients may also be derived from a narrow range of foods, making them less valid in representing population intakes. Similarly, databases do not address fortification in a common manner, as with iodine(Reference Mensink, Fletcher and Gurinovic53). This is problematic, as the severity of identified deficiencies may be misrepresented.
Future work could explore raw survey data to create common age groups and minimise the impact of inconsistencies. This would help determine whether extremes such as Slovenian macronutrient intakes are genuine differences or due to the age range covered. It would also allow the alignment of age groups with WHO RNI, increasing the accuracy of identifying deficiencies.
Conclusion
This review reported macro- and selected micronutrient intakes in children across WHO Europe using the latest available reported NDS intakes and assessed these against WHO RNI. Energy and nutrient intakes were extracted from twenty-one surveys covering a third (eighteen), mainly Western, WHO European countries. Most countries reported intakes from a good range of nutrients, particularly macronutrients, so where nutrient intakes were reported, countries generally had a sound basis to assess child nutrient status. However, TFA, n-3 and n-6 (omega) fats, added sugar and iodine were least reported. These gaps are concerning, as potential deficiencies could go undetected and nutrition policies implemented could be based on limited evidence. WHO RNI attainment was generally poor – most countries met under half of the RNI for the nutrients and age/sex groups reported, implying that widespread nutrition issues could exist across Europe. Macronutrient RNI compliance was universally poor, and although micronutrients were slightly better, attainment was worse in girls and children≥10 years. Fat and saturated fats, vitamin D, Na, total folate and Fe had the lowest compliance. Only eight countries reported intakes by socio-economic group and different indicators were used. This narrows opportunities to assess inequalities and vulnerable groups susceptible to malnutrition and limits the monitoring tools available for policy formation. Different age groups, methodologies, nutrient composition databases and under-reporting are the main limitations, potentially misrepresenting true intakes and preventing inter-country comparisons. Future work could use raw NDS data to conduct stratified analyses with consistent age groups. Governments and health bodies should continue efforts to encourage European countries to report a full range of nutrient intakes by various sociodemographic variables in a standardised format.
Acknowledgements
The present review was funded by the WHO Regional Office for Europe. Funding for the publication was received from the Government of the Russian Federation within the context of the WHO European Office for the Prevention and Control of Noncommunicable Diseases (NCD Office).
All authors have contributed to the concept and design of the research and to the writing and/or revision of the manuscript, and have approved the manuscript for submission.
The authors declare no conflict of interest. The co-authors J. J. B. and J. J. are staff members of the WHO Regional Office for Europe; however, the authors are responsible for the views expressed in this publication and they do not necessarily represent the decisions or stated policy of the WHO.
Appendix 1. Reported mean macronutrient intakes for children and adolescents in European national dietary surveys
Table A1 ■
Appendix 2. Reported mean micronutrient intakes for children and adolescents in European national dietary surveys
Table A2 ■


 Open access