


Introduction
Correlative light and electron microscopy (CLEM) can be done by means of transmission electron (TEM), scanning electron (SEM), and focused ion beam (FIB-SEM) microscopies [Reference Muller-Reichert1–Reference Kuipers7]. In recent years, we have optimized and developed new protocols to correlate optical microscopy of fixed and live cells with both SEM and 3D FIB-SEM imaging [Reference Lopez3,Reference Doh4,Reference Keene8–Reference Schaser10] (unpublished results) and to also preserve fluorescence signal in methacrylate resins [Reference Keene8,Reference Schaser10] (unpublished results). In some experimental cases, we have observed that 2D EM imaging will suffice and is enough to answer a specific scientific question. However, over the past ten years the scientific community has shown advantages of using 3D EM. In fact, 3D imaging technologies have enormously advanced knowledge in several scientific fields, such as developmental biology, cancer biology, and, particularly, neurobiology [Reference Scheffer and Meinertzhagen11–Reference Kremer13]. In our hands, the ability to correlate both fluorescent and bright-field imaging with 3D FIB-SEM has helped us develop protocols that are currently being used in clinical trials [Reference Johnson14–Reference Riesterer16] (https://dx.doi.org/10.17504/protocols.io.36vgre6). These protocols assist clinical pathologists and cancer biology researchers at Oregon Health and Science University to identify specific areas of interest from human cancer biopsies prepared for large format 2D and 3D EM by combining toluidine blue and SEM images (Figure 1).

Figure 1: Specific regions of interest of pancreatic ductal adenocarcinoma (PDAC) pointed out by pathologists can be studied at higher resolution using CLEM. TheToluidine Blue stained thick section in (A) can be matched to the SEM image montage in (B). By changing the overlaid image opacity from 100% in (C) to 50% in (D), specific cells can be identified in both modalities. Scale bars are equal to 200 μm.
An advantageous technique, sequential CLEM allows sample imaging using any optical method of choice, including super-resolution fluorescence microscopy [Reference Zhang17], and samples are processed for 2D or 3D EM only if the optical imaging was successful. In this workflow, the introduction of the heavy metals needed to obtain high-quality images by secondary electron SEM (SE-SEM) or backscattered electron SEM (BSE-SEM) is completed in later steps to ensure that fluorescent signal is not compromised [Reference Lopez3]. Currently, a broad range of methodologies to obtain CLEM results exists, each with their own advantages and limitations [Reference Muller-Reichert1,Reference Muller-Reichert and Verkade2,Reference Peddie6,Reference de Boer18]. Therefore, researchers must carefully select the optimal methods for their study based on the nature of their specimens and instrumentation available. Here we describe three different CLEM methods that can be easily reproduced in any laboratory using conventional bench processing methods.
Materials and Methods
Instrumentation.
Similar instrumentation and imaging conditions were used for all of the results presented here (Figure2). Wide-field optical and fluorescence microscopy (FM) was performed using a FEI CorrSight™. A FEI Helios NanoLab 650 DualBeam™ (later upgraded to the 660 version) was used for SEM and FIB-SEM data collection. Both instruments used the FEI MAPS software package. Sections were cut using a Leica UC7 ultramicrotome. Sample coating was performed on a Leica ACE600 coater and dehydration using a Leica CPD300.
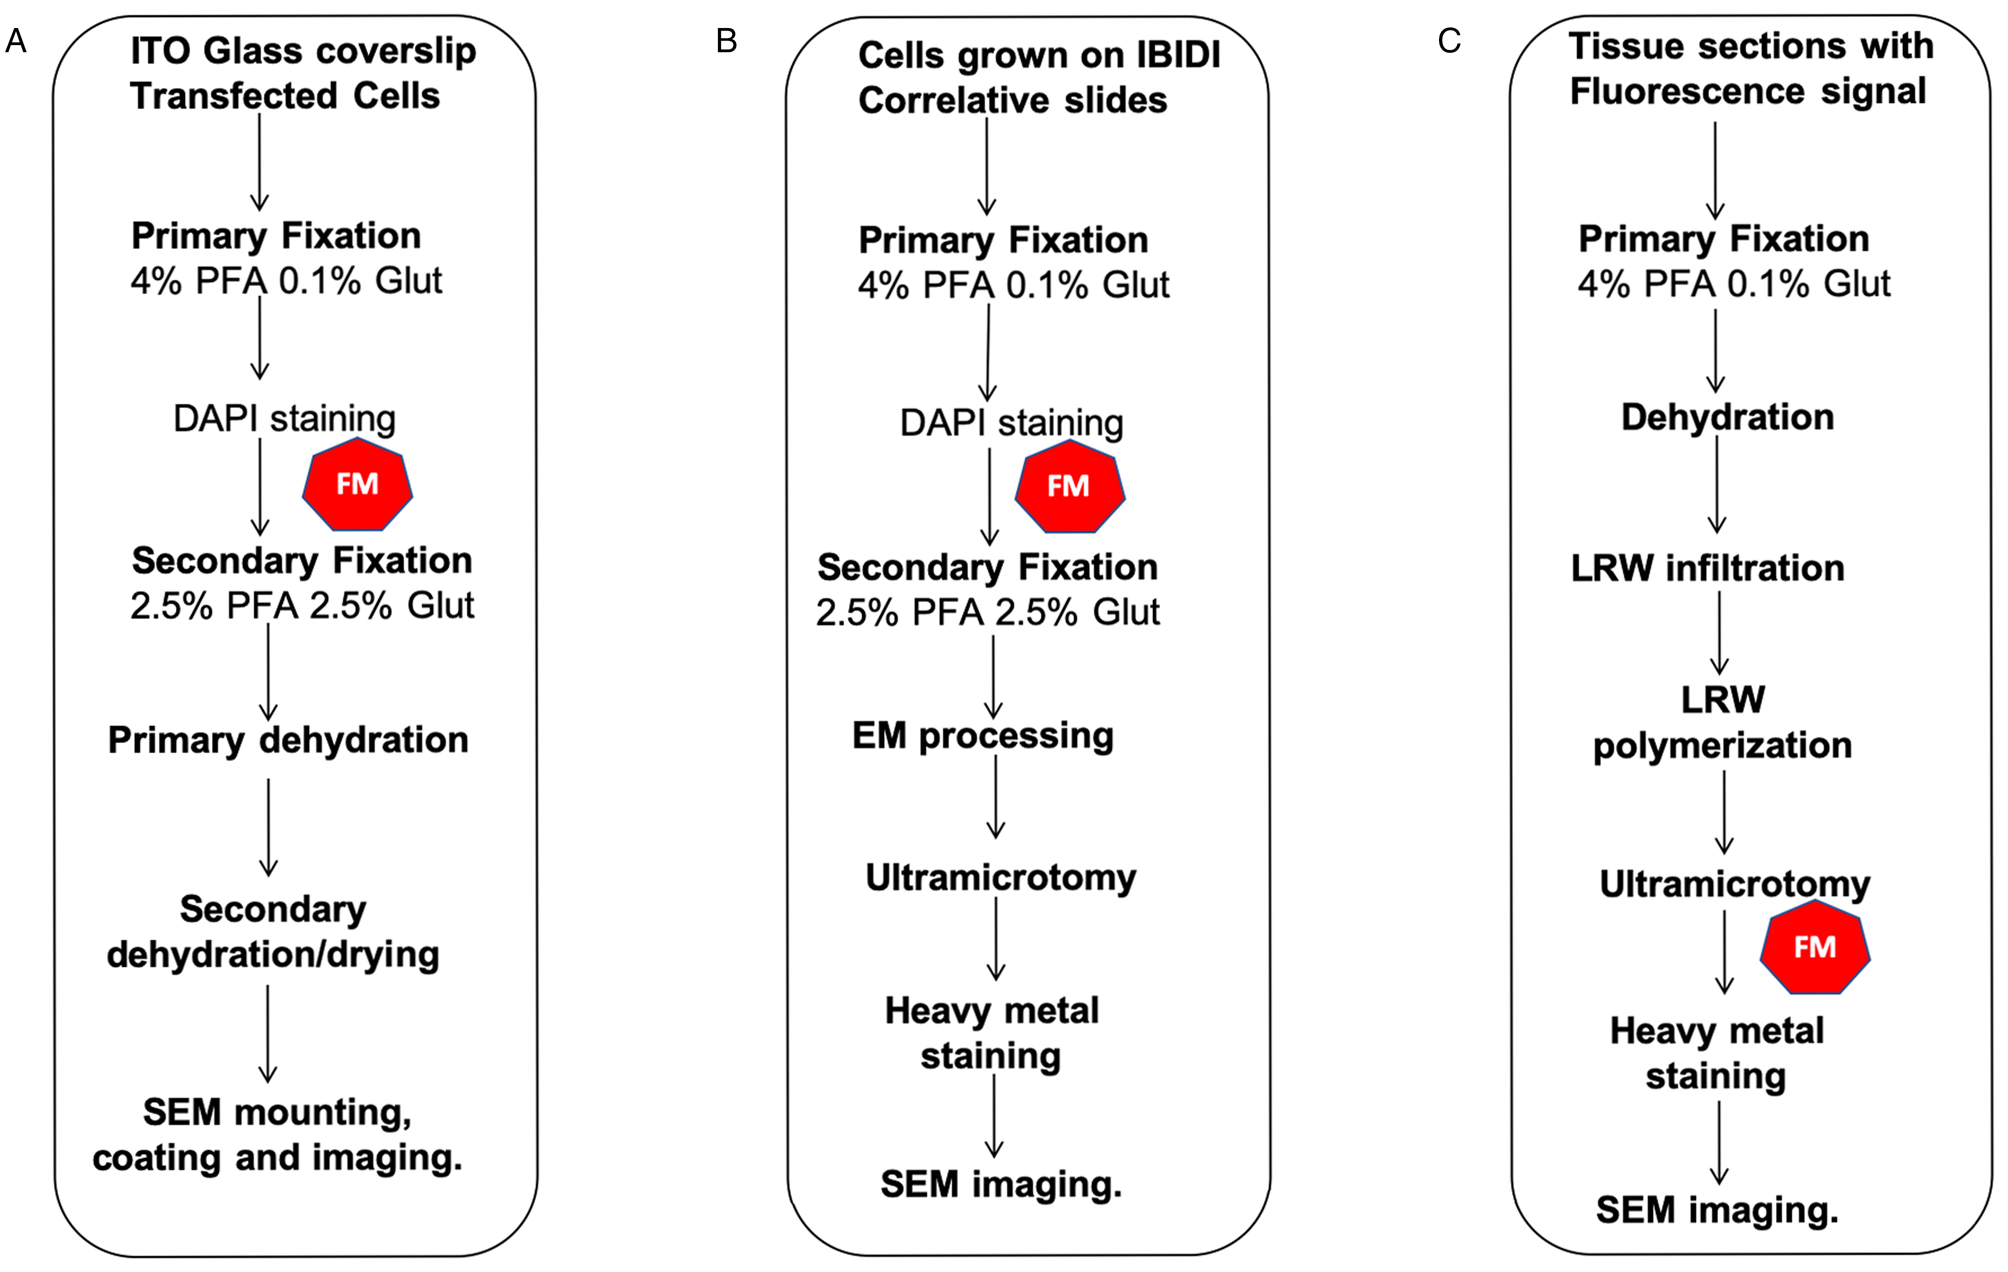
Figure 2: CLEM workflows described in this manuscript. (A) FM and 2D SE-SEM, (B) FM and 2D-BSE-SEM, (C) FM and 2D-SEM in resin fluorescence preservation. The symbol in red indicates the FM step.
There are several software programs, both open-source or licensed, available for optical and EM correlation that include rigid (MAPS used here from Thermo Fisher) and/or non-rigid registrations of the images [Reference Paul-Gilloteaux19]. Depending on the protocol used to prepare the specimen, non-rigid registration is advantageous as the image can be warped and therefore adapted to any deformations that have occurred during the preparation steps (mostly during the chemical fixation and dehydration procedures). However, for samples processed near to native conditions, such as those methods used for cryofixation, or in the case of in-resin fluorescence preservation methods, rigid registration is most appropriate since specimen deformation is minimal.
Correlation of optical microscopy with 2D SE-SEM imaging.
MCF7 breast cancer cells (American Type Culture Collection) were grown in Dulbecco's modified Eagle's medium (DMEM) supplemented with 10% fetal bovine serum (FBS) in 35 mm culture dishes. Cells were transiently cotransfected with 500 ng of DNA of HER2-eGFP and AKT2-tagRFP expression plasmids each using X-tremeGENE HP DNA Transfection Reagent (Roche) for 24 h. Cells were grown on indium tin oxide (ITO)-coated cover slips pretreated with 0.01% polylysine at a desired confluency and chemically fixed using 4% (v/v) paraformaldehyde (PFA) and 0.1% (v/v) glutaraldehyde (Glut) in 1× phosphate-buffered saline (PBS) for 1 h at room temperature. After this step, the cells were washed in 1× PBS and incubated with 1μg/ml DAPI prepared in 1× PBS and incubated for 30 minutes at room temperature. Before acquiring the optical images, the ITO cover slips were engraved using a diamond scribe as described previously [Reference Doh9]. Cells were imaged by optical microscopy using the CorrSight fluorescence microscope. Tile sets of increasing magnifications were recorded, starting at 5×. Based on the overview tile set, higher resolved images at 20×, 40×, and 63× were acquired, narrowing down the regions of interest (ROI) to single cells [Reference Lopez3]. After this step the specimen was ready to be processed for SEM. ITO cover slips were transferred to a strong Karnovsky's fixative [Reference Karnovsky20] for 1 h at room temperature, washed with water, and dehydrated using an increasing concentration series of ethanol:H2O solutions up to 100% ethanol [Reference Doh9]. Samples were then subjected to critical point drying using a Leica CPD 200. After drying, cells were carbon coated (3–5 nm) before being mounted on conventional SEM pins using silver paint. SE-SEM images were collected using an Everhart-Thornley (ETD) or through lens (TLD) detector. MAPS was used to correlate the optical images to the SEM images as described previously [Reference Lopez3]. Note: Incubation of specimens in 2% OsO4 prior to the dehydration step helps to minimize charging of the cells in the SEM.
Correlation of optical microscopy with 2D BSE-SEM imaging.
MCF7 breast cancer cells were grown as described above on IBIDI correlative slides and chemically fixed, washed, and incubated using the same solutions and procedures as described above. Cells were imaged by wide-field optical microscopy. After this, the specimen was processed for BSE-SEM, described elsewhere [Reference Lopez3] (https://dx.doi.org/10.17504/protocols.io.36vgre6). Using the imprinted IBIDI grid on the resulting Epon block as a reference, 150–250 nm thick ultramicrotome sections from specific ROIs were generated and mounted on ITO cover slips or 5 × 5 mm silicon chips. The directional backscatter detector (DBS) was used to image plastic sections for BSE-SEM.
In-resin (methacrylate) fluorescence preservation and 2D BSE-SEM imaging.
London resin white (LRW) was used to preserve fluorescence signal of KMC mouse pancreas injected with Cisplatin labeled with tetramethylrhodamine (TRITC) [Reference Uribe21]. Tissue sections were fixed in 4% PFA only for 24 h and incubated post-fixation for 2 h in 0.5 M Tris pH 7.2, 0.1 M glycine to reduce autofluorescence. Tissue sections were then dehydrated in a concentration series of ethanol:H2O on ice up to 90% ethanol:H2O. After this step the specimens were infiltrated with solutions consisting of LRW and 90% ethanol (1:2, 1:1), respectively, for 1 h on ice. Specimens were then infiltrated overnight in 100% LRW at 20°C. The next day, the LRW was exchanged with fresh LRW once, and samples were polymerized at 50°C for 24 h in a vacuum oven. Sections (150–250 nm-thick) were cut and mounted on ITO cover slips. Plastic sections were imaged on the CorrSight using the shuttle holder and a triple-band filter set. After this, the sections were stained for 3 minutes with Reynolds’ lead citrate, washed extensively with H2O, and then stained for 3 minutes with 5% w/v uranyl acetate prepared in H2O. Sections were washed again with H2O. Samples were air-dried before again mounting on the shuttle holder for SEM imaging.
Results and Discussion
Correlation of fluorescence signal with 2D SE-SEM imaging.
Figure 2A shows the sequential CLEM workflow used to image samples by FM and SE-SEM. SE-SEM imaging was used here to provide information of the topographic characteristics of cells under study. The protocol discussed here is very simple and can be easily reproduced in any institution with an EM core facility. In this work, 0.01% poly-l-lysine pretreated ITO cover slips were used for cell growth, but any other matrix can be used. Disturbed cellular growth behavior was not observed by the use of ITO cover slips, but researchers must monitor their specific experiment.
Finding the same ROI across imaging platforms is the most difficult part of CLEM. The advantage of the MAPS software for image acquisition is that all positional information is recorded, helping the user localize the same ROI on the SEM. In addition, images acquired from any optical microscope can be imported for correlation. The addition of fiducials is essential and will facilitate the relocation of the ROI. In the example included here, we marked the ITO cover slip using a diamond scribe [Reference Doh9]. This mark was visible on both imaging platforms. More elegant fiduciary markers can be used, such as pre-labeled cover slips or fluorospheres, but are not necessary.
Once the fluorescence imaging is finished, a secondary fixation using strong fixatives at higher concentration is used (Figure 2A). As mentioned previously, the dehydration steps were done using an increasing ethanol:H2O series up to 100% ethanol, and the final drying step was done using a critical point dryer. These steps are crucial and must be done carefully in order to minimize sample shrinkage. For this step we recommend a slow increase of ethanol concentration, avoid removing the slides from the solutions to prevent air drying the specimen, and a slow purging of ethanol in the critical point dryer. It is also important to use fresh solvents to minimize the water content of the final dehydration solution, otherwise dehydration defects can be introduced to the specimen. Figure 3 shows an example of cells dehydrated rapidly, resulting in an excessive shrinking of the cellular body and filopodia. In this example the FM image cannot be perfectly overlaid with the SE-SEM image by using rigid registration methods.

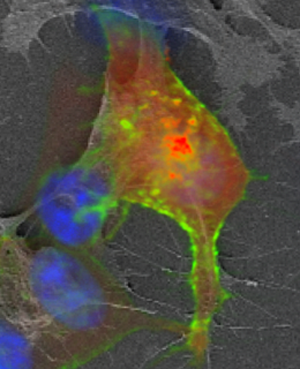
Figure 3: Cell shrinkage and distortion generated during dehydration steps. FM and SE-SEM overlay of cells grown on ITO cover slips. Blue: DAPI, Green: HER2-GFP, Red: AKT2-RFP.
In Figure 4A, a 5× tiled image shows an overlay of bright-field images and FM of the cells grown on the ITO cover slip. As proof of concept, in this experiment we used the overlay of fluorescence imaging onto SE-SEM images to localize proteins, such as human epidermal growth factor receptor 2 (HER2), that play an important role in cancer metastasis. HER2 overexpression is present in some types of breast cancer cases and is associated with poor prognosis [Reference Slamon22]. As expected the HER2-GFP signal is mostly located at the plasma membrane (Figures 4B and 4D). AKT2-RFP, a beta serine/threonine-protein kinase, is observed in the red channel and is mostly distributed in the cytoplasm. DAPI staining allowed visualization of nuclear DNA in the cells and could also be used to determine the number of nuclei and assess gross nuclear morphology (Figure 4B). Figures 4C and 4D show missing cells between FM and SEM imaging as well as anisotropic shrinkage between the cells. The overlay fitting was optimized for the central cell showing HER2 signal. SEM images were collected with the ETD detector at 1 keV and 50 pA.

Figure 4: MFC7 breast cancer cells grown on ITO cover slips and labeled for membrane, cellular, and nuclear markers. (A) 20× brightfield with fluorescence signal overlays. (B) 40× GFP and RFP tagged proteins together with DAPI signal overlayed with transmitted light. (C) 40× fluorescence signal overlayed with the SE-SEM. (D) Higher magnification of labeled region of interest showing more cellular details. Scale bars: A: 400 μm, B: 100 μm, C: 80 μm, D: 20 μm. Images show missing cells between FM and SEM due to sample preparation as well as anisotropic shrinkage.
Correlation of fluorescence microscopy with 2D BSE-SEM imaging on Epon plastic section.
We have used IBIDI correlative slides to develop the 2D CLEM method described here [Reference Lopez3]. Our main goal was to develop this CLEM method to characterize the morphology, number, and localization of nucleoli in cultured breast cancer cells. The presence of prominent nucleolar structures in tumor tissues is one of the parameters used by pathologists to define the “nuclear grade of tumors” [Reference Derenzini23]. Moreover, larger nucleolar size is recognized as a contributor in both tumor initiation and cancer progression [Reference Orsolic24]. In this example, the fiducials used for correlation were the grids imprinted in the wells where cells were grown. Cells grown on these IBIDI slides were primary fixed as described above and imaged by FM (Figure 1B). However, as we have described elsewhere [Reference Lopez3], live cell imaging can also be performed using this substrate. During FM screening, the absence of DAPI staining within the nuclei of the cells revealed the localization of the nucleoli (Figures 5A and D). Based on the ROI locations and using the IBIDI grid that is visible on the block under any optical microscope as reference, we generated 250 nm thick sections after staining and embedding the cells. As shown in the image overlays (Figures 5C and F), the absence of DAPI signal shown in Figures 5A and 5D provides an indication of nucleoli presence in the BSE-SEM images. BSE-SEM images were acquired using 2.5 keV, 0.2 nA, and the DBS detector. Although here we only show the correlation between 2D images, the same samples were subjected to 3D FIB-SEM to study the ultrastructural aspects of the nucleoli region on these cells (unpublished results).

Figure 5: (A) and (D) Representative images of DAPI stained cells showing cellular nucleoli in the areas voided of DAPI signal. (B) and (E) BSE-SEM images of the same cells. (C) and (F) FM and BSE-SEM overlays created using MAPS 3.1. Scale bars: A, B, and C: 10 μm; D, E, and F: 7 μm.
In-resin fluorescence preservation and correlation with BSE-SEM imaging.
As described in the Materials and Methods section, the Figure 1C protocol was performed at low temperatures, and the dehydration process proceeded up to 90% ethanol to preserve fluorescence signal from the Cisplatin-TRITC in the mouse pancreas. Keeping 10% water content in the specimen helps preserve the signal of the fluorophore most likely due to the maintenance of a hydration shell around it. Figure 6A shows a representative image of the fluorescence signal obtained from the LRW sections. Although there is some autofluorescence background present in the tissue, there are specific areas in the specimen showing higher signal intensity, more specifically on certain cells located near pancreatic ducts. Figure 6B shows a low-magnification SEM image of the same field of view of the image shown in Figure 6A after heavy metal staining. Here we used the shape of the plastic section to correlate the images as well as features present in the tissue (that is, ducts). Figure 6C shows a higher-magnification image from a specific region boxed in Figure 6B. One of the cells showing TRITC signal near the duct can be observed. Although we only used mild chemical fixation methods to fix this specimen, cellular membranes and cellular structures were well preserved.
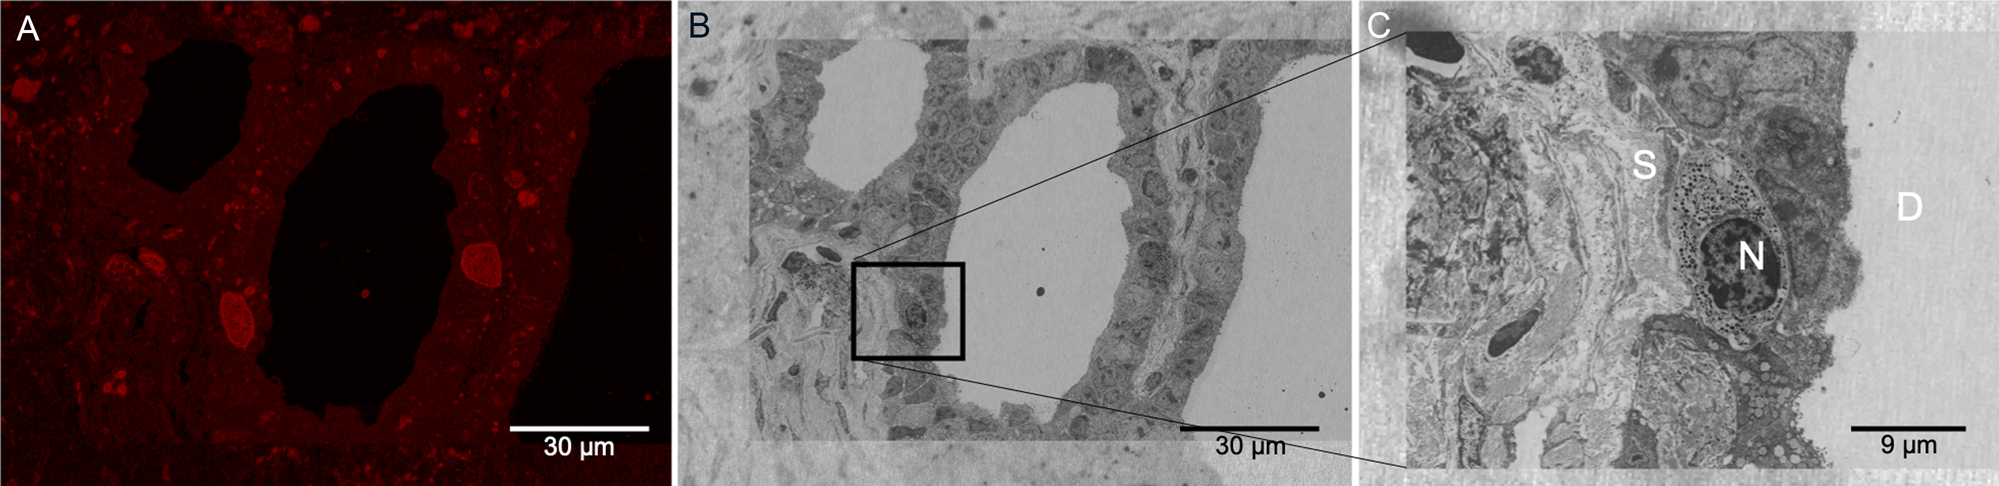
Figure 6: LRW plastic section showing Cisplatin-TRITC fluorescence preservation in mouse pancreas. (A) Pancreatic duct showing fluorescent positive acinar cells. (B) Same area as in (A) acquired by BSE-SEM imaging. The area boxed in black corresponds to an acinar cell showing fluorescence signal. (C) Higher magnification of the boxed area in (B) is shown. Secretory granules are identifiable in the acinar cells. N: nucleus, S: stroma, D: duct.
Conclusion
The presence of internal or external fiducial markers is very important for any sequential CLEM workflow. These markers can be either added to the specimen (gold fiducials, nanospheres, etc.), be part of the specimen (features within the sample, shape, etc.), or embedded within the sample holder or substrate of choice [Reference Muller-Reichert1,Reference Doh4,Reference Peddie5,Reference Kuipers7]. In the work described here, the three CLEM procedures used were sequential and, in each case, a different fiducial marker was exploited (diamond scribed marks, embedded grids on epoxy blocks, and plastic section shaped together with tissue morphology). Although our imaging used commercial correlative software, the workflows described here can be replicated using any instrument since the fiducials described are visible in both imaging platforms and should help the researcher locate the ROIs. That being said, a correlative image software program is essential for bridging the differences in resolution and enabling the integration of molecular and structural information.
Acknowledgements
Microscopy was performed at the Multiscale Microscopy Core, a University Shared Resource at OHSU. The authors acknowledge funding from OCSSB to CSL and NIH-NCI Cancer Center Support Grant (CCSG) 2P30CA069533. The Brenden-Colson Center for Pancreatic Care additionally funded portions of this work. We would also like to acknowledge all the collaborators who contributed with samples and advice.


