


Cognitive assessments with preschoolers can be of great importance for early detection of different developmental delays and disorders (Baron & Anderson, Reference Baron and Anderson2012). This is an age of fast cognitive development and brain maturation (Korkman et al., Reference Korkman, Kemp and Kirk2001; Tsujimoto, Reference Tsujimoto2008), which also makes it an ideal time for interventions and treatments (Baron & Anderson, Reference Baron and Anderson2012). Cognitive development is not only dependent on biological factors, but also on the child’s environment. Studies have found differences in cognitive test performance between different countries and cultures (e.g., Duggan et al., Reference Duggan, Awakon, Loaiza and Garcia-Barrera2019; Pérez-García et al., Reference Pérez-García, Luna, Torres-Espínola, Martínez-Zaldívar, Anjos, Steenweg-de Graaff, Weber, Grote, Gruszfeld, Verduci, Poncelet, Escribano, Tiemeier, Koletzko and Campoy2019; Roivainen, Reference Roivainen2010, Reference Roivainen2019; Rosenqvist et al., Reference Rosenqvist, Lahti-Nuuttila, Urgesi, Holdnack, Kemp and Laasonen2017). Assessing individuals belonging to linguistic and cultural minorities is complicated, since tests are rarely developed for such groups. Although cross-cultural neuropsychology has been a growing field of research in the last decades (Olson & Jacobson, Reference Olson and Jacobson2015), studies regarding cross-cultural child neuropsychology are still limited (for a review, see Byrd et al., Reference Byrd, Arentoft, Scheiner, Westerveld and Baron2008).
When conducting cognitive assessments with children aged 2–7 years, clinicians can use the Wechsler Preschool and Primary Scale of Intelligence (WPPSI; Wechsler, Reference Wechsler2014). The WPPSI is part of the Wechsler scales; some of the most used tests among psychologists worldwide (Benson et al., Reference Benson, Floyd, Kranzler, Eckert, Fefer and Morgan2019; Piotrowski, Reference Piotrowski2017; Rabin et al., Reference Rabin, Paolillo and Barr2016). This study investigated the generalizability of the Swedish version of WPPSI-IV (Wechsler, Reference Wechsler2014) to 5–6-year-old children belonging to the Swedish-speaking minority in Finland.
Cross-cultural aspects of the Wechsler scales for children
The Wechsler scales for children have been adapted to many different languages and norms have been gathered in several countries. Some adaptations have also been made for certain language minorities. Some minorities have separate published tests (e.g., WPPSI-IV CDN-F for French-speaking Canadian children, although relying on norms for English-speaking Canadians; Wechsler, Reference Wechsler2013) and for some minorities, smaller modifications have been made to improve reliability (e.g., special instructions in the German WISC-IV for German-speaking Swiss children; Grob et al., Reference Grob, Petermann, Lipsius, Costan-Dorigon, Petermann and Daseking2008). However, overall, tests, norms, or adaptations are seldom published for minority groups.
One minority group with no local Wechsler scales or norms is the Swedish-speaking minority in Finland (Finland-Swedes). Swedish is a national language in Finland and is the official first language of 5.2% of the Finnish population (Official Statistics of Finland, 2021). Approximately 40% of the Finland-Swedes are bilingual (Saarela, Reference Saarela2021). A recent survey for psychologists working with Finland-Swedish children showed that there is great variability in the usage of tests and norms (Rosenqvist et al., Reference Rosenqvist, Slama and Haavisto2022). When assessing young children, the Swedish WPPSI-IV with Scandinavian norms was the most common test choice and using it with Finland-Swedish children may seem suitable because of the shared language. However, the Swedish spoken in Finland differs somewhat from the Swedish spoken in Sweden, with different words and expressions, as well as with influences from the Finnish language. Accordingly, some psychologists considered especially verbal subtests to be problematic when used with this population (Rosenqvist et al., Reference Rosenqvist, Slama and Haavisto2022). There are also cultural differences, such as differences regarding education systems and demographic variability between Finland and Scandinavia, which are factors known to influence cognitive test performance (e.g., Babcock et al., Reference Babcock, Miller, Saklofske and Zhu2018). Therefore, information is needed about how this test and its norms are generalizable to Finland-Swedish children.
Cross-cultural comparisons of WPPSI are still scarce. One recent study compared the performance of the South Korean WPPSI-IV normative sample when scored with Korean versus US norms (Park & Lee, Reference Park and Lee2016). Korean 4–7-year-olds performed lower on most verbal subtests when scored with US norms, which was suggested to be partly due to the cultural loading of some items, since many original questions from the US version were kept in the Korean standardization. They also found that Korean children performed higher on most nonverbal subtests.
Reasons for cross-cultural differences
Several factors explain the differences found in test performance between cultures (for a review, see e.g., Ardila, Reference Ardila2020; Olson & Jacobson, Reference Olson and Jacobson2015), one of which is language. Especially verbal tests have been considered culturally loaded and in need of adaptations across different cultures (International Test Commission, 2019). Cross-cultural comparisons of performance in verbal tests are also difficult, as developing a language test of the exact same difficulty can be considered impossible (Roivainen, Reference Roivainen2013). The same words may not exist in different languages or may have different meanings, which also makes the translation of tests difficult (Olson & Jacobson, Reference Olson and Jacobson2015). Further, linguistic differences may affect performance in, for example, working memory tests, due to aspects such as word length (e.g., Georgas et al., Reference Georgas, Van de Vijver, Weiss, Saklofske and Georgas2003; Roivainen, Reference Roivainen2019). The number of bilinguals in a population is also one factor that can relate to test performance between cultures (e.g., Garratt & Kelly, Reference Garratt and Kelly2007; Lauchlan et al., Reference Lauchlan, Parisi and Fadda2012; Rosselli et al., Reference Rosselli, Ardila, Navarrete and Matute2010). For instance, there seems to be a monolingual advantage in vocabulary (Bialystok et al., Reference Bialystok, Luk, Peets and Yang2010), for young children especially in expressive vocabulary (Korkman et al., Reference Korkman, Stenroos, Mickos, Westman, Ekholm and Byring2012; Korpinen et al., Reference Korpinen, Slama, Rosenqvist and Haavisto2023; Thordardottir, Reference Thordardottir2011). However, linguistic reasons cannot be the only explanation for cross-cultural differences, since differences have been found also on nonverbal tests (Roivainen, Reference Roivainen2019; Rosselli & Ardila, Reference Rosselli and Ardila2003) as well as between people from different countries who speak the same language (Babcock et al., Reference Babcock, Miller, Saklofske and Zhu2018; Duggan et al., Reference Duggan, Awakon, Loaiza and Garcia-Barrera2019; Miller et al., Reference Miller, Weiss, Beal, Saklofske, Zhu and Holdnack2015).
Sociodemographic factors, such as education level, are also known to be associated with cross-cultural differences in cognitive test performance (Olson & Jacobson, Reference Olson and Jacobson2015). For children, parental education level explains a significant proportion of the variance in cognitive test scores, including WPPSI-IV (Eriksen et al., Reference Eriksen, Kesmodel, Underbjerg, Kilburn, Bertrand and Mortensen2013; Park & Lee, Reference Park and Lee2016; Raiford et al., Reference Raiford, Coalson, Engi, Raiford and Coalson2014; Wechsler, Reference Wechsler2014). Differences in the education system the child belongs to can also have an effect, which is shown, for example, in international comparisons of educational attainment (Leino et al., Reference Leino, Ahonen, Hienonen, Hiltunen, Lintuvuori, Lähteinen, Lämsä, Nissinen, Nissinen, Puhakka, Pulkkinen, Rautopuro, Sirén, Vainikainen and Vettenranta2019; Schleicher, Reference Schleicher2019). Lastly, age (Korkman et al., Reference Korkman, Lahti-Nuuttila, Laasonen, Kemp and Holdnack2013; Rosenqvist et al., Reference Rosenqvist, Lahti-Nuuttila, Urgesi, Holdnack, Kemp and Laasonen2017) and sex (Giofrè et al., Reference Giofrè, Allen, Toffalini and Caviola2022; Palejwala & Fine, Reference Palejwala and Fine2015; Walter et al., Reference Walter, Daseking and Pauls2020) are associated with cognitive test performance, and these associations may be mediated by cultural factors. For example, developmental curves have been shown to differ between different cultures (Rosenqvist et al., Reference Rosenqvist, Lahti-Nuuttila, Urgesi, Holdnack, Kemp and Laasonen2017).
More subtle cultural differences may also contribute to the discrepancies in test performance between cultural groups. Ardila (Reference Ardila2005) presented cultural factors that may affect cognitive testing, including the social elements of the testing situation, the expectancy to do one’s best, as well as different culture-dependent elements (e.g., pictures) used in the tests. For example, Georgas et al. (Reference Georgas, Van de Vijver, Weiss, Saklofske and Georgas2003) found that South Korean children performed significantly better in some processing speed tests than children from many other countries, which was thought to be a result of cultural values about educational achievement. Differences in processing speed tests have also been hypothesized to be related to familiarity and values regarding speeded performance (Agranovich et al., Reference Agranovich, Panter, Puente and Touradji2011; Ardila, Reference Ardila2005; Eizaguirre et al., Reference Eizaguirre, Vanotti, Aguayo Arelis, Rabago Barajas, Cores, Macías, Benedict and Cáceres2020). Presumably, there are also cultural factors affecting cognitive test performance yet to be identified (Olson & Jacobson, Reference Olson and Jacobson2015).
Some differences found in cross-cultural comparisons could also relate to aspects of the standardization process. Differences regarding sample size and exclusion criteria could lead to some variability in standardized scores in the normative samples (e.g., Roivainen, Reference Roivainen2013). Nevertheless, the normative samples are meant to represent the general population and its normal variability and hence reflect the culture and demographics of that population.
Aims
The main aim of the present study was to compare the performance of Finland-Swedish 5–6-year-old children on the Swedish WPPSI-IV to the Scandinavian test norms. Since previous studies have shown differences in test performance also between different cultures with the same language (e.g., Babcock et al., Reference Babcock, Miller, Saklofske and Zhu2018), we hypothesized that some differences would be found between the Finland-Swedish children’s performance and the Scandinavian test norms. Further, this study aimed to explore how age, sex, bilingualism, and parental education relate to the WPPSI-IV performance of Finland-Swedish children. Based on previous results (e.g., Giofrè et al., Reference Giofrè, Allen, Toffalini and Caviola2022; Korpinen et al., Reference Korpinen, Slama, Rosenqvist and Haavisto2023; Raiford et al., Reference Raiford, Coalson, Engi, Raiford and Coalson2014; Rosenqvist et al., Reference Rosenqvist, Lahti-Nuuttila, Urgesi, Holdnack, Kemp and Laasonen2017), we hypothesized that there would be some associations between sociodemographic variables and WPPSI-IV performance. These results are important to psychologists working with this minority, but also contribute to the growing field of cross-cultural child neuropsychology.
Methods
Participants
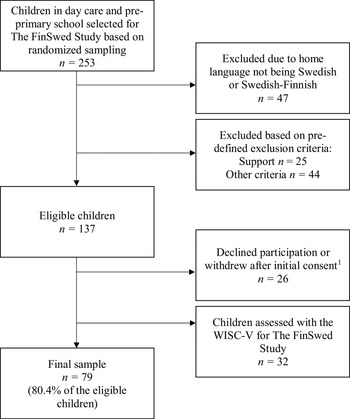
The sample in the present study consisted of 79 Finland-Swedish children aged 5:0–6:11 years assessed for The FinSwed Study, a large study examining how Finland-Swedish children perform on Swedish cognitive tests. Only monolingual Swedish-speaking and bilingual Swedish-Finnish-speaking children attending Swedish-speaking daycare or pre-primary school were included. Bilingualism was reported by parents. All bilinguals had been exposed to both languages before the age of one (as described in Korpinen et al., Reference Korpinen, Slama, Rosenqvist and Haavisto2023). The exclusion criteria were based on the exclusion criteria for the standardization of the Scandinavian WPPSI-IV (Wechsler, Reference Wechsler2014). The sample thus included typically developing children with no developmental, neurological, or psychiatric diagnosis, or individual support. Information about the exclusion process is provided in Figure 1. Demographics of the sample are presented in Table 1.

Figure 1. Flow chart of the exclusion process. Note. 1Four families withdrew after initial consent due to the COVID-19 pandemic.
Table 1. Demographic characteristics of the sample (N = 79)

Note. Parental education was grouped into three levels: Level 1: Upper secondary education, vocational education, or lower; Level 2: Bachelor’s degree or University of applied sciences degree; Level 3: Master’s or Doctoral degree. Ages reported in the table are the ages during the first assessment session.
Procedure
The study was completed in accordance with the Helsinki Declaration. Ethical approval was granted by the University of Helsinki Ethical Review Board in the Humanities and Social and Behavioural Sciences 6/2019. The Heads of Early Childhood Education of each municipality, heads of each participating daycare and pre-primary school, and parents of the participating children gave their written consent before participation.
The sampling procedure was carried out to represent the Swedish-speaking population in mainland Finland. All bilingual regions in Finland were included in the study. Municipalities were chosen within these regions to match the percentage of Finland-Swedish children living in urban, semi-urban, and rural areas, as well as the education level of the region. For practical reasons, clinical psychologists assisting with the data collection chose which daycares and pre-primary schools to include. Randomized sampling was then used within the chosen daycares and pre-primary schools. The final sample was representative of the Finland-Swedish population census (Official Statistics of Finland, 2017) regarding home region and type of region (urban, semi-urban, rural). However, parental education level for the present study sample (see Table 1) was significantly higher than the education level of Finland-Swedish 30–40-year-olds from bilingual regions in general, of which 25.6% have a higher university degree, χ2 (1, n = 156) = 20.03, p < .001 (Official Statistics of Finland, 2017).
The cognitive assessments were administered by clinical psychologists or trained research assistants during 10/2019–2/2021. All protocols were examined and, if needed, corrected when the data was transferred to electronical form. Most of the assessments were conducted before the outbreak of the COVID-19 pandemic (n = 56). Assessments were typically divided into three sessions (range = 1–6), which included breaks if needed. Due to the pandemic and societal restrictions, for three children, the interval between sessions was longer than 2 months. In these cases, test scores for the latter sessions were calculated using a new test age. During three assessments, the administrator wore a face mask, following the recommendations of mask use in Finland. No children wore masks during the assessments.
Measures
WPPSI-IV
WPPSI-IV (Wechsler, Reference Wechsler2014) is a test used by psychologists to measure general cognitive ability in children aged 2:6–7:7 years. For children aged 4:0–7:7 years, the Swedish test version consists of 15 subtests (M = 10, SD = 3), which produce scores for five primary indexes (M = 100, SD = 15): Verbal Comprehension Index (VCI), Visual Spatial Index (VSI), Fluid Reasoning Index (FRI), Working Memory Index (WMI), and Processing Speed Index (PSI); four ancillary indexes, of which only Vocabulary Acquisition Index (VAI) was used in this study; as well as the Full Scale IQ (FSIQ, M = 100, SD = 15). These are presented in Table 2. The Swedish test version has Scandinavian norms gathered in Sweden, Norway, and Denmark (Wechsler, Reference Wechsler2014).
Table 2. Means, SD, and ranges for the subtests and indexes in the Finland-Swedish sample (N = 79)

Note. The bolded subtests compose the FSIQ. The Verbal Comprehension Index is composed by the two bolded subtests. The processing speed subtest Animal Coding was not administered in this study.
The appropriateness of the language used in the test was evaluated by the researchers in The FinSwed Study, with assistance from a linguist. The language was generally regarded as suitable for the Finland-Swedish population. However, some minor phrasing modifications were made. In three country-specific items of the Information subtest, questions regarding Finland were asked in addition to the questions about Sweden.Footnote 1 The scaled scores were calculated based on the questions regarding Finland.
Background information
Parents of the participating children completed a background questionnaire with questions regarding the child’s home language, daycare background, possible developmental problems, and medical conditions, as well as regarding the parents’ language and education. The parents’ level of education was categorized into three levels.
Data analyses
Due to missing data, mainly caused by administration errors, some items were imputed using Expectation Maximation estimation. There were missing data in six subtests, five on item and one on subtest level, for 1–2 participants each. Data was imputed for seven children, in 1–2 subtests each. All final imputed values were in the expected range.
Based on graphical inspection, assumptions for normal distribution were met. The variance was compared to the expected SD of 3 for subtests and 15 for indexes, using one-sample chi-square test, with Bonferroni correction. The analyses were first done for the five primary indexes and the VAI together with FSIQ and then for the 13 subtest scores using the EnvStats-package (Millard, Reference Millard2013). The variance of the Information subtest (χ2 (78) = 128.49, p = .008), and the VCI (χ2 (78) = 132.97, p = .001), were significantly larger in the present sample than in the normative sample (see Table 2).
In the main analysis, a MANOVA was used to compare the performance of Finland-Swedish children on the 14 subtests against the normative means of the Scandinavian WPPSI-IV norms. Further, a t-test was undertaken to compare performance on the FSIQ. The differences in individual subtests and indexes were further analyzed using confidence intervals based on nonparametric bootstrapping with 5000 resamples using MANOVA.RM (Friedrich et al., Reference Friedrich, Konietschke and Pauly2019). Paired samples t-test was used to compare the results in the Information subtest when Finland-specific or Sweden-specific items were used. Multiple linear regression analyses were performed to analyze the influence of sociodemographic factors (age, sex, bilingualism, and parental education) on the WPPSI-IV indexes and the FSIQ. To further examine the effect of age, generalized additive model (GAM) using cubic regression splines (O’sullivan et al., Reference O’sullivan, Yandell and Raynor1986; Wood & Augustin, Reference Wood and Augustin2002) was used with the mgcv-package (Wood, Reference Wood2017). Finally, to explore the effect of the sample’s overrepresentation of highly educated parents, another t-test was conducted in a subsample matched by maternal education level to the Scandinavian normative sample. Significance was set at two-tailed p ≤ .05. Eta-squared (η2), Cohen’s d, and R 2 were used as measures of effect size. Statistical analyses were completed using IBM SPSS Statistics 28.0 and R software version 4.05.
Results
Performance on the WPPSI-IV compared to Scandinavian norms
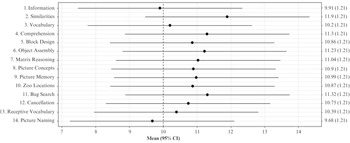
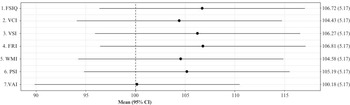
Based on MANOVA, there was a significant main effect in the WPPSI-IV, Wilk’s lambda = 0.39, F(14, 65) = 7.55, p < .001, η 2 = .07, with Finland-Swedish children performing significantly higher compared to the Scandinavian population norms, with a medium effect size. The FSIQ was also significantly higher in Finland-Swedish children compared to the Scandinavian population norms, t(78) = 4.30, p < .001, d = 0.48. When using bootstrapped confidence interval comparisons, no significant differences were found in individual subtests or indexes, nor in the FSIQ (Figures 2 and 3).

Figure 2. Means and bootstrapped confidence intervals (standard errors presented in parenthesis) of WPPSI-IV subtest scores compared to the Scandinavian norms (Mean = 10).

Figure 3. Means and bootstrapped confidence intervals (standard errors presented in parenthesis) of WPPSI-IV FSIQ and index scores compared to the Scandinavian norms (Mean = 100). Note. FSIQ: Full Scale IQ; VCI: Verbal Comprehension Index; VSI: Visual Spatial Index; FRI: Fluid Reasoning Index; WMI: Working Memory Index; PSI: Processing Speed Index; VAI: Vocabulary Acquisition Index.
Country-specific verbal items
The mean standard score for the Information subtest was significantly higher when the Finland-specific questions were used (M = 9.90) instead of the Sweden-specific ones (M = 9.48), t (76) = −2.97, p = .004, d = 0.11 (n = 77, data missing for two participants). The largest differences in standard scores due to these items were found in children with high total raw scores (range of difference in standard scores: 0–6).
Relationship with age, sex, bilingualism, and parental education
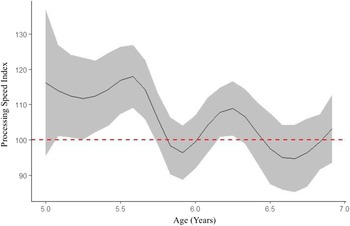
Multiple linear regression analyses (Table 3) presented significant associations in the WMI, PSI, and VSI with age. However, visual inspection showed some outliers in these indexes (VSI n = 6, WMI n = 2, PSI n = 4), which were then excluded. In follow-up regression analyses, only the PSI age effect remained significant (p = .002), with standardized test scores decreasing with increasing age. The PSI was also the only primary index showing a significant effect of age when using GAM (Figure 4), which showed that especially the youngest children performed significantly higher than the Scandinavian mean, whereas older children performed similarly to the norms. The nonlinearity in the middle of the curve is a result of the outliers mentioned previously.

Figure 4. Generalized additive model showing age effects on the PSI (N = 79).
Table 3. Multiple linear regression analyses exploring the relationships between sociodemographic variables and performance on WPPSI-IV FSIQ and indexes (N = 79)

Note. PED: Parental education; FSIQ: Full Scale IQ; VCI: Verbal Comprehension Index; VSI: Visual Spatial Index; FRI: Fluid Reasoning Index; WMI: Working Memory Index; PSI: Processing Speed Index; VAI: Vocabulary Acquisition Index.
10 = Girl, 1 = Boy, 20 = Monolingual, 1 = Bilingual, 30 = PED Level 1 and Level 3, 1 = PED Level 2, 40 = PED Level 1 and Level 2, 1 = PED Level 3.
There was also a significant difference in the VCI depending on parental education level: Children with parents with a higher university degree (Level 3) performed significantly better than children with parents with upper secondary or vocational education (Level 1). Bilingual children performed significantly lower on the VSI and VAI compared to monolingual children. Girls scored significantly higher on the PSI than boys.
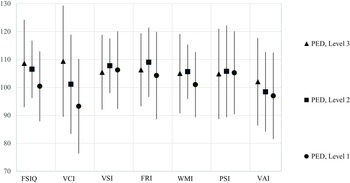
The effect of parental education level was further explored by inspecting the FSIQ and index scores for all levels of education (Figure 5). Children of parents with lower education levels (upper secondary or vocational education) performed similarly as the normative mean or higher in all indexes except the VCI and the VAI.

Figure 5. Means and SD in the FSIQ and indexes according to parental education level (N = 79). Note. PED: Parental education level; Level 1: Upper secondary education, vocational education, or lower; Level 2: Bachelor’s degree or University of applied sciences degree; Level 3: Master’s or Doctoral degree. FSIQ: Full Scale IQ; VCI: Verbal Comprehension Index; VSI: Visual Spatial Index; FRI: Fluid Reasoning Index; WMI: Working Memory Index; PSI: Processing Speed Index; VAI: Vocabulary Acquisition Index.
To examine how much the overrepresentation of highly educated parents affected the results, a follow-up t-test was done with a sample that matched the Scandinavian normative sample regarding maternal education level. Children with mothers with a Bachelor’s or University of applied sciences degree (Level 2) and with a Master’s or Doctoral degree (Level 3) were randomly excluded until the proportions of the three education levels matched the Scandinavian normative group. The results showed that the FSIQ was still significantly higher (n = 40, M = 105.00, SD = 13.61) for the Finland-Swedish children than the normative mean, t (39) = 2.32, p = .025, d = 0.37.
Discussion
The main aim of the present study was to compare Finland-Swedish 5–6-year-old children’s performance on the WPPSI-IV to the Scandinavian test norms. Assessments during this age are important, but there is a risk for inaccuracy when using norms gathered in one culture with individuals from another culture (e.g., Babcock et al., Reference Babcock, Miller, Saklofske and Zhu2018). As the Swedish WPPSI-IV is the most commonly used cognitive test for assessing young Finland-Swedish children (Rosenqvist et al., Reference Rosenqvist, Slama and Haavisto2022), information about how this test and its Scandinavian norms are generalizable to this minority is necessary. This study showed that Finland-Swedish children, in general, scored approximately 1/3 SD higher on the WPPSI-IV than the Scandinavian normative group. Different sociodemographic factors (age, sex, bilingualism, and parental education) were also found to relate to WPPSI-IV performance, which was expected based on previous research with other tests (e.g., Giofrè et al., Reference Giofrè, Allen, Toffalini and Caviola2022; Korkman et al., Reference Korkman, Stenroos, Mickos, Westman, Ekholm and Byring2012; Raiford et al., Reference Raiford, Coalson, Engi, Raiford and Coalson2014; Rosenqvist et al., Reference Rosenqvist, Lahti-Nuuttila, Urgesi, Holdnack, Kemp and Laasonen2017).
In general, Finland-Swedish children performed higher on the Swedish WPPSI-IV than the Scandinavian norms with medium effect sizes. The mean FSIQ of Finland-Swedish children was almost 7 IQ scores higher than in the norms, and 5 IQ scores higher when the education levels were matched to the normative group. However, when using confidence interval comparisons, no individual subtest or index differed significantly from the norms. This may be due to the present sample size being modest. Further, it is noteworthy that confidence interval comparisons are a stricter method than pairwise t-tests. Previous studies using t-tests with large samples have found significant results with group differences smaller than in the present study (e.g., Babcock et al., Reference Babcock, Miller, Saklofske and Zhu2018; Park & Lee, Reference Park and Lee2016).
There are some possible explanations as to why this sample of Finland-Swedish children scored overall higher than the normative Scandinavian sample of the WPPSI-IV. One reason could be differences in the exclusion criteria of the samples. Although the exclusion criteria for the present study followed the criteria in the WPPSI-IV manual (Wechsler, Reference Wechsler2014), there are differences between the countries (e.g., regarding educational support and diagnostics) that may have led to more strict exclusions from the sample. This may also have inflated the parental education. In the present sample, 18.6% of the selected children were excluded due to language and 27.3% due to exclusion criteria. However, a comparison of the exclusions could not be made since this information is not provided in the WPPSI-IV manual. Further, the performance of the present sample was normally distributed with a similar variance as in the normative data in all but one subtest and one index, which suggests that the exclusion criteria have not been too strict.
Another factor that may explain the generally higher scores for Finland-Swedish children is parental education level. Finland-Swedes are, in general, a quite highly educated population, also compared to the Scandinavian countries (Eurostat, 2022; Official Statistics of Finland, 2017). The sample for this study, however, had an overrepresentation of parents with higher university education (44.3% of the mothers), both compared to the population census for Finland-Swedes (25.6%) and the Scandinavian WPPSI-IV normative sample (22.2%). Furthermore, the present study had an underrepresentation of parents with lower education levels, which was also the case in the Scandinavian normative sample (Wechsler, Reference Wechsler2014). Since parental education level is a well-known predictor of cognitive test performance (Eilertsen et al., Reference Eilertsen, Thorsen, Holm, Bøe, Sørensen and Lundervold2016; Eriksen et al., Reference Eriksen, Kesmodel, Underbjerg, Kilburn, Bertrand and Mortensen2013), this is presumably one reason for the high scores of the present sample. Nonetheless, children with parents in the lowest education level (upper secondary or vocational education) still performed similarly as the normative mean or higher in all indexes except the VCI and the VAI. Additionally, when matching the present sample with the Scandinavian normative sample regarding the maternal education levels, the mean FSIQ was still significantly higher by 5 IQ scores compared to the Scandinavian norms. The maternal education level of the follow-up subsample also represented the population census for 30–40-year-old Finland-Swedes (Official Statistics of Finland, 2017). The sample size in this follow-up analysis was, however, quite small (n = 40), which increases the likelihood of a type 2 error. Nevertheless, it seems that the higher scores in the Finland-Swedish sample can only partly be explained by the overrepresentation of highly educated parents, whereas the rest of the difference represents some other characteristics in the Finland-Swedish population or variations between the samples.
Moreover, the difference in the FSIQ between children with parents in the lowest education level group (upper secondary or vocational degree) and children with parents in the highest education level group (higher university degree) was in this study smaller (Mean difference = 8.2) than in the WPPSI-IV US normative sample (Mean difference = 12.5) (Raiford et al., Reference Raiford, Coalson, Engi, Raiford and Coalson2014). This, together with the fact that parental education level did not significantly affect performance on the FSIQ when other sociodemographic factors were taken into account, is consistent with previous studies discussing that the association between parental socioeconomic status and cognitive performance may be smaller in Finland and the Scandinavian countries compared to other countries (for a summary, see Eilertsen et al., Reference Eilertsen, Thorsen, Holm, Bøe, Sørensen and Lundervold2016).
Although Finland and the Scandinavian countries have similar cultures, there are still cultural and linguistic factors that could explain some of the differences in the WPPSI-IV scores. For example, the education system in Finland differs in some regard from the education system in Scandinavian countries, and there are differences in how the countries perform on international comparisons of educational attainment, in which Finland usually has had somewhat higher scores (Leino et al., Reference Leino, Ahonen, Hienonen, Hiltunen, Lintuvuori, Lähteinen, Lämsä, Nissinen, Nissinen, Puhakka, Pulkkinen, Rautopuro, Sirén, Vainikainen and Vettenranta2019; Schleicher, Reference Schleicher2019). Presumably, there are also systemic and cultural differences in the early childhood education systems between Finland and the Scandinavian countries, which could lead to some differences in WPPSI-IV scores. In addition, linguistic differences and bilingualism may also affect results, especially in the verbal subtests, which is further discussed below.
Differences in verbal subtests and indexes
The difference in mean scores between Finland-Swedish children and the Scandinavian norms was in general smaller for verbal subtests than for nonverbal ones. Four out of six verbal subtests were close to the Scandinavian mean, with Similarities and Comprehension being exceptions. The VCI and the VAI were also the indexes closest to the Scandinavian normative mean. This is somewhat surprising since in general, it is thought that verbal subtests are more culturally dependent than nonverbal ones (Wechsler, Reference Wechsler2014). Additionally, out of all index scores, performance on the VCI was most strongly predicted by parental education level. This is in line with previous studies showing that parental education level seems to have a larger effect on verbal than nonverbal subtests (e.g., Cianci et al., Reference Cianci, Orsini, Hulbert and Pezzuti2013; Eilertsen et al., Reference Eilertsen, Thorsen, Holm, Bøe, Sørensen and Lundervold2016; Rindermann et al., Reference Rindermann, Flores-Mendoza and Mansur-Alves2010). Although the present sample had an overrepresentation of highly educated parents, Finland-Swedish children performed generally better in nonverbal than verbal tests. Thus, it seems that the verbal subtests were slightly more difficult for this population. Likewise, Finland-Swedish clinicians have expressed concerns regarding the verbal subtests (Rosenqvist et al., Reference Rosenqvist, Slama and Haavisto2022). Similar results have been found for South Korean children, who performed lower in the verbal subtests than in the nonverbal subtests of WPPSI-IV when scored with American norms (Park & Lee, Reference Park and Lee2016). Regarding the VAI, which measures basic receptive and expressive language skills (Wechsler, Reference Wechsler2012), the Finland-Swedish children’s performance may also reflect the nature of the subtests in this index. After reaching the average level of performance, there are only a few items left for 5–6-year-olds and these items seem to have a relatively high level of difficulty.
Another reason for the relatively lower verbal scores may be that approximately 40% of the children in the sample (and in the population census, Saarela, Reference Saarela2021) were bilingual. Bilingualism predicted significantly lower scores on the VAI. A similar trend was also found for the VCI, which measures verbal reasoning, verbal concept formulation, and acquired knowledge (Wechsler, Reference Wechsler2012). Previously, the bilinguals in this study have been shown to perform significantly lower on Similarities, Vocabulary, and Picture Naming than monolinguals (Korpinen et al., Reference Korpinen, Slama, Rosenqvist and Haavisto2023). Similar bilingual disadvantages in expressive vocabulary tasks have also been found previously in young Finland-Swedish children (Korkman et al., Reference Korkman, Stenroos, Mickos, Westman, Ekholm and Byring2012; Westman et al., Reference Westman, Korkman, Mickos and Byring2008) and internationally (e.g., Thordardottir, Reference Thordardottir2011).
The Similarities and Comprehension subtests had two of the largest mean differences compared to the Scandinavian norms. In addition to verbal skills, these subtests require abstract reasoning and the performance on these subtests was, thus, in line with the Finland-Swedish children’s performance on nonverbal abstract reasoning tasks. Similarities also measures associative and categorical thinking (Wechsler, Reference Wechsler2012), and perhaps these kinds of tasks are practiced more in Finland-Swedish early childhood education. Likewise, Finland-Swedish school-aged children have scored significantly higher in the Similarities subtest of WISC-V when compared to the Scandinavian norms (Rosenqvist et al., Reference Rosenqvist, Slama and Haavisto2023).
There were also some differences in the country-specific items in the Information subtest. Some children were better at answering the questions regarding Sweden, which can presumably be explained by the fact that Finland-Swedish children often consume Swedish media and Swedish child literature. However, overall, Finland-Swedish children scored higher and the standard score for Information was significantly higher when Finland-specific questions were used. This highlights the importance of using items suitable for the cultural group being assessed, but also shows that culture and media can overlap between countries, and therefore developing and adapting a subtest like this is far from straightforward.
Differences in nonverbal subtests and indexes
Finland-Swedish children performed, on average, 6 index scores higher than the mean on the nonverbal indexes VSI, FRI, WMI, and PSI. The mean scaled score for the individual nonverbal subtests was approximately 11. The performance on the nonverbal subtests was more leveled compared to the verbal subtests, without distinct high or low results.
Some relationships between sociodemographic factors and the nonverbal indexes were found. Of particular interest was the significant age effect on the PSI, in which increasing age led to lower scaled scores. The youngest children in the sample (approximately 5–5.5-year-olds) performed significantly higher than the Scandinavian mean, whereas slightly older children (6–7-year-olds) performed closer to the Scandinavian mean. Previous research has shown that the developmental curves and spurts may differ between cultures (Byrd et al., Reference Byrd, Arentoft, Scheiner, Westerveld and Baron2008; Rosenqvist et al., Reference Rosenqvist, Lahti-Nuuttila, Urgesi, Holdnack, Kemp and Laasonen2017). It is possible that the skills measured by the PSI are practiced earlier in Finnish early childhood education, since there is no difference in performance for the oldest children in this sample, nor for school-aged children using WISC-V (Rosenqvist et al., Reference Rosenqvist, Slama and Haavisto2023).
The bilinguals in this sample also scored significantly lower on the VSI than monolinguals. This is quite surprising since there were no differences between mono- and bilingual Finland-Swedish children in nonverbal subtests of the WPPSI-R (Korkman et al., Reference Korkman, Stenroos, Mickos, Westman, Ekholm and Byring2012). Korpinen et al. (Reference Korpinen, Slama, Rosenqvist and Haavisto2023, based on the same data as the present study) have further discussed this result and the possibility of it being a chance finding. There was also a significant relationship between sex and the PSI, with girls scoring significantly higher. Similarly, a recent meta-analysis concluded that females have been shown to perform significantly better than males on WISC processing speed tasks and that this finding has been stable over the years (Giofrè et al., Reference Giofrè, Allen, Toffalini and Caviola2022).
Conclusions and clinical implications
The present study aimed to assess the generalizability of the Swedish WPPSI-IV and its Scandinavian norms to the Finland-Swedish population and to explore the association between WPPSI-IV performance and sociodemographic variables. The results showed significant differences between Finland-Swedish children and the Scandinavian norms and indicate that using the Swedish version with the Finland-Swedish minority imposes some challenges on clinicians. The results also showed that many sociodemographic variables were related to cognitive performance. This further demonstrates that it is complicated to use cognitive tests with individuals from a population with different demographics than the normative group.
This study contributes to a field where information has been lacking and provides support for clinicians to use the Swedish WPPSI-IV with Finland-Swedish children, albeit with caution. Performance on the WPPSI-IV was, in general, significantly higher in the Finland-Swedish minority compared to the Scandinavian norms, with medium-sized effects. These results can partly be explained by the overrepresentation of highly educated parents in the sample, but presumably also by some characteristics in the Finland-Swedish population. The FSIQ was significantly higher than the Scandinavian mean, also when matching parental education to the normative sample. This is essential to remember in clinical settings, as test scores are used to make important clinical decisions. Using the Scandinavian norms directly may lead to milder learning disabilities not being detected. The nonverbal subtests seem to produce scores that are all somewhat higher than the norms, whereas the verbal subtests seem to produce more variable test scores. Performance on verbal subtests requiring abstract reasoning was in line with the performance on nonverbal subtests, while verbal subtests assessing vocabulary or factual knowledge produced the lowest relative scores. Age and bilingualism are also factors important to take into account when interpreting results from WPPSI-IV assessments. In particular, the Scandinavian norms for the PSI seem to be more suitable for Finland-Swedish 6-year-olds than 5-year-olds, whereas bilingualism seems to relate to especially verbal subtests requiring basic vocabulary.
In sum, this study shows that for young children, there are differences in cognitive test performance between cultural groups, despite having the same language and quite a similar culture. Thus, clinicians need to be careful with their interpretations when using norms and tests from other cultures.
Acknowledgements
We thank all the families and clinicians who participated in the data collection and Lecturer of Psychometrics Jari Lipsanen for conducting the main statistical analyses for the study.
Funding statement
The study is supported by a personal grant from Victoriastiftelsen (J.S.) and by grants given to The FinSwed Study by The Swedish Cultural Foundation in Finland, The association Svenska folkskolans vänner, and the foundations Stiftelsen Brita Maria Renlunds minne sr and Oskar Öflunds stiftelse.
Competing interests
None.


 Open access