


Introduction
Weed management is essential in row crops. In corn and soybean, weed interference can reduce yields by 50% (Landau et al. Reference Landau, Hager and Williams2022; Soltani et al. Reference Soltani, Dille, Burke, Everman, VanGessel, Davis and Sikkema2016, Reference Soltani, Dille, Burke, Everman, VanGessel, Davis and Sikkema2017). Fertilization, especially nitrogen, is compulsory in corn but can be partly tailored based on crop uptake (Martins et al. Reference Martins, Pinto, Moura, Siqueira and Villar2020; Ziadi et al. Reference Ziadi, Angers, Gagnon, Lalande, Morel, Rochette and Chantigny2014). In soybean, the application of additional mineral fertilizer can be omitted when in rotation with fertilized corn (Légère et al. Reference Légère, Stevenson and Ziadi2008; Ziadi et al. Reference Ziadi, Angers, Gagnon, Lalande, Morel, Rochette and Chantigny2014). Other flexible interventions include tillage. Tillage is optional in row crops due to the increasing importance of soil conservation and the concurrent development of no-till farming (Huggins and Reganold Reference Huggins and Reganold2008). Optimizing fertilization and soil conservation might, unfortunately, increase weed pressure.
Nitrogen can stimulate weed seed germination and emergence (Little et al. Reference Little, DiTommaso, Westbrook, Ketterings and Mohler2021; Sweeney et al. Reference Sweeney, Renner, Laboski and Davis2008). Both nitrogen and phosphorus can increase weed growth, and uptake will vary between weed species (Blackshaw et al. Reference Blackshaw, Brandt, Janzen, Entz, Grant and Derksen2003; Blackshaw et al. Reference Blackshaw, Brandt, Janzen and Entz2004a, Reference Blackshaw, Molnar and Janzen2004b; Warren et al. Reference Warren, Hobbie, Chen and Smith2023). Accordingly, applications of both nutrients can modify weed communities (Pysek and Leps Reference Pysek and Leps1991; Yin et al. Reference Yin, Cai and Zhong2006).
Tillage will also modify weed composition (Légère et al. Reference Légère, Stevenson and Ziadi2008; Swanton et al. Reference Swanton, Shrestha, Roy, Ball-Coelho and Knezevic1999). Reduced tillage will generally require extra herbicide applications to replace the mechanical destruction and burial of weeds by cultivation (Chauhan et al. Reference Chauhan, Singh and Mahajan2012; Locke et al. Reference Locke, Reddy and Zablotowicz2002) and is often associated with an increase in the prevalence of grasses and perennial weeds (Buhler Reference Buhler, Hatfield, Buhler and Stewart1998; Locke et al. Reference Locke, Reddy and Zablotowicz2002). Conversely, annual broadleaf species, such as common lambsquarters (Chenopodium album L.) and velvetleaf (Abutilon theophrasti Medik.), are sometimes more abundant in conventional tillage (Buhler and Oplinger Reference Buhler and Oplinger1990; Teasdale et al. Reference Teasdale, Beste and Potts1991).
Whereas the short-term effects of fertilization and tillage on weed communities have been evaluated, multiyear effects are more difficult to ascertain. In a long-term corn–soybean rotation, the effects of fertilizer rates and reduced tillage on residual weeds present before harvest were evaluated after 12 to 13 yr (2004 to 2005) (Légère et al. Reference Légère, Stevenson and Ziadi2008). This evaluation revealed no or weak positive fertilizer effects on weed density and biomass, respectively, and a minimum 4-fold higher density or biomass in no-till. Annual broadleaf species, such as common ragweed (Ambrosia artemisiifolia L.) and common lambsquarters, dominated, with some association of the latter and an annual grass, barnyardgrass [Echinochloa crus-galli (L.) P. Beauv.], with no-till (Légère et al. Reference Légère, Stevenson and Ziadi2008). Reevaluating weed communities in the same plots 12 yr later with added survey periods provides insight into the stability of these communities over time. Moreover, in 2022, this long-term trial provided an opportunity to evaluate the effect of 30 yr of tillage and fertilization on weeds emerging after corn planting and left unmanaged until crop harvest. Our goal was to evaluate the effect of 24 yr of fertilizer rates and reduced tillage on weeds before and after herbicide applications as well as 6 yr later, following no postemergence weed management (no herbicides after planting). The effect on corn yields was also evaluated. We hypothesized that fertilization would have limited effects on managed weed communities and that weed density and biomass would be higher in no-till due to increases in annual monocotyledonous weeds (annual grasses) and perennials.
Materials and Methods
Location and Management of the Long-Term Trial
The study was initiated in 1992 at the Agriculture and Agri-Food Canada L’Acadie Experimental Farm (45.294°N, 73.345°W). More details on the trial are reported by Ziadi et al. (Reference Ziadi, Angers, Gagnon, Lalande, Morel, Rochette and Chantigny2014). Briefly, the soil is a Sabrevois/Saint-Blaise clay to clay loam (humic orthic gleisoil Eutrochepts), previously cropped with alfalfa (Medicago sativa L.). Soil characteristics in 1992 were 3.8% organic matter, 135 kg P ha−1 (Melich 3), 303 kg K ha−1, pH 6.3, and a P/Al saturation rate of 4.3% (Légère et al. Reference Légère, Stevenson and Ziadi2008). Corn was grown in 1992 to 1994, followed by soybean in 1995. Subsequently (1996 to present), corn and soybean were grown in alternate years. Glyphosate-tolerant hybrids were often planted from 2006 to present. In 2016, 2017, and 2022 (current study), the corn hybrids (2,700 corn heat units) were ‘Pioneer 38N86’ in 2016 and ‘Horizon Seeds HZ2944’ in 2022, and the soybean cultivar was ‘90Y90’ in 2017. Corn was seeded on May 18 (2016) or May 11 (2022) and harvested on October 19 (2016) or October 24 (2022). Soybean was seeded on May 25 and harvested on October 18.
The split-plot experimental design included tillage (conventional [CT] vs. no tillage [NT]) as the main plot factor, nitrogen rates (0, 80, and 160 kg N ha−1, hereinafter referred to as 0N, 1N, and 2N, respectively) and phosphorus rates (0, 40, and 80 kg ha−1 P2O5, hereinafter referred to as 0P, 1P, and 2P, respectively) in factorial combination as the subplot factor, and four replicates, for a total of 72 plots. Mineral fertilizers were applied only during the corn phase; the treatments 2N and 2P represent the recommended rates for grain corn in the area. Thus a first portion (0, 40, and 40 kg N ha−1) of nitrogen as urea, ammonium nitrate, or calcium ammonium nitrate was banded at planting, and the remaining to complete the rates was side-dressed at the 8-leaf stage. Phosphorus as triple superphosphate was banded in a single dose at planting.
The CT plots were moldboard plowed in autumn at a 20-cm depth and tilled twice at a 10-cm depth with a vibrating S-tine cultivator in the spring prior to seeding. The NT plots were ridge tilled from 1992 to 1997 and direct seeded without tillage from 1998 to 2005. Experimental units were 4.5 × 25 m. Both crops were sown in May of each year in 75-cm rows spaced 75 cm apart (six rows per plot) at a 3- to 4-cm depth. Corn was sown at 74,000 seeds ha−1 and soybean at 450,000 seeds ha−1. Soybean seed was inoculated with a commercial granular formulation of Bradyrhizobium japonicum.
In 2022, weedy and weed-free subplots (3 × 3 m) were established in two treatments only (unfertilized [0N0P] and double fertilized [2N2P]) at the opposite ends of the plots, each in the center of the 7.5 × 4.5 m area not used to evaluate yields, that is, out of the center 10-m strip collected at harvest. The weedy subplot was protected during postemergence herbicide application using plastic film, and the weed-free subplot was kept without weeds during the growing season by the herbicide applications and recurrent hand hoeing in tilled plots or weed clipping in no-till. Corn cobs were harvested manually in the center of these weedy and weed-free plots along 2 m of the two center rows (4 m in total), cobs were dried, and yield was adjusted based on 15% moisture.
Herbicides
Herbicides were selected according to weed spectrum and provincial recommendations for each crop. Herbicides and rates applied since 1992 are listed in Table 1. The extensive use of glyphosate only from 2006 to 2010 was not uncommon when glyphosate-tolerant crops were made available to producers. Fortunately, this lack of herbicide rotation did not select glyphosate-resistant weeds.
Table 1. Herbicide applications from 1992 to 2022 in the corn–soybean rotation. a

a Applications included tank mixtures (+) and formulated herbicide premix (/).
b Plus 2 L of ammonium sulfate (28-0-0).
c Plus mineral oil (0.5% v/v).
d Plus silicone surfactant (0.25% v/v).
e Plus mineral oil (0.2% v/v).
f Plus non-ionic adjuvant (0.2% v/v).
In 2016/corn and 2017/soybean, corn plots were treated with two postemergence applications: rimsulfuron + S-metolachlor + dicamba on June 3 and nicosulfuron/rimsulfuron (50%/50%) on June 16 (Table 1). Soybean plots were treated preplant with saflufenacil + glyphosate on May 19 and postemergence with glyphosate on July 7 and 14. A silicone surfactant was added to the glyphosate on July 7 (0.25% v/v) (Table 1).
In 2022/corn, plots were treated preplant with glyphosate + dicamba on May 6 and postemergence with dicamba/diflufenzopyr (50%/20%) + nicosulfuron/rimsulfuron (50%/50%) on May 31. This latter application included a non-ionic adjuvant (0.2% v/v) (Table 1).
Weed Data Collection
In herbicide-treated plots (2016/corn–2017/soybean), weed data were collected in all 72 plots in two 75 × 50 cm quadrats randomly located in different interrows at the opposite ends of each plot but closer to the center than the edges. Weeds were counted by species before the postemergence herbicide application, 2 wk after the last herbicide application, and at crop harvest. At crop harvest, weeds were clipped by species at ground level and dried to constant weight. The presence or absence of mature seeds on harvested plants was also noted. In weedy and weed-free plots (2022/corn), weeds were counted and weighed as described earlier in two 75 × 50 cm quadrats randomly located in different interrows at crop harvest. Weed species were also classified as monocotyledonous annual (annual grass [AG]), dicotyledonous annual (annual broadleaf [AB]), or dicotyledonous perennial (perennial broadleaf [PB]). Winter annuals were recorded as annuals because their frequencies were not high enough to warrant separate analyses, and field horsetail (Equisetum arvense L.), the only nonflowering species recorded, was included in the perennial broadleaf class. The rare monocotyledonous perennials were left out of the analyses.
Statistical Analyses
In herbicide-treated plots (2016/corn–2017/soybean), repeated-measures analyses of variance (ANOVAs) were completed to evaluate the effect of crop/year, fertilization, and tillage on total weed density and densities by weed type evaluated three times during each season (before and after the postemergence herbicide application and at harvest). Standard ANOVAs were completed to evaluate the effects of fertilization and tillage on total weed biomass, biomass by weed type, biomass by weed, weed species diversity indexes (richness, diversity, and evenness; detailed later), and crop yields. Crop yields in 2016 to 2017 were also correlated with weed densities evaluated three times during the growing season, as earlier, and with biomass at harvest. Graphs were split by variables when interactions were significant. Weed density and biomass values were log-transformed to meet model assumptions. Block was included as a random effect in all models. In 2022/corn, nonparametric Kruskall–Wallis analyses were used to evaluate the effect of fertilization and tillage on weed density and biomass as well as corn yield in unmanaged/weedy plots.
A principal component analysis (PCA) was completed on the correlation matrix of weed frequencies to explore the relationship between weed species present in 2016 to 2017 and fertilization and tillage treatments by extracting the principal component (PC) structure and examining interconnections using multiple dimensions. Weed species present in ≥15% of the plots, that is, those species with at least minimal representation across treatments, were included in the analysis. The number of significant PCs to retain from the PCA was selected based on an eigenvalue higher than 1 and a visualization of the score plot to establish a clear cutoff. The first PC always accounts for the greatest percentage of the total data variation. The significance of multiple correlations was verified using Bartlett’s test of sphericity and the Kaiser–Meyer–Olkin measure of sampling adequacy (KMO). The number of PCs to extract was determined using Caiser–Harris criteria and Cattell’ scree plot. Relationships and correlations among species were displayed with the biplot graphic. The longer the arrows are and the closer together they are, the higher are the correlations between species clusters. The threshold of statistical significance was set at P ≤ 0.05.
Descriptive statistical analyses and ANOVAs were performed using JMP Professional 16.0 (SAS Institute, Cary, NC, USA). PCAs were computed using the following packages of R statistical software version 3.6.1 (R Core Team, 2016): ade4, corrplot, FactoMiner, factorextra, and magrittr were used for factor analysis, and FactoMiner, factorextra, and RColorBrewer were R packages used for PCA visualization.
Weed species richness (total number of species), diversity (Hʹ), and evenness (E) were evaluated for each plot in 2016 to 2017 and 2022. Diversity and evenness were based on Shannon’s diversity index, $H' = - \mathop \sum \limits_{t = 1}^s \left( {pi\ln pi} \right)$ $E = H'/\ln N$
where pi is the proportion of each species in the plot based on counts and N is the total number of individuals in the plot. Hʹ and E were also calculated based on biomass. ANOVAs were done to evaluate the effect of crop/year, fertilization, and tillage on richness, diversity, and evenness values. Block was included as a random effect in all models. Because no significant year/crop effects were observed, on any 2016 to 2017 species composition data, both crop/years were pooled.
Results and Discussion
Seasonal Temperature and Precipitation
During the growing season (May to October), the mean temperature in the study area was 16.6 C (2016 and 2017) and 16.7 C (2022). The cumulative precipitation for the same months was 562.0 mm (2016), 543.3 mm (2017), and 616.7 mm (2022). These values are close to the 10-yr (2013 to 2022) averages of 16.6 C and 516.5 mm (Environment Canada 2023).
General Weed Composition
A total of 37 weed species was recorded during the evaluations (Table 2). The most frequent weeds based on the number of plots in which they were observed included large crabgrass [Digitaria sanguinalis (L.) Scop.], present in almost all plots (81% to 99%), followed by yellow foxtail [Setaria pumila (Poir.) Roem. & Schult.] (75% to 93%), rhombic copperleaf (Acalypha rhomboidea Raf.) (42% to 67%), dandelion (Taraxacum officinale F.H. Wigg.) (61% to 84%), broadleaf plantain (Plantago major L.) (38% to 47%), barnyardgrass (28% to 53%), common ragweed (21% to 63%), field horsetail (22% to 41%), and bird vetch (Vicia cracca L.) (31% to 38%) (Table 2). Twenty-five weed species were identified in 2004 to 2005 (Légère et al. Reference Légère, Stevenson and Ziadi2008) in the same plots. Of these, if we exclude rabbitfoot clover (Trifolium arvense L.) and smooth crabgrass [Digitaria ischaemum (Schreb.) Schreb. ex Muhl.], which could have been misidentified at the seedling stage, only wallflower mustard (Erysimum cheiranthoides L.) (<2% of plots in 2004 to 2005), red sorrel (Rumex acetosella L.) (<2% of plots), and one previously relatively frequent species, common milkweed (Asclepias syriaca L.) (6% to 25% of plots), were not reported in 2016, 2017, or 2022. Apart from the addition of 12 species, the most striking difference compared to 2004 to 2005 is in the higher frequency of two grasses, large crabgrass (<8% to >83%) and yellow foxtail (<14% to >74%). The frequency of one common broadleaf weed decreased, that of redroot pigweed (Amaranthus retroflexus L.), from 24% to 65% to <7%. Other notable differences include higher frequencies of broadleaf plantain (<12% to 38% to 47%), rhombic copperleaf (<26% to 42% to 67%), bird vetch (<12% to 31% to 38%), and field horsetail (<11% to 22% to 41%). The frequencies of common ragweed (21% to 58% vs. 21% to 63%) and barnyardgrass (11% to 47% vs. 28% to 53%) remained relatively equivalent to the 2004 to 2005 frequencies (Légère et al. Reference Légère, Stevenson and Ziadi2008; Table 2). Overall, there has been an increase in the number of weed species present in this corn–soybean rotation and a shift to annual grasses.
Table 2. Frequency of weed species recorded in herbicide-treated plots in 2016/corn and 2017/soybean and in plots that received no postemergence herbicide in 2022/corn.

Total Weed Density
Fertilization
Total weed density was not affected by fertilization in herbicide-treated plots in 2016 to 2017 (nine nutrient treatment combinations) on any of the survey dates (f = 1.159, P = 0.3307) or in unmanaged (weedy) plots in 2022 (chi-square = 2.82, P = 0.0929) (two nutrient treatment combinations). No significant interactions between this treatment and tillage were observed (details not shown). Likewise, weed density was not affected by fertilization in the same plots in 2004 and 2005 (Légère et al. Reference Légère, Stevenson and Ziadi2008). The absence of a fertilization effect in 2005 and 2017 could be related to the absence of added in-season fertilizer inputs in the nitrogen fixing soybean plots. In corn, lower crop growth in unfertilized plots (see later) may have masked any positive effect of added mineral fertilizer by modifying light quantity and quality reaching the soil surface as well as increasing its thermal amplitude, all factors that can increase weed germination (Egley and Duke Reference Egley, Duke and Duke1985; Thompson et al. Reference Thompson, Grime and Mason1977), although observations suggest that direct crop canopy effects are limited (Anderson Reference Anderson2008). Moreover, high weed densities are observed in disturbed unmanaged land (thus unfertilized), such as in vacant lots and on roadsides (Figueroa et al. Reference Figueroa, Saldías, Teiller, Carrera and Castro2020; Simard and Benoit Reference Simard and Benoit2010). Therefore, although increases in soil fertility, especially soil nitrates, can stimulate the germination and emergence of weed seeds (Brainard et al. Reference Brainard, DiTommaso and Mohler2006; Dyer Reference Dyer1995), the emergence of multispecific weed communities is probably not limited by nutrient availability in a corn–soybean rotation.
Tillage
Tillage affected total weed density in herbicide-treated plots in 2016 to 2017 (f = 89.496, P < 0001), and interactions with year/crop and survey date were significant (Figure 1). Weed densities were at least 2 times higher in no-till compared to tilled plots, except in 2016/corn soon after herbicide applications, when they were equivalent (Figure 1). In 2004/corn and 2005/soybean in the same plots, weed densities at harvest were also equal or 4 times higher in no-till, albeit averages were generally lower (Légère et al. Reference Légère, Stevenson and Ziadi2008). Tillage did not modify final densities when weeds were left unmanaged after crop planting (2022/corn) (chi-square = 0.893, P = 0.3446) (averaging 79.67 ± 10.73 weeds m−2) (Figure 1). High early-season interspecific competition, especially from larger broadleaf species, in these unmanaged plots could have reduced higher potential weed emergence in no-till (Goldberg et al. Reference Goldberg, Turkington, Olsvig-Whittaker and Dyer2001; Miller Reference Miller1987; Mohler and Calloway Reference Mohler and Calloway1995). Despite this discrepancy, weed densities were never lower in no-till compared to conventional tillage. High weed densities and seedbanks are common in no-till (Webster et al. Reference Webster, Cradina and White2003) and generally higher than in moldboard-plowed fields (Baker et al. Reference Baker, Madakadze, Swanepoel and Mavunganidze2018; Cardina et al. Reference Cardina, Regnier and Harrison1991; Mohler and Calloway Reference Mohler and Calloway1995). Only a few species that have persistent seedbanks, such as the annual broadleaf species, common lambsquarters, and velvetleaf, are sometimes more abundant in moldboard-plowed fields (Buhler and Oplinger Reference Buhler and Oplinger1990; Drewitz and Stoltenberg Reference Drewitz and Stoltenberg2018). Our spring counts also indicate that seedbanks were higher in no-till, especially of annual grasses (see later). We can only surmise that during this long-term trial, the limited use of herbicides with residual activity (2005 to 2012, 2019, 2021) that can lower the late-season emergence of grasses, such as S-metolachlor and imazethapyr, along with the absence of crops that are harvested early in the season, such as wheat (Triticum aestivum L.), allowing late-emerging weeds time to produce seeds, generated higher seedbanks that exacerbated tillage effects.

Figure 1. Average density and biomass of weeds in a corn–soybean rotation under moldboard-plowed or conservation tillage regimes since 1992. Weed density in herbicide-treated plots before, after, and at crop harvest (2016/corn–2017/soybean) and in unmanaged plots (no postemergence herbicide, 2022/corn) (A). Weed biomass at crop harvest in herbicide-treated plots (2016/corn–2017/soybean) and in unmanaged plots (no postemergence herbicide, 2022/corn) (B). Vertical bars represent standard errors. Asterisks indicate the significance of the tillage regime effect at ***P = 0.001.
Total Weed Biomass
Fertilization
Total weed biomass at harvest was not affected by fertilization in herbicide-treated plots in 2016/corn–2017/soybean (f = 0.9442, P = 0.4837) but was 1.47 times higher in fertilized unmanaged (weedy) plots in 2022/corn (chi-square = 4.4118, P = 0.0357) (125.31 ± 20.41 g m−2 vs. 184.65 ± 20.41 g m−2). Biomass per weed was also unaffected by fertilization in herbicide-treated plots (f = 1.13, P = 0.3493; average = 0.386 ± 0.037 g plant−2) and higher in fertilized unmanaged (weedy) plots (4.8 ± 0.73 g plant−1 vs. 2.5 ± 0.65 g plant−1; chi-square = 10.27, P = 0.0014). Fertilization generally increases weed growth (Blackshaw and Brandt Reference Blackshaw and Brandt2008; Little et al. Reference Little, DiTommaso, Westbrook, Ketterings and Mohler2021), and added nitrogen increases its uptake (Lindsey et al. Reference Lindsey, Warncke, Steinke and Everman2013). Other than the absence of added fertilization in 2017/soybean, the absence of a positive fertilization effect on weed biomass in 2016 to 2017, also observed by Légère et al. (Reference Légère, Stevenson and Ziadi2008), is explainable by the fact that biomass data in Légère et al. and in this 2016 to 2017 evaluation were limited to weeds that emerged after herbicide application, when extra nutrients had potentially already been absorbed by the crop and the weeds that were ultimately controlled by the herbicides. In 2022/corn, the unmanaged weeds grew all season and therefore benefited from the extra nutrients. It is not possible to determine which nutrient generated this increase because only plots with both added nitrogen and added phosphorus were evaluated, but nitrogen has been shown to increase weed biomass and competitiveness toward a wheat crop (Blackshaw and Brandt Reference Blackshaw and Brandt2008).
Tillage
Total weed biomass at harvest was affected by tillage (f = 39.31, P < 0001), averages being at least 2 times higher in no-till (Figure 1), while biomass per weed was unchanged (f = 0.0790, P = 0.779). In the weedy 2022 plots surveyed at harvest, tillage did not modify final weed biomass when weeds were left unmanaged (chi-square = 0.5404, P = 0.4948) (153.93 ± 16.63 g m−2) (Figure 1) or biomass per weed (chi-square = 0.0245, P = 0.8757). Because biomass per weed was not modified by tillage, the observed higher weed biomass in herbicide-treated no-till plots is the result of higher densities emerging after herbicide application and not of any effect of tillage on weed growth and is likely a result of the higher seedbanks in no-till, as mentioned earlier.
Weed Composition
Analyses by weed type (annual grass, annual broadleaf, or perennial broadleaf) did not reveal any effect of fertilization on density or biomass in the 2016 to 2017 herbicide-treated plots (data not shown); only tillage modified density and biomass. No-till plots generally had higher densities and biomass of all weed types: annual grasses, annual broadleaf weeds, and perennial broadleaf weeds (Figure 2). However, the greatest differences were observed in annual grass densities before postemergence herbicide application, followed by densities at harvest (Figure 2). Total weed densities and biomass were mostly composed of annual grasses, both in tilled and no-till plots, in 2016 to 2017 (Figure 2). In the 2022 unmanaged plots, densities of annual grasses at harvest were not higher in no-till, nor did they compose most of the density and biomass in this soil conservation treatment (Figure 2). This discrepancy could be related to the higher biomass of common ragweed in unweeded plots (Figure 3), which reduced the subsequent emergence of grasses and/or the efficacy of herbicides at controlling the other, early-emerging species in herbicide-treated plots. Four species accounted for about 95% of the total biomass in tilled plots in 2016 to 2017 (large crabgrass, yellow foxtail, bird vetch, and field horsetail), while this percentage was divided between seven species in no-till (yellow foxtail, large crabgrass, common ragweed, broadleaf plantain, rhombic copperleaf, shepherd’s-purse [Capsella bursa-pastoris (L.) Medik.], and field horsetail). In the 2022 weedy plots, 4 species accounted for about 93% of the total biomass in tilled plots (large crabgrass, barnyardgrass, common ragweed, and field horsetail), while this percentage was divided between 10 species in no-till (common ragweed, large crabgrass, field horsetail, yellow foxtail, perennial sowthistle [Sonchus arvensis L.], witchgrass [Panicum capillare L.], horseweed [Conyza canadensis (L.) Cronquist], dandelion, common lambsquarters, and rhombic copperleaf) (Figure 3). Therefore the biomass of both managed and weedy no-till plots was divided between more species, indicating a higher variability of potential competition with the crop. As mentioned earlier, the extensive use of nonresidual herbicides and long-season crops potentially selected for late-emerging grass species in both tilled and no-till plots. For example, green foxtail [Setaria viridis (L.) Beauv.] densities of 10 and 6 plants m−2 can be observed after glyphosate applications at the 4-leaf and 6-leaf stages of corn, respectively (Soltani et al. Reference Soltani, Nurse, Page, Everman, Sprague and Sikkema2013). The most prevalent annual broadleaf species under both tillage regimes, based on frequency and biomass, was common ragweed. This species does not have a particularly extensive emergence period, but some plants can emerge after the application of an herbicide that does not have a residual activity and produce seeds in long-season crops, such as corn and soybean (Simard and Benoit Reference Simard and Benoit2012). Field horsetail, also very present in all plots, is difficult to control with most herbicides (including glyphosate) or tillage, as new stems can arise from fragmented rhizomes and the root system extends below tillage implements (Cody and Wagner Reference Cody and Wagner1981; Légère and Samson Reference Légère and Samson2004). In no-till, species that are controlled by tillage, such as dandelion and horseweed, are present (Brown and Whitwell Reference Brown and Whitwell1988; Froese et al. Reference Froese, Van Acker and Friesen2005).

Figure 2. Average density and biomass of monocotyledonous annual grasses (AG), dicotyledonous annual broadleaf weeds (AB), and dicotyledonous perennial broadleaf weeds (PB) in a corn–soybean rotation under moldboard-plowed or conservation tillage regimes since 1992. Weed density in herbicide-treated plots before, after, and at crop harvest (2016/corn–2017/soybean) and in unmanaged plots (no postemergence herbicide, 2022/corn) (A). Weed biomass at crop harvest in herbicide-treated plots (2016/corn–2017/soybean) and in unmanaged plots (no postemergence herbicide, 2022/corn) (B). Vertical bars represent standard errors. Asterisks indicate the significance of the tillage regime effect at *P = 0.05, **P = 0.01, and ***P = 0.001.
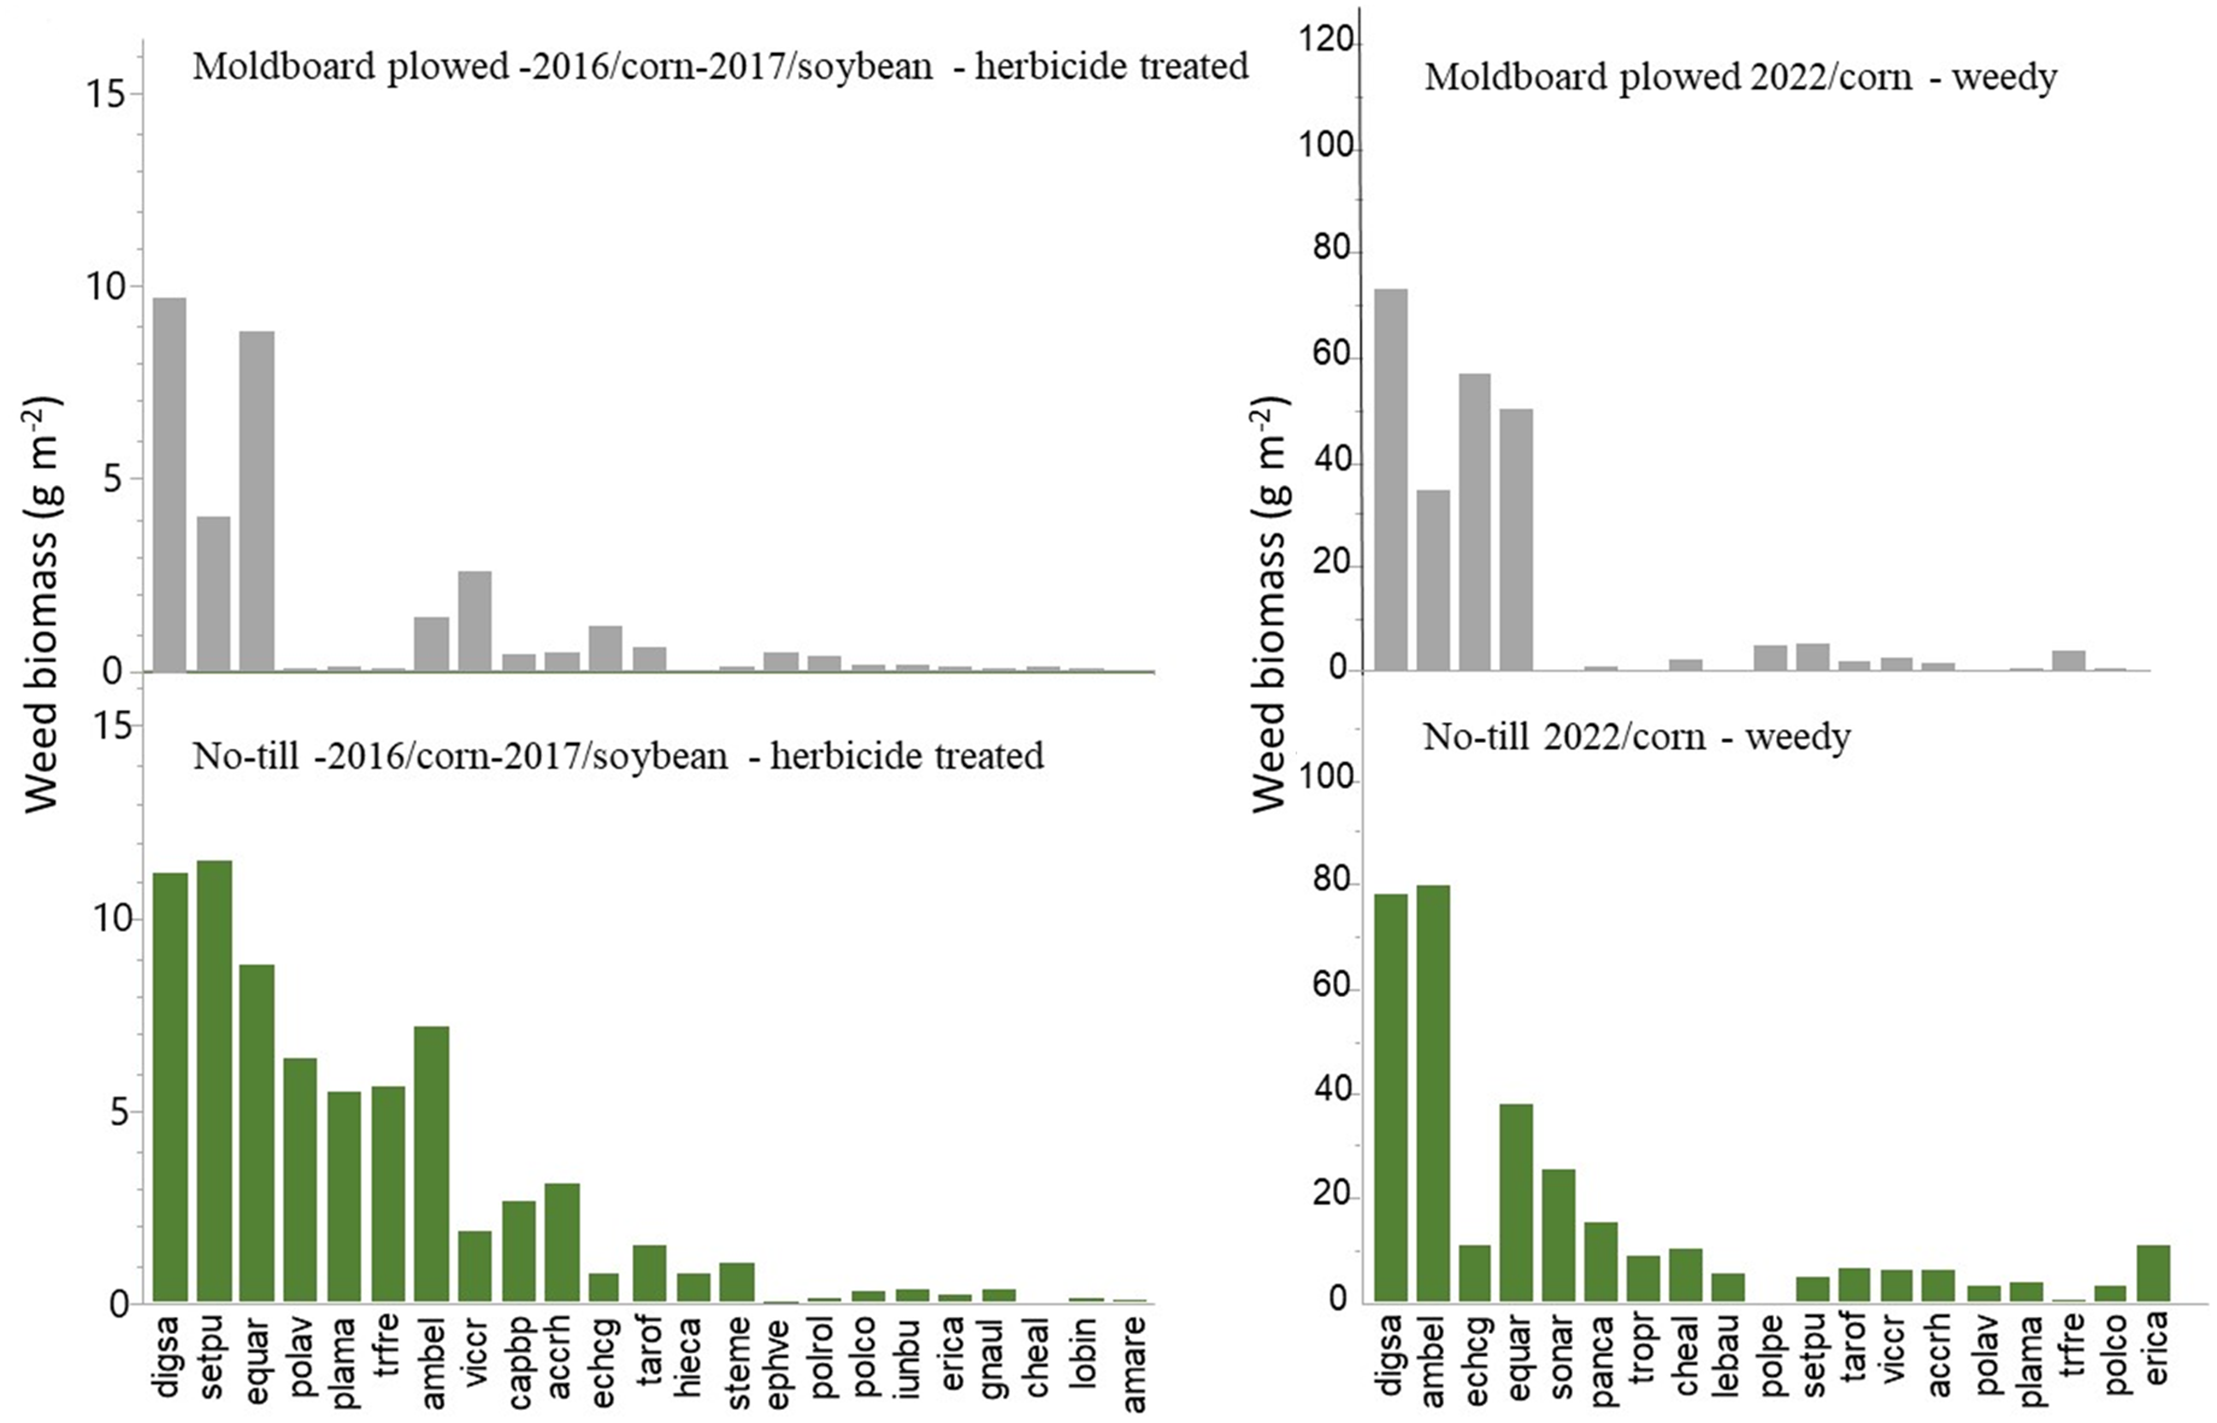
Figure 3. Average biomass of weed species at crop harvest in moldboard-plowed (top) and no-till (bottom) plots in herbicide-treated (2016/corn–2017/soybean) plots (left) and unmanaged (no postemergence herbicide, 2022/corn) plots (right). See Table 2 for scientific names and corresponding codes. Weeds are ranked from greatest to lowest biomass based on general averages.
Bartlett’s test of sphericity and the KMO were verified and indicated that the data were suited for factorial analysis. The scree plot analyses showed that the distribution of the species’ frequency (pattern) can be parsimoniously represented using only four spatial PCs and cumulatively explained 44.9% of the total variance (PC1:16.6%, PC2:10.2%, PC3:9.3%, PC4:8.8%). Species that were grouped together and had the highest values in the loading matrix with respect to PC1 include large crabgrass, yellow foxtail, common lambsquarters, and common ragweed. Frequencies of rhombic copperleaf, dandelion, and field horsetail showed the highest contribution to PC2. Shepherd’s-purse and bird vetch were strongly related to PC3, barnyardgrass and broadleaf plantain to PC4. From the biplot PC1 versus PC2, large crabgrass had higher magnitude compared to common ragweed and hence was better represented compared to common ragweed. No PCA was related to the fertilization treatments; therefore no groups of species were associated with added mineral nitrogen or phosphorus. The species composition of moldboard-plowed plots does not clearly separate from that of the no-till plots, except for a stronger frequency of large crabgrass and yellow foxtail as well as dandelion, rhombic copperleaf, and common ragweed in no-till (Figure 4). In 2004 to 2005, common lambsquarters and barnyardgrass were more dominant and more associated with no-till (Légère et al. Reference Légère, Stevenson and Ziadi2008).

Figure 4. Ordination biplot for the two principal components describing the relationship between weed species present in at least 15% of the plots and fertilization (nitrogen [N] and phosphorus [P] rates) (left) or tillage regime (moldboard plowed and no-till) (right). See methods for fertilization treatments and Table 2 for scientific names and corresponding codes. Some markers and colors do not appear because of overlap.
In 2016 to 2017, excluding winter annuals and perennials, 58.3% of species present in a quadrat had at least one seed-bearing plant at crop harvest, irrespective of tillage. The prevalence of seed-bearing plants at harvest in corn and soybean is not uncommon (Forcella et al. Reference Forcella, Peterson and Barbour1996; Schwartz-Lazaro et al. Reference Schwartz-Lazaro, Shergill, Evans, Bagavathiannan, Beam, Bish, Bond, Bradley, Curran, Davis, Everman, Flessner, Haring, Jordan, Korres, Lindquist, Norsworthy, Sanders, Steckel, Van Gessel, Young and Mirsky2021a, Reference Schwartz-Lazaro, Shergill, Evans, Bagavathiannan, Beam, Bish, Bond, Bradley, Curran, Davis, Everman, Flessner, Haring, Jordan, Korres, Lindquist, Norsworthy, Sanders, Steckel, Van Gessel, Young and Mirsky2021b; Simard et al. Reference Simard, Panneton, Longchamps, Lemieux, Légère and Leroux2009) and suggests that seedbanks and weed densities are likely to increase in simple corn–soybean rotations unless herbicides with high residual activity are used (Schweizer and Zimdahl Reference Schweizer and Zimdahl1984). Common ragweed, a weed prevalent in both tilled and no-till plots in this study, emerging after a nonresidual postemergence application in soybean can produce as much seed as weeds left uncontrolled if crop competition is low (Simard and Benoit Reference Simard and Benoit2010), and over 50% of these seeds will have dispersed before harvest in corn and soybean in eastern Canada (Simard et al. Reference Simard, Nurse, Page and Bourgeois2020).
Although some studies did not observe differences between tillage regimes (Derksen et al. Reference Derksen, Lafond, Thomas, Loeppky and Swanton1993), many report higher annual grass populations in no-till. Higher large crabgrass seedbanks and emergence in no-till compared to rototilled plots or moldboard plowing were observed in sweet corn and attributed to lower seed mortality (Mohler and Calloway Reference Mohler and Calloway1992, Reference Mohler and Calloway1995; Teasdale et al. Reference Teasdale, Beste and Potts1991). Higher giant foxtail (Setaria faberi Herrm.) densities (>250 m−2) were observed in no-till compared to moldboard tillage in soybean and attributed to lower herbicidal efficacy (Buhler and Oplinger Reference Buhler and Oplinger1990). Higher large crabgrass seed persistence was observed in undisturbed soil under strip tillage compared to moldboard-plowed soil and was related to light exposure followed by fatal germination during spring tillage (Frost et al. Reference Frost, Haramoto, Renner and Brainard2019).
We hypothesize that large crabgrass and yellow foxtail populations increased under both tillage regimes because of the reduced use of residual herbicides that could have limited late-emerging plants from producing seed in corn and soybean. Greater seed mortality by tillage lowered this increase in conventional tillage. Large crabgrass germination is highest under light, and recruitment can be lowered by 63% at 7.5 cm (Peters and Dunn Reference Peters and Dunn1971) to 100% at 8 cm (Benvenuti et al. Reference Benvenuti, Macchia and Miele2001). Yellow foxtail germination is not enhanced by light, but recruitment can be lowered by shallow burial (<14 cm) (Dekker Reference Dekker2003). Although burial induces weed seed dormancy and persistence (Benvenuti et al. Reference Benvenuti, Macchia and Miele2001), which are released when the seeds are returned to the surface by the following tillage, large crabgrass and yellow foxtail seeds that do not reach the surface are likely to die within 3 yr (Masin et al. Reference Masin, Zuin, Otto and Zanin2006). As densities increase over time, they can lead to lower herbicidal efficacy (Kramer and Legleiter Reference Kramer and Legleiter2022; Winkle et al. Reference Winkle, Leavitt and Burnside1981), generating positive feedback for weed populations.
In herbicide-treated plots in 2016 to 2017, species richness was not modified by fertilization (f = 0.1803, P = 0.672) or tillage (f = 1.0385, P = 0.3105), averaging 5.9 (Table 3). Weed diversity (Hʹ) based on counts was not modified by fertilization (f = 1.2798, P = 0.2786) or tillage (f = 1.6743, P = 0.2013), averaging 1.69 (Table 3). Weed diversity (Hʹ) based on biomass was not modified by fertilization (f = 1.0196, P = 0.4327) but was modified by tillage (f = 7.8929, P = 0.0069) (Table 3). Evenness (E) based on counts was not modified by fertilization (P = 0.81) but was higher in moldboard-plowed plots (f = 18.58, P < 0.001) (Table 3). Evenness (E) based on biomass was not modified by fertilization (P = 0.4413) or tillage (P = 0.1468) (Table 3). In the unmanaged 2022 plots, no effect of fertilization or tillage was observed on any of these indexes (P > 0.05). Average richness in these plots was 9 (Table 3). Values were nonetheless higher in no-till (10.37 vs. 7.88). Diversity based on counts averaged 1.71 and evenness averaged 0.37 in 2022. Diversity and evenness based on biomass were similar to those based on counts, averaging 1.62 and 0.33, respectively (Table 3). Hʹ values higher than 1.5 indicate agricultural cropping systems with high diversity (Clements et al. Reference Clements, Weise and Swanton1994). In 2004 to 2005, species richness (0.3 to 3) and weed diversity based on counts (0.16 to 0.85) were much lower and higher, respectively, in no-till in 2004/corn and in intermediate nitrogen-fertilized plots in 2005/soybean, while evenness values were similar, averaging 0.36 (Légère et al. Reference Légère, Stevenson and Ziadi2008). Our weed richness and diversity values indicate that these increased over time, except evenness, but we did not observe any effect of fertilization.
Table 3. Average weed species richness, diversity, and evenness values in herbicide-treated plots (2016/corn–2017/soybean) and in plots where weeds were left to grow all season after crop planting (2022/corn).a

a Diversity (Hʹ) and evenness (E) values are presented based on count and biomass and are separated by factor (tillage regime) when significant. Standard errors are in parentheses.
Higher diversity in no-till was only observed based on biomass in herbicide-treated plots. In row crops, weed diversity is not modulated by added nutrients (McCloskey et al. Reference McCloskey, Firbank, Watkinson and Webb1996; Stevenson et al. Reference Stevenson, Légère, Simard, Angers, Pageau and Lafond1997) but is generally higher in no-till (Nichols et al. Reference Nichols, Verhulst, Cox and Govaerts2015). Because our general diversity was high, perhaps maximum values were reached for this rotation, limiting the impact of tillage. However, as indicated earlier (Figure 3), the composition of biomass was more diverse in no-till. Biomass is generally more representative of weed competition than counts alone. We can only suppose that the relatively constant evenness in time is related to the constant redistribution of weed seeds by tractor wheels and that higher evenness in plowed fields would be related to the added redistribution of seeds by tillage.
Crop Yield
Fertilization
Corn yields were affected by fertilization in herbicide-treated (2016: f = 38.45, P < 0.001; 2022: f = 22.45, P < 0.001), weed-free (2022 + manual weeding) (chi-square = 9.93, P = 0.0016), and weedy plots (2022) (chi-square = 11.29, P < 0.001), being 1.7 to 5.7 t ha−1 (weedy) higher in fertilized plots (Figure 5, left vs. right). It is well known that corn responds positively to nitrogen fertilization, as reported in many studies in this area, including those conducted in the same experimental site (Ziadi et al. Reference Ziadi, Angers, Gagnon, Lalande, Morel, Rochette and Chantigny2014). Further analyses of the 2016 data indicate that the fertilization effect on corn yield is due to the higher nitrate rates, while phosphorus rates had no effect on corn yield (data not presented), as observed by Légère et al. (Reference Légère, Stevenson and Ziadi2008) and Ziadi et al. (Reference Ziadi, Angers, Gagnon, Lalande, Morel, Rochette and Chantigny2014) in the same plots. In a recent study, Gagnon et al. (Reference Gagnon, Ravelojaona, Luce and Ziadi2022) also reported a significant and consistent effect of nitrogen fertilization on corn yield over a 26-yr corn–soybean rotation, whereas the effect of phosphorus fertilization was inconsistent. The lowest corn yields were observed in unfertilized weedy plots, and adding fertilization increased yields to levels close to those observed in plots where weeds were controlled (Figure 5), implying competition for nutrients by weeds. Soybean yields were not affected by the residual effect of the fertilization applied during the corn phase (P = 0.4057 and P = 0.9124 for nitrogen and phosphorus, respectively), as previously observed (Légère et al. Reference Légère, Stevenson and Ziadi2008; Ziadi et al. Reference Ziadi, Angers, Gagnon, Lalande, Morel, Rochette and Chantigny2014).

Figure 5. Average crop yield in moldboard-plowed and no-till plots. Corn yield values in unfertilized and fertilized (160 kg N + 80 kg P2O5 ha−1) herbicide-treated plots (2016) (top). Soybean yield in unfertilized plots (all plots) (2017) (middle). Yield values in unfertilized and fertilized (160 kg N + 80 kg P2O5 ha-1) corn plots (2022), either herbicide treated, herbicide treated and hand weeded, or unmanaged (no postemergence herbicide) weedy plots (bottom). Vertical bars represent standard errors. Asterisks indicate significance of tillage regime effect at **P = 0.01.
Tillage
Corn yields were not significantly affected by tillage in the herbicide-treated 2016 or 2022 plots (f = 0.3728, P = 0.5434; chi-square = 0.71, P = 0.4003) (Figure 5), probably because of the efficient weed management by the herbicides applied, suggested by the low densities observed after herbicide application in both tillage regimes in 2016 (Figures 1 and 2) and the absence of higher yields where hand weeding was supplemented in 2022 (Figure 5). Analyses that included 9 yr indicate that corn yields were equal (4/9 yr) or lower (5/9 yr) in no-till (Ziadi et al. Reference Ziadi, Angers, Gagnon, Lalande, Morel, Rochette and Chantigny2014). Average yield values in no-till in this subset when herbicide management was intensive were never higher in no-till (Figure 5). Corn yields were not significantly affected by tillage in the 2022 weedy plots (chi-square = 0.1765, P = 0.6744) (Figure 5), suggesting that when left unmanaged after planting, weed competition was as high in both moldboard-plowed and no-till plots. Soybean yield (2017) was 13.3% lower in no-till plots (f = 10.17, P = 0.0021) (Figure 5), and weed densities were significantly higher after herbicide application in these plots, especially grasses, followed by perennial broadleaf weeds (Figures 1 and 2), despite the repetitive application of glyphosate. When weed densities reach high values (>300 m−2) (Figures 1 and 2), herbicide applications can be less efficient (Kramer and Legleiter Reference Kramer and Legleiter2022; Winkle et al. Reference Winkle, Leavitt and Burnside1981). Although crop residues present in no-till might lower the efficacy of soil-applied herbicides (Buhler Reference Buhler1992), the higher numbers in glyphosate-treated soybean suggest less herbicide interception at high density. Ziadi et al. (Reference Ziadi, Angers, Gagnon, Lalande, Morel, Rochette and Chantigny2014) observed equal (3/9 yr) or lower (6/9 yr) soybean yields in no-till. Weed densities and biomass were not correlated with corn yield but were generally correlated with soybean yield (Table 4). Yield discrepancies between tillage regimes also coincide with a significant difference between weed densities after herbicide application (2017). Therefore lower yields are most likely generated by higher weed competition in no-till as opposed to other potential effects on soil conditions (Buhler Reference Buhler1992). This higher competition would still be profitable given the cost associated with tillage (Ziadi et al. Reference Ziadi, Angers, Gagnon, Lalande, Morel, Rochette and Chantigny2014).
Table 4. Pearson’s correlation coefficients between crop yields and log-transformed weed density or biomass in herbicide-treated corn/2016 and soybean/2017. a

a Correlation significant at **P > 0.01 or ***P > 0.001.
In conclusion, adding nitrogen or phosphorus did not alter the weed density, biomass, composition, or diversity of managed weed communities present in this long-term corn–soybean rotation. Fertilization modified only the weed biomass of unmanaged weeds. Tillage had limited effects on most of these variables, except weed density. The density of the annual species that increased in prevalence during this long-term trial, especially annual grasses, was higher in no-till compared to moldboard-plowed plots. No-till was also associated with species that could be easily managed by moldboard tillage. The limited effect of tillage on crop yields (−13.3%, 1/3 yr) was related to the presence of higher weed densities and concurrent weed biomass in no-till.
Practical Implications
Weed communities were evaluated after decades of tillage and mineral fertilization treatments in a corn–soybean rotation. Weeds increased in density, biomass, and diversity over time in this rotation, where annual grasses are now ubiquitous. This increase is potentially related to the rotation of the same long-season crops and the low use of residual herbicides. Managed weed communities were never altered by added nitrogen or phosphorus mineral fertilizer. Both unmanaged weeds and corn benefited from added fertilizer. Moldboard-tilled plots had lower densities of dominant annual and perennial weeds. Additional management efforts could be required to lower the high spring density of annual grasses over time, especially in no-till. These could include a diversified rotation, added cover crops, or occasional tillage.
Acknowledgments
This project was funded by Agriculture and Agri-Food Canada. We thank the staff and students at the Saint-Jean-sur-Richelieu and Quebec Research Centres and at the L’Acadie Experimental Farm, especially Manon Bélanger, Sylvain Fortin, Lydia Maheux, Florence Lemaire, and Guy Hébert. We also thank Aline Philibert for her invaluable statistical support. The authors declare no conflicts of interest.


 Open access