


Neuroanatomical, neuroimaging and behavioural reports of cerebellar involvement in cognitive and language functions increasingly implicate the cerebellum as the site of morphological changes occurring in schizophrenia and other psychiatric diseases (Reference Heath, Franklin and ShrabergHeath et al, 1979; Reference Weinberger, Kleinman and LuchinsWeinberger et al, 1980; Reference Courchesne, Townsend and AkshoomoffCourchesne et al, 1994). It has been suggested that classic cerebellar signs such as lack of coordination, limb movement abnormalities and dyscoordination, often reported in psychiatric diseases, could be caused by structural abnormality in the cerebellum. Autonomic, limbic and also higher cortical functions have been recognised as being modulated by the cerebellum (Reference Hamilton, Frick and TakahashiHamilton et al, 1983; Reference SchmahmannSchmahmann, 1991; Reference Leiner, Leiner and DowLeiner et al, 1993; Reference Katsetos, Hyde and HermanKatsetos et al, 1997).
The aim of this study was to apply recent stereological methods to cerebella from people with schizophrenia and an age- and gender-matched control group. The methods used were the Cavalieri principle (Reference Gundersen, Bagger and BendtsenGundersen et al, 1988b ) to estimate the major volumes, the optical disector method (Reference GundersenGundersen, 1986) to obtain estimates of the numerical density of granular and Purkinje cells, and a combination of the two to obtain estimates of total cell numbers. The rotator method (Reference Jensen and GundersenJensen & Gundersen, 1993) was applied to estimate mean Purkinje cell volume.
METHOD
Cerebella from ten men with chronic schizophrenia but no neurological disorder (mean age at death 57.5 years) and ten male controls (mean age at death 56.2 years) were obtained post-mortem in accordance with the Danish law regarding autopsied human tissue. The brains were included in the study if fixed within 12-60 h post-mortem. Exclusion criteria were presence of tumours or infection in the central nervous system, strokes, or any history of alcohol or drug misuse. After processing, embedding and staining, two brains were excluded owing to presence of cell necrosis, a well-known post-mortem phenomenon (Reference Ikuta, Hirano and ZimmermanIkuta et al, 1963; Reference AlbrechtsenAlbrechtsen, 1977), leaving eight brains from the schizophrenia group and ten from the control group for further processing. To avoid the influence of gender differences, only male brains were included. Most of the control brains were from people who had died from sudden heart failure. Information about their life before admission to hospital was obtained from either close relatives or their general practitioner, thus enabling any patient with central nervous system symptoms to be excluded.
In the schizophrenia group the brain samples were taken from people with a DSM—III diagnosis of schizophrenia (American Psychiatric Association, 1980) who were in-patients at a psychiatric hospital in Denmark. All of these patients had been treated with neuroleptic drugs for a period of 3-30 years. The clinical data on both study groups are shown in Tables 1 and 2. The numbers of insulin comas and applications of electroconvulsive therapy (ECT) are given in Table 1, and post-mortem interval, fixation time and agonal state are presented in Table 2.
Table 1 Treatment history of the eight patients in the schizophrenia group

| Age (years) | Age at first admittance to psychiatric hospital (years) | Length of stay in psychiatric hospital (years) | Schizophrenia subtype | Duration of treatment with neuroleptic drugs (years) | Insulin comas (n) | ECT treatments (n) |
|---|---|---|---|---|---|---|
| 30 | 26 | 1 | Simplex | 3 | 0 | 0 |
| 41 | 22 | 17 | Hebephrenic | 19 | 0 | 6 |
| 45 | 20 | 23 | Paranoid | 23 | 28 | 40 |
| 52 | 16 | 22 | Simplex | 25 | 38 | 22 |
| 65 | 25 | 36 | Simplex | 30 | 0 | 0 |
| 70 | 20 | 37 | Paranoid | 26 | 0 | 16 |
| 78 | 22 | 56 | Simplex | 18 | 0 | 0 |
| 79 | 41 | 34 | Paranoid | 24 | 28 | 21 |
Table 2 Age, body height and weight, brain and cerebellum weight, cause of death, post-mortem delay in fixation, length of fixation and time from onset of terminal disease to death: comparison between schizophrenia group (n=8) and control group (n=10)

| Age (years) | Body height (cm) | Body weight (kg) | Brain weight (g) | Cerebellum weight (g) | Cause of death | Death—fixation delay (h) | Length of fixation (months) | Time from terminal disease onset to death |
|---|---|---|---|---|---|---|---|---|
| Schizophrenia group (n=8) | ||||||||
| 30 | 178 | 70 | 1420 | 132.0 | Suicide | 50 | 123 | Minutes |
| 41 | 184 | 70 | 1485 | 136.7 | Chronic pancreatitis | 48 | 171 | Months |
| 45 | 175 | 58 | 1330 | 130.1 | Cancer (colon) | 48 | 167 | Months |
| 52 | 186 | 56 | 1427 | 149.2 | AMI | 24 | 104 | Days |
| 65 | 185 | 73 | 1268 | 125.8 | Cancer (lung) | 48 | 228 | Months |
| 70 | 175 | 70 | 1450 | 148.5 | AMI | 27 | 109 | Minutes |
| 78 | 166 | 72 | 1325 | 133.0 | AMI | 27 | 209 | Days |
| 79 | 178 | 73 | 1142 | 106.0 | Cancer (liver) | 24 | 214 | Months |
| Mean (CV) values for group | ||||||||
| 57.5 (0.32) | 178.4 (0.04) | 67.8 (0.1) | 1356 (0.08) | 132.7 (0.1) | 37 (0.27) | 166 (0.3) | ||
| Control group (n=10) | ||||||||
| 28 | 180 | 76 | 1400 | 150.0 | Stab wound | 12 | 39 | Minutes |
| 38 | 180 | 96 | 1390 | 135.3 | AMI | 24 | 63 | Hours |
| 43 | 175 | 82 | 1560 | 154.2 | AMI | 24 | 48 | Hours |
| 44 | 185 | 88 | 1570 | 129.0 | Pulmonary emboli | 24 | 86 | Hours |
| 48 | 186 | 110 | 1290 | 128.7 | AMI | 24 | 48 | Hours |
| 60 | 175 | 73 | 1500 | 135.3 | AMI | 24 | 57 | Hours |
| 65 | 173 | 85 | 1420 | 133.5 | AMI | 24 | 48 | Hours |
| 71 | 175 | 72 | 1360 | 122.0 | Respiratory insufficiency | 15 | 140 | Hours |
| 81 | 176 | 75 | 1390 | 126.0 | Ulcer | 12.5 | 87 | Days |
| 84 | 166 | 56 | 1205 | 108.0 | AMI? | 17 | 48 | Days |
| Mean (CV) values for group | ||||||||
| 56.2 (0.31) | 177.1 (0.03) | 81.3 (0.18) | 1409 (0.08) | 132.2 (0.10) | 20.1 (0.33) | 66 (0.46) | ||
Neuropathology
Tissue blocks were sampled from frontal, parietal, medial, temporal and occipital lobes, the insula, cingulate gyrus and hippocampus, and one or two tiers of mesencephalon. The tissue was processed routinely and embedded in paraffin wax. Sections 4 μm thick were cut from all blocks for haematoxylin and eosin stains, and from selected areas for immunohistochemical investigation. Sections 8 μm thick were cut from all blocks for Kluver—Barrera staining. Immunohistochemical stains were used for beta-amyloid (DAKO M0872; 1:200), tau (DAKO A0024, 1:50 000), ubiquitin (DAKO Z0458, 1:5000) and alphasynuclein (Zymed zs 18-0215, 1:2000) (DAKO, Glostrup, Denmark; Zymed, San Francisco, CA, USA). The brain-stems were normal, including the pigmentation of the substantia nigra. There were no tumour or neuronal or glial inclusions, vasculitis or encephalitis.
Anatomy
The cerebellum consists of a median vermis and two lateral hemispheres (Reference Braitenberg and AtwoodBraitenberg & Atwood, 1958). Five deep fissures divide the cerebellum into lobes and lobules: the primary fissure, the posterior superior fissure, the horizontal fissure, the prepyramidal fissure and the posterolateral fissure. Portions of the cerebellar hemispheres located rostrally to the primary fissure form the anterior lobe, whereas those between the primary and the posterolateral fissures constitute the posterior lobe. The median vermis is divided into an anterior and a posterior part at the level of the primary fissure. The anterior vermis is the median part of the anterior lobe, and is often delineated by the indentation produced by the course of the medial branch of the superior cerebellar artery. The most caudal part, the flocculonodular lobe, is separated from the posterior lobe by the posterolateral fissure.
The motor representation in the human cerebellum is:
-
(a) the archicerebellum, the oldest zone, corresponding to the flocculonodular lobe and related to the vestibular system;
-
(b) the palaeocerebellum, referring primarily to the anterior lobe; this zone is functionally related to the spinal cord and is concerned with posture, muscle tone and gait;
-
(c) the neocerebellum, the evolutionarily most recent part, corresponding to the posterior lobe; this zone is functionally related to the cortico-ponto-cerebellar system, which exerts a regulating effect on discrete movements of the limbs and truncal movements.
The cortex is made up of three layers: the outer molecular layer, the middle Purkinje single cell layer, and the inner granular layer. The Purkinje cells have a large, clear nucleus with a deeply stained nucleolus and irregular Nissl granules. The granular layer is mainly composed of closely packed granule cells, in which the nuclei form the major constituent of the cell body. The sole output cell from the cerebellar cortex is the Purkinje cell that projects to the central cerebellar nuclei, which in turn provide efferents from the cerebellum.
Experimental procedure
For all stereological estimations to be based on unbiased principles, the procedures require isotropic, uniform random (IUR) sections, the only exceptions being estimations of volume and total cell numbers. Most biological structures are anisotropic, and to compensate for this the vertical section principle was applied (Reference Baddeley, Gundersen and Cruz-OriveBaddeley et al, 1986). A vertical section is a plane section perpendicular to a given horizontal plane. The horizontal plane can be defined either by the tissue itself or generated artificially; it refers only to the orientation of the section. All sections must be cut perpendicular to the horizontal plane. The vertical direction must be known in all sections and the vertical sections must have a random position and orientation in two dimensions for the design to be unbiased. In practice, a cerebellum was dissected from the brain-stem at the level of the vestibulocochlear nerve and the surface was stained with waterproof ink in different colours to distinguish between the anterior and posterior hemisphere, the anterior and posterior part of the vermis, and the flocculonodular lobe. After removing the flocculonodular lobe, the cerebellum was embedded in 7% agar, and cut in a systematically random manner into slabs approximately 4 mm thick, using a cutting machine with a 4 mm interval. Each slab was used to estimate the volume of the different regions (see below). Starting randomly with either the first or the second slab, every second slab was cut systematically into 4 mm wide columns or rods and every nth rod was sampled to provide approximately five to eight rods from each of the five regions. The regions from which the rods were taken were identified by their coloured surfaces. Larger areas of white matter were removed and the rods rotated around their longitudinal axes and embedded in agar. The number of rods was decided on the basis of a pilot study (see Reference Andersen, Korbo and PakkenbergAndersen et al, 1992). The flocculonodular lobe, consisting of three parts, was rotated clockwise, the first part randomly, the other two parts rotated 90° and 180° to the first, respectively. All were embedded in 7% agar and cut into 2 mm slabs. For more details regarding the vertical axis principle, see Baddeley et al (Reference Baddeley, Gundersen and Cruz-Orive1986), and for further practical details of the stereological design, see Andersen et al (Reference Andersen, Korbo and Pakkenberg1992). The sampled rods were dehydrated and embedded in glycolmethacrylate for sectioning. From each three-dimensional uniformly random block, a central section 40 μm thick was cut parallel to the vertical axis and stained with a modified Giemsa stain. On the basis of the results of a pilot study, the Giemsa stain was preferred because it gave a better contrast between cells than the Weil stain used in our earlier study.
Estimation of total volumes
Estimates of total cell number, N, were obtained by combining an estimate of the respective reference volumes, V (ref.), using the Cavalieri method (Gundersen et al, Reference Gundersen, Bendtsen and Korbo1988a , Reference Gundersen, Bagger and Bendtsen b ), and a separately obtained estimate of the three-dimensional numerical density, NV , for each cell type. The macroscopic volumes were estimated from:
where t is the average thickness of the cerebellar slabs (in this study, 4.1 mm), a(p) is the area associated with each point of the test grid (4 mm2 for anterior lobe, anterior and posterior vermis, 81 mm2 in posterior lobe) and ΣP is the total number of points hitting the region of interest. The mean number of slabs in the anterior vermis, posterior vermis and the anterior lobe was 5 (range 4-7), and the mean number of slabs in the posterior lobe was 11 (range 9-13). The flocculonodular lobe was sampled in 2 mm slabs, and the mean number was 15 (range 14-18). The mean number of points hitting the regions was 80 in the anterior lobe and 50 in the anterior vermis, 80 in the posterior vermis and 250 in the large posterior lobe. The mean number of points in the flocculonodular lobe was 130.
To estimate the volume of the granular and molecular layer and the white matter, the same sections as described below in ‘Surface estimation’ were used. Using point counting on the projected images with a(p)=4 cm2 at a magnification of × 15, a(p)=1.78 mm2 at tissue level, a simple test grid was applied to the sections to generate the individual volume fractions (Vv ), where
which provides
The volume of the flocculonodular lobe was estimated using a test grid with a(p)=4 mm2 and t=2.0 mm.
Surface estimation
Using the vertical section design on cerebellum (Reference Baddeley, Gundersen and Cruz-OriveBaddeley et al, 1986; Reference Andersen, Korbo and PakkenbergAndersen et al, 1992), the sampled rods were rotated randomly about their vertical axes. The rods were then embedded in agar, sectioned longitudinally and stained. On each section, the vertical axis was identifiable as the long axis of the rod. The surface area was estimated using a cycloid test system and a projecting microscope with a final magnification of × 15 (for details, see Reference Andersen, Korbo and PakkenbergAndersen et al, 1992). The surface (S) was estimated from the following equation:
where 2 is a constant valid for IUR test-lines, ΣP is the total number of points hitting the cerebellar tissue, l(p) is the test line length per point, and ΣI is the total number of intersections between the cycloid test lines and the cerebellar surface.
Layer thickness
The thickness of the granular layer was estimated using the equation
where the pial surface area was used in both the molecular and the granular layers. The thickness was slightly underestimated because the granular layer is not situated directly under the pial surface.
Estimation of total cell number
The estimate of total cell number in a region as defined by the equation below is the product of the volume of each specific layer and the numerical density of a particular cell type in that layer:
The Purkinje cells have a large, clear nucleus with one deeply stained nucleolus and irregular Nissl granules. Since a previous study showed that only 1% of the Purkinje cells have more than one nucleolus (Reference Andersen, Korbo and PakkenbergAndersen et al, 1992), the nucleolus was used as the counting item. The granular layer is mainly composed of closely packed granule cells in which the nuclei form the major constituent of the cell body. In order to estimate numerical density of the two cell types the optical disector was applied. The optical disector equipment consists of a microscope with a high numerical aperture (1.40) and oil immersion (× 60 or × 100) objectives, which allow focusing on a thin focal plane inside a thick section. A video camera transmits the image to a screen where a counting frame is superimposed using the CAST-GRID PC program (Olympus, Denmark). The microscope stage is driven by a pair of stepping motors with preset steps of known length in the x- and y-directions. A microcator is used to measure stage movements in the z-axis.
A total of 20-30 rods, sampled from the five parts of cerebellum, were used to estimate the numbers of granule and Purkinje cells. For granule cell estimation the × 100 objective was used and the disector height was 10 μ m; Purkinje cells were estimated with a × 60 objective and a disector height of 20 μm; the counting frames were 60 μm2 and 25 000 μm2, respectively. One observer performed the counting on coded sections. The interrater reliability had been tested in a pilot study and was below 5%.
Many counting fields contained no Purkinje cell. Therefore, in order to sample at least 50-60 cells, 150-300 disectors had to be sampled at the lowest possible magnification at which the nucleoli were distinguishable. The granular layer was used as a reference volume, which was obtained by using the upper right-hand corner of the counting frame as a reference point. The sampling scheme provided a coefficient of error (CE=s.e.m./mean) of 0.059 for global Purkinje cell estimation in the schizophrenia cerebellar samples and 0.065 for the control samples.
Owing to the uniformity of the granular layer, 100-200 cells counted in about 75-150 disectors in each region were sufficient to give an estimate of global granule cell count with a coefficient of error of 0.047 in the schizophrenia samples and 0.043 in the controls.
Mean volume of Purkinje cells
Each sampled Purkinje cell was measured with a semi-automatic procedure using the menu-driven computer program, the rotator method (Reference Jensen and GundersenJensen & Gundersen, 1993), in which the volume of an arbitrary object can be estimated by rotating it about an arbitrary axis through a unique point in the object. The vertical axis is aligned parallel to the y-axis on the screen. Using the nucleolus as the unique point, the vertical axis is shown on the monitor by the interactive software. The top and bottom boundary points of the cell or nucleus are indicated by the operator, and the program systematically creates uniformly random test lines perpendicular to the vertical axis. Intersections between the lines and the boundaries are indicated by the operator and the volume is given in cubic micrometres. The volume of the perikaryon and cell nucleus was estimated for each sampled Purkinje cell. A mean of 345 Purkinje cells were counted and their volume estimated for each cerebellum.
Statistics
Differences between groups were judged by a two-tailed Student's unpaired t-test employing a significance level of 0.05. The inter-individual variation, the coefficient of variation (CV=standard deviation/mean), is shown in parentheses following the group mean values.
The precision of individual estimates is indicated by the coefficient of error, which was 0.02-0.12 in all macroscopic volume estimations. The coefficient of error for estimates of total number of Purkinje cells globally in both schizophrenia and control samples was 0.04-0.06, but was larger in sub-regions, where it varied from 0.16 to 0.25 for Purkinje cells and from 0.03 to 0.17 for the granule cells. The larger values were due partly to the sampling design, but also to the heterogeneous distribution of the cells.
The volume estimates of Purkinje cells were right-skewed and consequently analysed after logarithmic transformation. Mean values were reported as geometric means:
The inter-individual variation in groups is reported as the coefficient of variation after group mean values.
RESULTS
The mean total number of Purkinje cells was the same in the two groups (31.5 × 10⁶, CV=0.13 in the schizophrenia samples v. 28.5 × 10⁶, CV=0.19 in the control samples; P=0.20), as was the mean total number of granule cells (108.4 × 10⁹, CV=0.24 in the schizophrenia samples v. 112.3 × 10⁹, CV=0.13 in the control samples, P=0.70). No reduction of total Purkinje cell number was seen in any of the five sub-regions of the cerebellum (Table 3). The mean volume of the cerebellum in the schizophrenia samples (126 cm3, CV=0.9) was not significantly different than in the control group (121 cm3, CV=0.09; P=0.38), and neither was the volume of the total cerebellar cortex, white matter or central grey nuclei (Table 4). No significant difference in macroscopic volume was found in any of the five sub-regions. The most frequently reported findings in schizophrenia are volume and Purkinje cell loss in the anterior vermis. In this region the mean Purkinje cell number in the schizophrenia sample was 1.27 × 10⁶ compared with 1.10 × 10⁶ (P=0.47) in the control group. The 95% confidence interval for the difference of means ranged from 0.31 × 10⁶ more Purkinje cells in the controls to 0.64 × 10⁶ more Purkinje cells in the schizophrenia group. The mean volume in the anterior vermis in the schizophrenia samples was 3.7 cm3 compared with 3.3 cm3 in the controls (P=0.32), with a 95% CI for the difference of means ranging from 0.42 cm3 volume enlargement in controls to 1.23 cm3 enlargement in schizophrenia.
Table 3 Total mean numbers of granule and Purkinje cells in the five different regions of the cerebellum: comparison between schizophrenia group (n=8) and control group (n=10)

| Purkinje cells (106) | Granule cells (106) | |||||
|---|---|---|---|---|---|---|
| Control group Mean (CV) | Schizophrenia group Mean (CV) | P | Control group Mean (CV) | Schizophrenia group Mean (CV) | P 1 | |
| Anterior lobe | 3.3 (0.38) | 2.8 (0.19) | 0.30 | 10419 (0.26) | 9432 (0.31) | 0.48 |
| Posterior lobe | 22.5 (0.19) | 25.9 (0.14) | 0.09 | 93061 (0.15) | 89892 (0.24) | 0.72 |
| Anterior vermis | 1.1 (0.40) | 1.3 (0.43) | 0.47 | 3690 (0.27) | 3988 (0.44) | 0.66 |
| Posterior vermis | 1.4 (0.40) | 1.3 (0.31) | 0.77 | 4446 (0.27) | 4475 (0.34) | 0.97 |
| Flocculonodular lobe | 0.3 (0.49) | 0.3 (0.28) | 0.62 | 651 (0.45) | 704 (0.28) | 0.69 |
Table 4 Surface area, volume and thickness of the molecular and granular layer in the cerebellum: comparison between schizophrenia group (n=8) and control group (n=10)

| Schizophrenia group Mean (CV) | Control group Mean (CV) | P 1 | |
|---|---|---|---|
| Pial surface area (cm2) | 910 (0.18) | 914 (0.14) | 0.95 |
| Cerebellar volume (cm3) | 126 (0.09) | 121 (0.09) | 0.38 |
| Central grey nuclei volume (cm3) | 1.9 (0.48) | 2.1 (0.33) | 0.64 |
| Total volumes (cm3) | 91.3 (0.11) | 89.8 (0.09) | 0.73 |
| Anterior lobe | 9.0 (0.20) | 8.7 (0.23) | 0.76 |
| Posterior lobe | 74.0 (0.13) | 73.0 (0.10) | 0.75 |
| Anterior vermis | 3.7 (0.26) | 3.3 (0.20) | 0.32 |
| Posterior vermis | 3.8 (0.25) | 4.1 (0.17) | 0.38 |
| Flocculonodular lobe | 0.7 (0.13) | 0.7 (0.24) | 0.97 |
| White matter | 32.6 (0.21) | 29.2 (0.19) | 0.27 |
| Average thickness of molecular layer (μm) | |||
| Anterior lobe | 600 (0.20) | 610 (0.18) | 0.91 |
| Posterior lobe | 570 (0.12) | 580 (0.10) | 0.77 |
| Anterior vermis | 610 (0.16) | 620 (0.29) | 0.97 |
| Posterior vermis | 580 (0.25) | 670 (0.23) | 0.20 |
| Flocculonodular lobe | 420 (0.18) | 430 (0.35) | 0.83 |
| Average thickness of granular layer (μm) | |||
| Anterior lobe | 422 (0.17) | 420 (0.17) | 0.95 |
| Posterior lobe | 450 (0.19) | 402 (0.16) | 0.20 |
| Anterior vermis | 485 (0.20) | 460 (0.24) | 0.64 |
| Posterior vermis | 497 (0.17) | 488 (0.21) | 0.86 |
| Flocculonodular lobe | 410 (0.32) | 380 (0.32) | 0.59 |
No overall statistically significant difference was found between the global mean perikaryon volume of the Purkinje cells in schizophrenia (12 400 μ m3, CV=0.24) and controls (13 800 μm3, CV=0.22; P=0.34) nor in the volume of the Purkinje cell nucleus in schizophrenia (1220 μm3, CV=0.22) v. controls (1310 μ m3, CV=0.17; P=0.43) (Fig. 1). The mean volumes in the five sub-regions are shown in Table 5. The granular and molecular layer is about 0.4-0.6 mm thick with little variation in the entire cerebellum, except in the flocculonodular lobe, in which it is thinner in both groups (see Table 4).
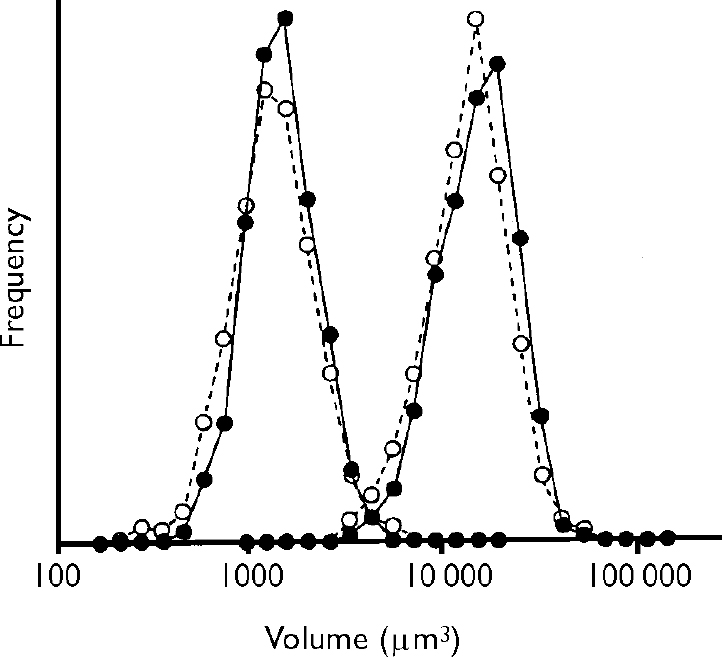
Fig. 1 Average size distribution of Purkinje cell perikarya (right-hand peaks) and nuclei (left-hand peaks) in the control group (•) and in the schizophrenia group (○). All Purkinje cells sampled for number estimation were volume-estimated (a mean of 345 Purkinje cells per cerebellum). Since the Purkinje cell volume turned out to be right-skewed, the volumes are reported on a logarithmic scale. No difference is observed in Purkinje cell volumes in the schizophrenia group (n=8) compared with the control group (n=10).
Table 5 Perikaryon and nucleus volumes in Purkinje cells in the five different regions of the cerebellum: comparison between schizophrenia group (n=8) and control group (n=10)

| Perikaryon volume (μm3) | Nucleus volume (μm3) | |||||
|---|---|---|---|---|---|---|
| Control group Mean (CV) | Schizophrenia group Mean (CV) | P 1 | Control group Mean (CV) | Schizophrenia group Mean (CV) | P 1 | |
| Anterior lobe | 13 737 (0.27) | 13 335 (0.26) | 0.82 | 1342 (0.21) | 1297 (0.27) | 0.77 |
| Posterior lobe | 13 883 (0.22) | 12 405 (0.25) | 0.33 | 1309 (0.16) | 1209 (0.23) | 0.39 |
| Anterior vermis | 13 900 (0.24) | 11 207 (0.21) | 0.07 | 1292 (0.22) | 1136 (0.23) | 0.25 |
| Posterior vermis | 12 516 (0.24) | 11 480 (0.22) | 0.45 | 1292 (0.24) | 1207 (0.20) | 0.54 |
| Flocculonodular lobe | 12 300 (0.29) | 11 815 (0.27) | 0.69 | 1326 (0.25) | 1290 (0.33) | 0.84 |
No statistically significant correlation was found between the total number of granule cells, the total number of Purkinje cells, or the mean Purkinje cell perikarya and nuclei volumes, and fixation time and medication. However, a statistically significant correlation was found between the post-mortem interval and the total number of granule cells in the schizophrenia group (coefficient of correlation, r=-0.56, P=0.015) but not in the control group. Furthermore, we found a statistically significant correlation between the volume of the Purkinje cell perikarya and the Purkinje cell nuclei, and the cerebellar weight in both groups: schizophrenia group r(perikaryon)=0.80, P=0.018, r(nuclei)=0.78, P=0.02; control group, r(perikaryon)=0.91, P=0.0003, r(nuclei)=0.77, P=0.009. Since the two regression lines did not differ, the analysis is performed on the combined material (Fig. 2).
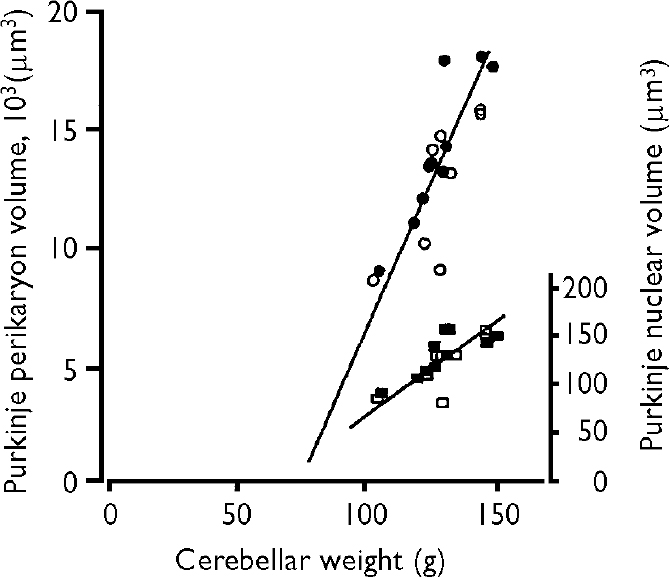
Fig. 2 The correlation between cerebellar weight and the volume of Purkinje cell perikarya in the control group (•) and the schizophrenia group (○) (left-hand vertical axis), and the Purkinje nuclear volume in the control group (▪) and schizophrenia group (□) (right-hand axis). The coefficient of correlation for the combined groups was highly significant, with coefficients of correlation for perikarya cell volumes r(perikarya)=0.82, P<0.001, and r(nuclei)=0.83, P<0.001.
Shrinkage
During the preparation of the rods for histological processing, extra rods were taken to measure shrinkage. The area of the rods was measured before and after histological processing and compared. In accordance with other studies, no net shrinkage was detectable (Reference Pakkenberg, Evans and MøllerPakkenberg et al, 1989; Reference Brændgaard, Evans and HowardBrændgaard et al, 1990). A large variation between the brains was observed; however, no global difference was found between the schizophrenia group and the control group.
DISCUSSION
The most accepted pathological finding in the cerebellum in cases of schizophrenia is vermal atrophy, which was not found in this study. The two sets of brains are not directly comparable since almost all the brains in the control group were taken from men who died from sudden heart failure, whereas in the schizophrenia group deaths were from various causes, including cancer. It is unknown how chronic illness might influence any measurement, but no difference in regional or total volumes, cell numbers or Purkinje cell size was found in the schizophrenia group compared with the controls.
Previous studies of the cerebellum
Computed tomography (CT) studies of patients with schizophrenia have reported a reduction in dorsal vermal volume of 10% or more in patients compared with controls (for review see Reference SniderSnider, 1982). Heath et al (Reference Heath, Franklin and Shraberg1979) reported predominantly vermal ‘atrophy’ in 34 out of 85 patients, and Lippman et al (Reference Lippman, Manshadi and Baldwin1982) found a 17% smaller vermis in patients compared with controls, and one or more abnormal dimensions in cerebella in 16 of 54 cases of schizophrenia. Weinberger et al (Reference Weinberger, Torrey and Wyatt1979), also using CT scans, found an abnormally small cerebellar vermis in 9 out of 60 cases of schizophrenia. In all these studies the estimation was made by visual assessment. Using planimetry in a magnetic resonance imaging (MRI) study, Nasrallah et al (Reference Nasrallah, Schwarzkopf and Olson1991) reported larger cerebellar structures in men with schizophrenia compared with controls, whereas Nopoulos et al (Reference Nopoulos, Ceilley and Gailis1999) — also using MRI, but applying automated methods — showed no group difference in cases of schizophrenia compared with controls.
In a non-uniform morphometric study of the anterior cerebellar vermis, Weinberger et al (Reference Weinberger, Kleinman and Luchins1980) found that the area of the vermis was smaller in 5 out of 12 cerebella from individuals with schizophrenia than in any of the 7 control subjects. Reyes & Gordon (Reference Reyes and Gordon1981) reported the linear density of Purkinje cells to be decreased in the cerebellar vermis in 8 cases of schizophrenia compared with 12 controls. Stevens (Reference Stevens1982), using conventional counting/quantitative methods, reported either gliosis or Purkinje cell loss in a proportion of cerebella from patients with schizophrenia. Tran et al (Reference Tran, Smutzer and Doty1998), measuring the cross-sectional area of Purkinje cells using computer-assisted image analysis, reported reduced Purkinje cell size in the superior vermis in elderly patients with schizophrenia, but did not find any differences in linear density between patients and controls.
Clinical data
Kinney et al (Reference Kinney, Yurgelun-Todd and Woods1999) conducted a clinical study including 54 persons with schizophrenia and 73 of their relatives, 37 persons with bipolar affective disorder, and 24 persons with a history of substance abuse. The people with schizophrenia and their relatives had a higher proportion of cerebellar symptoms, especially balance abnormality, than did the other patients and the control group. Rubin et al (Reference Rubin, Vorstrup and Hemmingsen1994) conducted a study of 44 patients with a first episode of schizophrenia or schizophreniform disorder (mean age 27.5 years), and a control group of 24. All patients had a full neurological examination when first admitted to hospital, and were found to have more neurological abnormalities than the control group, but the only statistically significant abnormality was seen in cerebellar functions. These data could indicate cerebellar involvement in schizophrenia, primarily vermal atrophy.
Cerebellum and cognitive function
Although it is generally recognised that the projection from the cerebellum reaches the motor areas of the frontal lobe (Brodmann areas 4 and 6), it is not as widely recognised that the cerebellar projection also reaches some prefrontal areas (Reference Leiner, Leiner and DowLeiner et al, 1993). Even in the complete absence of any motor activity, the cerebellum is activated when humans perform certain cognitive and language tasks. The inferior lateral part of the cerebellum in particular is markedly activated during both mental counting and mental imagery (Reference Petersen and FiezPetersen & Fiez, 1993; Reference Ryding, Decety and SjöholmRyding et al, 1993). A positron emission tomography study by Andreasen et al (Reference Andreasen, O'Leary and Cizadl1996) points to a dysfunctional prefrontal-thalamocerebellar circuitry in schizophrenia. Patients with cerebellar abnormalities found post-mortem, such as agenesis or hypoplasia of the cerebellum, paraneoplastic degeneration and dentate-rubro-pallido-lusian atrophy, have been described as ‘mentally abnormal’ (for review see Reference Katsetos, Hyde and HermanKatsetos et al, 1997). Several papers have indicated cerebellar involvement in autism (Reference Piven, Nehme and SimonPiven et al, 1992; Reference Courchesne, Townsend and AkshoomoffCourchesne et al, 1994), and atrophy has been described by Courchesne et al (Reference Courchesne, Townsend and Akshoomoff1994), who suggested that cerebellar maldevelopment contributes to the cognitive and social deficits characteristic of this disease. The patients' inability to perform rapid attention shifts between auditory and visual stimuli might be one reason for their social and cognitive problems.
Evaluation of results
The patients in this study all had severe schizophrenia and had a long history of neuroleptic treatment (3-30 years). None of the parameters tested (the total volume of the cerebellum, the total number of granule and Purkinje cells, the mean volume of Purkinje cells, and the mean numbers of granule and Purkinje cells in sub-regions of cerebellum) showed any statistically significant difference between the two groups. However, it should be emphasised that the two groups are small, and that previous studies reporting significant differences did not find changes in all cases of schizophrenia.
We found a significant correlation in both groups between the volume of the Purkinje cells (both perikarya and nuclei) and the weight of the cerebellum. This correlation could be interpreted in several ways: either the volume of the cells increases differentially owing to a number of uncontrolled factors that lead to fluid uptake (such as agonal events, post-mortem changes and fixation), or a biological relationship exists between the volume of cerebellum and the volume of the cells, so individuals with a large cerebellum also have large Purkinje cells. This point needs further clarification in a material with fewer variables.
This study presents estimates of the total number of Purkinje and granule cells in the cerebella of eight individuals with schizophrenia compared with ten controls. No problem was encountered in identifying the different cell types; although a few ectopic granule cells can be found outside the granular layer, they have no impact on the final estimates compared with the total granule cell number.
The result should be considered a rough estimate of the population means of the two groups, since the groups were very small. However, the quantitation provided estimates obtained from methods based on unbiased principles. Our data do not exclude a minor to moderate cell or volume loss, but major volume or cell loss in the cerebellar cortex — as proposed by others as a pathogenic factor in schizophrenia — seems unlikely. Cerebellar dysfunction caused by undetected morphologic change is still a possibility. For example, the number of synapses or cells in the deep cerebellar nuclei and the number of glial cells were not estimated in this material and their relevance is therefore unknown.
Clinical Implications and Limitations
CLINICAL IMPLICATIONS
-
▪ No global or regional atrophy was found in the cerebellar cortex of patients with schizophrenia.
-
▪ There was no evidence of loss of neurons in the anterior vermis in this severely affected group of patients.
-
▪ The cerebellar symptoms in some cases of schizophrenia may be caused by factors that do not lead to neuron loss.
LIMITATIONS
-
▪ The sample size does not exclude small differences in volumes and cell number in the different regions of the cerebellum.
-
▪ Although unbiased designs are applied, differential regional shrinkage can occur.
-
▪ The two groups are not directly comparable since almost all the people in the control group died from sudden heart failure, as opposed to those in the schizophrenia group who died from various causes, including cancer. It is unknown how chronic illness might influence the measurements of cell density and cell size.
Acknowledgements
The authors thank H. J. G. Gundersen for his help and advice regarding experimental design and statistical analysis, and Lykke Steffensen, Susanne Primdahl, Hans Jørgen Jensen and Ulla Vonger for their skilful technical assistance. The authors also thank the Ferd. and Ellen Hindsgaul Foundation, and the Director Emil C. Hertz and wife Inger Hertz Foundation for financial support. Approved by the local ethics committee (no. 11-010/01).


eLetters
No eLetters have been published for this article.