


Background
Individuals with intellectual disability are known to have higher rates of psychopathology than the general population.Reference Cooper, Smiley, Morrison, Williamson and Allan1, Reference Emerson and Hatton2 In particular, it is well established that they show a three- to five-fold increase in the prevalence of schizophrenia.Reference Cooper, Smiley, Morrison, Allan, Williamson and Finlayson3–Reference Morgan, Leonard, Bourke and Jablensky6 This increase in risk for psychosis has also recently been extended to those with borderline intellectual functioning (i.e. IQ between 70 and 85), who have been reported to have over twice the risk of developing a probable psychosis compared with those of higher IQ.Reference Hassiotis, Noor, Bebbington, Afia, Wieland and Qassem7 Despite these findings, there is a relative paucity of research on the early development of psychotic symptoms in the intellectually impaired, with studies more commonly focusing on groups at increased risk because of familial reasonsReference Johnstone, Ebmeier, Miller, Owens and Lawrie8 or the presence of prodromal symptoms.Reference Yung and Nelson9
The Edinburgh Study of Comorbidity
The Edinburgh Study of Comorbidity (ESC) was initially set up in 2005 to longitudinally examine a group of young people at enhanced risk for later schizophrenia because of intellectual impairment.Reference Johnstone, Owens, Hoare, Gaur, Spencer and Harris10 The ESC was stimulated by earlier work on the Edinburgh High Risk Study (EHRS) of people at familial risk of developing schizophrenia;Reference Johnstone, Ebmeier, Miller, Owens and Lawrie8 essentially the aim was to examine the extent to which the findings of the EHRS were replicated in an investigation where the heavy familial loading was not present. To this end, the cohort recruited for the ESC was not derived from health services, but instead was acquired from education services, on the basis that they were receiving special educational support for presumed intellectual impairment.
Within the ESC cohort, we have previously demonstrated that, at baseline, high levels of schizotypal traits were associated with clinical, neuropsychological and brain structural features that are consistent with findings from the EHRS.Reference Johnstone, Owens, Hoare, Gaur, Spencer and Harris10–Reference Stanfield, Moorhead, Harris, Owens, Lawrie and Johnstone12 We have also reported that those with the highest levels of schizotypal traits and adolescent behaviour difficulties were most likely to develop psychotic symptoms over the first 2 years of follow-up,Reference Johnstone, Owens, Hoare, Gaur, Spencer and Harris10 and that these individuals showed increased levels of medial temporal lobe volume loss over this time.Reference Moorhead, Stanfield, Spencer, Hall, McIntosh and Owens13 More recently, we extended these brain structural findings to 6 years of follow-up, into early adulthood, where we found that those with high levels of psychotic symptoms continue to show medial temporal lobe grey matter loss over this time,Reference Moorhead, Stanfield, McKechanie, Dauvermann, Johnstone and Lawrie14 and that the presence of negative symptoms is also associated with longitudinal grey matter tissue loss in other brain regions.Reference McKechanie, Moorhead, Stanfield, Whalley, Johnstone and Lawrie15
Aims and hypotheses
The current paper concerns the clinical findings derived from the 6-year follow-up study of these young people with special educational needs (SEN). Specifically, we had two primary aims: (a) to determine the level of psychiatric symptoms in this cohort through adolescence and early adulthood; and (b) to examine the predictors of the development of psychotic symptoms, and of psychotic disorder. With regard to our first aim and based on previous work examining psychopathology in adults with borderline and mild intellectual disabilities,Reference Cooper, Smiley, Morrison, Williamson and Allan1, Reference Hassiotis, Noor, Bebbington, Afia, Wieland and Qassem7 we hypothesised that those receiving educational assistance would have higher rates of psychopathology than controls at all three time points. For the second aim, in the light of our previous findings from the early follow-up of this cohortReference Johnstone, Owens, Hoare, Gaur, Spencer and Harris10 and from the EHRS,Reference Johnstone, Ebmeier, Miller, Owens and Lawrie8 we hypothesised that later psychotic symptoms, and indeed psychotic disorder, would be predicted by the combined presence of high levels of baseline schizotypal features and behavioural difficulties, as well as other known risk factors for psychosis, such as obstetric complications, substance misuse and family history.
Method
Participant recruitment and baseline assessment
Ethical approval for the study was granted by the Multicentre Research Ethics Committee for Scotland. Full details of recruitment are available elsewhereReference Johnstone, Owens, Hoare, Gaur, Spencer and Harris10 and are summarised in Fig. 1. Briefly, relevant schools and colleges throughout mainland Scotland were contacted and asked to identify young people, aged 13–22 years, receiving educational assistance for presumed intellectual impairment and with an estimated IQ of between 50 and 80 (as IQ is not routinely measured in the Scottish educational system). After exclusions, 394 individuals with SEN were recruited to undergo further investigation.

Fig. 1 Study flow diagram. CBCL, Childhood Behavioural Checklist; SIS, Structured Interview for Schizotypy.
At their initial assessment these participants were assessed with the Structured Interview for Schizotypy (SIS)Reference Kendler, Lieberman and Walsh16 and the Childhood Behavioural Checklist (CBCL).Reference Achenbach17 Cut-off values on these instruments were found to predict the later development of schizophrenia in the EHRS of individuals at enhanced familial risk of schizophrenia,Reference Johnstone, Ebmeier, Miller, Owens and Lawrie8 and therefore these were used to derive cut-off values for the ESC to create four cells of individuals: those with high scores on both the SIS and CBCL (SIShighCBCLhigh), those with low scores on both the SIS and CBCL (SISlowCBCLlow), and those with high on one and low on the other (SIShighCBCLlow and SISlowCBCLhigh). These SIS/CBCL groupings were then sampled with the intention of conducting detailed assessments on approximately equal numbers of individuals from each group. This left a final population of 168 individuals for study. It is important to note that this sampling deliberately led to a relative enrichment of individuals scoring high on these scales (see Fig. 1).
In addition, two comparison groups comprising typically developing siblings (also in the 13–22 years age group) and age-matched young people with no history of psychiatric disorder or special educational requirement recruited through youth organisations in the areas from which the sample participants came. Basic demographic data, reported diagnoses (if any) and family history of psychiatric or neurodevelopmental disorders were also obtained at this time. Family history was considered in four categories: psychotic illness, non-psychotic psychiatric illness, epilepsy and intellectual disability, and no family history.
Assessments
Approximately 6 months following this baseline assessment, participants were then examined with the semi-structured Clinical Interview Schedule (CIS)Reference Goldberg, Cooper, Eastwood, Kedward and Shepherd18 and the Positive and Negative Syndrome Scale (PANSS).Reference Kay, Fiszbein and Opler19 These assessments of psychopathology were conducted by clinicians blinded to group membership of participants. Interrater reliabilities were conducted for the CIS and were greater than 0.76.Reference Johnstone, Owens, Hoare, Gaur, Spencer and Harris10 IQ was formally measured at this time with either the Wechsler Adult Intelligence Scale, 3rd edition or the Wechsler Intelligence Scale for Children, 3rd edition as appropriate.Reference Wechsler20, Reference Wechsler21 In addition, participants also underwent a structural magnetic resonance imaging scan and neuropsychological assessments of executive function and memory, although these are not considered further in the current paper. All of these assessments were conducted by staff who had not been involved in the initial assessments with the SIS and CBCL and who were therefore blind to their ratings on these instruments.
The CIS, PANSS, magnetic resonance imaging and neuropsychological assessments were repeated 1–2 years later and again 6 years later in all participants who consented to be followed up, although on the last occasion, no attempt was made to reassess the sibling controls. Information on substance misuse was collected only for those who returned after 6 years.
Participants and their mothers were also asked to give consent for the examination of their obstetric and neonatal histories from routinely collected healthcare data held by the Information and Statistics Division of the National Health Service in Scotland. Full details of the data extracted and the linkage process are given elsewhere.Reference Sussmann, McIntosh, Lawrie and Johnstone22 For the present study, data on gestational age at birth, weight at birth, occipitofrontal circumference and Apgar scores were examined.
Statistical analyses
As the present study concerns the possible predictors of psychotic symptoms, only participants who had provided data for interview on at least two of the three assessment points were included. The related controls were not included as they were not assessed at the final time point.
To examine the psychopathology in all participants, PANSS subscale scores at each successive time point were compared between controls and the SEN group, initially as a whole and then divided by SIS/CBCL grouping. As the PANSS scores were not normally distributed, Kruskal–Wallis tests and Mann–Whitney U-tests were used for these analyses.
The next step aimed to establish whether factors found to predict psychosis in the familial EHRS were also associated with the development of psychotic symptoms in the current cohort. The identification of psychotic symptoms can be more difficult to make with confidence in those with intellectual disability;Reference Deb, Matthews, Holt and Bouras23 this is particularly the case for negative symptoms such as poverty of speech or flattening of affect, but also for certain positive symptoms such as conceptual disorganisation. With this in mind, a conservative approach was adopted, only considering participants as having psychotic symptoms if they showed clear evidence of either delusions or hallucinations (which, according to PANSS criteria, relates to a score of 3 or more in relevant items) at one or more time points throughout the study. This is consistent with our previous approach in this cohort.Reference Moorhead, Stanfield, McKechanie, Dauvermann, Johnstone and Lawrie14 Using these criteria, participants were therefore divided into two groups: psychotic symptoms present and psychotic symptoms absent. The relationship between psychotic symptom status and SIS/CBCL grouping was then examined by χ2-tests and an odds ratio was calculated comparing those who scored above the cut-off value on both instruments versus the remainder of the population. Next, the relationship between symptom status and the other potential predictors of interest (IQ, family history, obstetric complications and substance misuse) were examined by comparing the groups, using t-tests, χ2-tests or Mann–Whitney U-tests as appropriate to the distribution of the data.
Although the above analyses examine the relationship between psychotic symptoms and potential predictors, one of the primary intentions of the study was to consider whether the SIS/CBCL groupings would be helpful in predicting the development of a psychotic disorder, not just symptoms. To examine this, a final analysis was conducted where the SEN group was dichotomised into those with a likely psychotic disorder, based on scoring 4 or more on the delusions or hallucinations items of the PANSS, and those without. A χ2-test was then used to determine the relationship between SIS/CBCL grouping and future diagnostic status; sensitivity and specificity, as well as positive and negative predictive values, were also calculated for the SIS/CBCL groupings.
Results
Participant characteristics and psychopathology
The characteristics of the cohort at each time point are shown in Table 1. Of the 168 participants assessed at time point 1, 122 returned for time point 2 and 56 returned for time point 3. The reasons for the attrition between time point 2 and 3 related primarily to the recontact process required for the 6-year follow-up, which occurred via participants' general practitioners.Reference Moorhead, Stanfield, McKechanie, Dauvermann, Johnstone and Lawrie14 To summarise, of those seen at the second time point, 3 participants did not give permission for future contact, 15 participants were uncontactable, 23 participants no longer wished to be involved and 26 participants did not wish or were not able to return for full face-to-face assessments. In addition, one participant attended for time point 3 who did not attend for time point 2. There were no significant differences in baseline SIS/CBCL group membership between those who attended for all three time points and those who only attended at time points 1 and 2.
Table 1 Cohort and control participant characteristics
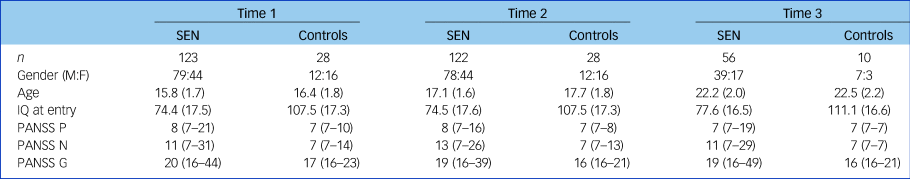
Age and IQ given as mean (s.d.); PANSS scores given as median (range). M:F, male:female; PANSS, Positive and Negative Syndrome Scale; PANSS G, PANSS general subscale score; PANSS N, PANSS negative subscale score; PANSS P, PANSS positive subscale score; SEN, special educational needs.
There were no significant differences in age between the groups at any time point (all P > 0.10); however, gender differed significantly between the SEN group and the controls at time points 1 and 2 (both P = 0.04), but not at time point 3 (P = 1.0).
The SEN group scored more highly than the controls on all subscales of the PANSS at each time point throughout the study (see Table 1, Cohen's d effect sizes ranging from 0.54 to 1.4; all P < 0.007). This was the case regardless of whether the SEN group had an IQ <70 or not (all P < 0.03). Within the SEN group, those with an IQ <70 tended to score more highly on negative symptoms than those with an IQ >70, but this was only significant at time points 2 and 3 (time point 1: Z = −1.54, P = 0.12; time point 2: Z = −3.40, P = 0.001; time point 3: Z = −2.69, P = 0.007). For positive and general symptoms there were no significant differences within the SEN group at any time point between those with an IQ <70 compared with those with higher IQ (all P > 0.44). Notably, ten participants in the study had IQs ≥100; no significant differences were found between these ten and the other participants in their SIS, CBCL or PANSS scores at any time point (all P > 0.10).
When the SEN group were divided into the SIS/CBCL groupings, the Kruskal–Wallis test showed significant differences for positive, negative and general subscale scores on the PANSS at all time points. Follow-up Mann–Whitney U-tests revealed that the SEN participants had higher levels of negative symptoms and general psychopathology than the controls at all time points, regardless of their SIS/CBCL group allocation (all P < 0.02). Positive symptoms were also higher in the SEN groups with SIS scores above the cut-off value (i.e. SIShighCBCLhigh and SIShighCBCLlow groups) at all time points; whereas the two groups that scored below the cut-off value on the SIS (i.e. the SISlowCBCLhigh and SISlowCBCLlow groups) did not show significantly greater positive symptoms than the controls at time point 1 and time point 3 (see Supplementary Figure 1 available at https://doi.org/10.1192/bjp.2018.296).
Detailed inspection of the individual PANSS symptoms showed that across the three time points the relative morbidity of the SEN group in terms of positive symptoms is primarily related to hallucinations and delusions; in terms of negative symptoms it relates to concrete thinking, flattening of affect, poor rapport and poverty of speech; and in terms of general symptoms relates to high levels of anxiety, depression, somatic concern, unusual thought content and preoccupation (see Supplementary Figures 2–4).
Factors associated with the development of positive psychotic symptoms
The characteristics of the SEN groups determined by the presence or absence of positive psychotic symptoms are shown in Table 2. There were no differences between the groups with regard to age, gender or IQ (all P > 0.1). The presence of positive psychotic symptoms was significantly associated with baseline SIS/CBCL grouping (χ2 = 7.94, P = 0.047); with the SIShighCBCLhigh group showing enhanced risk compared with the remainder of the population (odds ratio, 3.48; 95% CI 1.34–9.02).
Table 2 Characteristics of participants with SEN divided by the presence or absence of positive psychotic symptoms
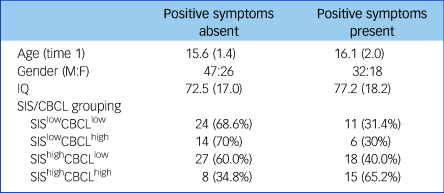
Positive symptoms absent: individuals who never scored >2 on PANSS delusions or hallucinations subscales. Positive symptoms present: individuals who scored ≥3 on PANSS delusions or hallucinations subscales at one or more time points throughout the study. Age and IQ are given as mean (s.d.). CBCL, Childhood Behavioural Checklist; M:F, male:female; PANSS, Positive and Negative Syndrome Scale; SEN, special educational needs; SIS, Structured Interview for Schizotypy.
Family history data were available on 106 participants in the SEN group. Of these, 15 individuals (14.2%) had a family history of a psychotic illness, 52 individuals (49.1%) had a family history of non-psychotic psychiatric disorder, 24 individuals (22.6%) had a family history of intellectual disability and 9 individuals (8.5%) had a family history of epilepsy. χ2-tests showed that there were no significant relationships between any of the above family histories and the presence of positive psychotic symptoms (all P > 0.08).
Obstetric data were available on 91 participants in the SEN group. No significant associations were found between the presence of positive psychotic symptoms and birth weight (t = −0.88, P = 0.38), gestational age (t = −0.99, P = 0.32), occipitofrontal circumference (t = −0.83, P = 0.41), Apgar score at 1 minute (Z = −0.80, P = 0.43) or Apgar score at 5 minutes (Z = −1.04, P = 0.30).
Data on illicit drug use were available for 54 of the 56 SEN participants who attended the third follow-up. Of these, only nine participants had ever used illicit drugs on more than three occasions. There was no relationship between illicit drug use and the presence of psychotic symptoms (Fisher's exact test, P = 1.0).
The development of psychotic disorder in the cohort
Nine participants scored 4 or more on either the delusions or hallucinations subscales of the PANSS. In seven of them, the symptoms were persistent and convincing and provide strong clinical justification for a diagnosis of definite or probable schizophrenia. In the remaining two, the diagnosis is less clear as the account given was limited; however, they did report persistent auditory hallucinations over a sustained period. The distribution of these individuals with respect to the baseline SIS/CBCL groups is shown in Table 3. The Fisher's exact test demonstrated significant differences between the groups (P = 0.003), with six of the nine participants being in the SIShighCBCLhigh group at baseline; the SIShighCBCLhigh group showed significantly increased risk compared with the remainder of the population (odds ratio, 11.4; 95% CI 2.6–50.1).
Table 3 Distribution of psychotic participants among the baseline SIS/CBCL groupings
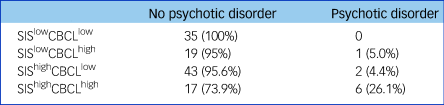
No psychotic disorder: individuals who never scored >3 on PANSS delusions or hallucinations subscales. Psychotic disorder: individuals who scored ≥4 on PANSS delusions or hallucinations subscales at one or more time points throughout the study. CBCL, Childhood Behavioural Checklist; PANSS, Positive and Negative Syndrome Scale; SIS, Structured Interview for Schizotypy.
In terms of the 6-year prediction of psychotic disorder among individuals with SEN, using both the SIS and CBCL cut-off values provides the following values: sensitivity of 0.67, specificity of 0.85, positive predictive value of 0.26 and negative predictive value of 0.97.
Discussion
In this non-clinical sample of young people who received special educational support, we found that the presence of schizotypal cognitions and behavioural difficulties in mid-adolescence was associated with the development of psychotic symptoms, and likely schizophrenia, over the following 6 years. These findings are in keeping with our original hypothesis, and are consistent with our previous study of individuals at risk of schizophrenia for familial reasons.Reference Johnstone, Ebmeier, Miller, Owens and Lawrie8
Our findings suggest that the personality and behavioural features associated with the development of psychosis are the same regardless of whether the vulnerability state to psychosis is familial or intellectual in nature. However, there are overlaps between the genetic risk factors for psychosis and cognitive impairment.Reference Hubbard, Tansey, Rai, Jones, Ripke and Chambert24 An alternative explanation of the concordance between the current study and the previous familial study is therefore that intellectual impairment in the current sample results from genetic factors overlapping those in our familial sample. If that is the case then intellectual impairment may not be an independent vulnerability state to psychosis, and instead the participants intellectual impairments could be regarded as resulting from a genetically determined schizophrenic process where the full symptoms of the disorder are yet to become manifest.
It is evident from Table 3 that although most people who score above the SIS and CBCL cut-off values do not become unwell, a significant minority (26%) do develop a later psychotic disorder. This is around five to ten times higher than the reported rates in people with intellectual disability as whole.Reference Cooper, Smiley, Morrison, Allan, Williamson and Finlayson3–Reference Morgan, Leonard, Bourke and Jablensky6 Although this prevalence is high, the positive predictive value that we report is relatively low (0.26), highlighting that if these tests were applied widely, three out of four individuals would screen positive but would not go on to develop a psychotic disorder. Despite the fact that such screening could be potentially useful to clinicians, the risk of harm to participants and their families must be considered and any screening carefully explained. Perhaps of greater utility is the potential of these tests to exclude the risk of later psychotic disorder in this vulnerable population, and this is reflected in the high negative predictive value that we report (0.97). It is particularly notable that no one in the SISlowCBCLlow group was found to develop psychotic disorder across 6 years of study, suggesting a very low risk in this group.
We did not find any association between the presence of psychotic symptoms in those with SEN and the other potential predictors that we examined: obstetric factors, family history or substance misuse. These findings were not expected given their previously identified associations with psychosis. It is important to note that in the current study, rates of adverse obstetric factors were increased compared with general population rates,Reference Sussmann, McIntosh, Lawrie and Johnstone22 which is consistent with the established association between obstetric complications and intellectual disability.Reference Eaton, Mortensen, Thomsen and Frydenberg25 This may explain why we did not observe the relatively specific association between obstetric complications and schizophrenia that has previously been reported in the general population. It is possible that family history and substance misuse do not affect the likelihood of developing psychotic symptoms in this population; however, the group sizes for each were relatively small, which may have affected our ability to detect any differences that were present.
Beyond our initial question, we also identified that individuals receiving special educational support also showed persistently elevated levels of non-psychotic symptoms compared with controls, across adolescence and into early adulthood. It is important to note that this population was recruited through educational services and very few of them had sought medical attention for these symptoms. Although the absolute differences in PANSS scores were relatively small, the effect of having morbid psychopathology in adolescents is high.Reference Thapar, Collishaw, Pine and Thapar26, Reference Thapar, Collishaw, Pine and Thapar27 We have previously shown that functional outcome in this cohort is highly variable and is related to intellectual ability and behavioural difficulties;Reference McGeown, Johnstone, McKirdy, Owens and Stanfield28 we did not, however, consider ongoing psychopathology in that report. The findings presented here suggest that this matter merits further attention, as much of the general psychopathology was accounted for by anxiety- and mood-related symptoms, and effective treatments for these symptoms are well established. The identification and treatment of these symptoms would at least relieve distress, and may help to lift those whose functional outcome is limited to the very much better levels of some of their peers so that they might reach their full potential.
There are a number of potential issues as regards this study that merit further consideration. The defining characteristic of the sample was their receipt of special educational assistance because of presumed intellectual impairment, but within the sample there was a wide range of educational difficulties reported by families. Unfortunately we did not have access to school records to confirm the exact nature of these reported difficulties, therefore we were unable to examine whether specific difficulties are associated with later mental ill health. We do not have detailed symptom-level data for those who did not return for the final follow-up and it is possible that this may have biased our results. However, there were no significant differences in baseline SIS/CBCL group membership between those who attended all three time points and those who only attended the first two, therefore it is unlikely that this drop-off selectively affected our findings. It is also important to note that the group under study here was deliberately sampled to be weighted toward those scoring highly on the SIS and CBCL (see Fig. 1). As such, the exact rates of psychopathology for the group as a whole cannot be generalised to the wider population of people receiving educational assistance. However, even the group of participants who scored below the cut-off values on both the SIS and the CBCL showed higher levels of psychopathology compared with controls (Supplementary Figure 1), indicating that our broad finding of increased psychopathology in this group is likely to hold for the wider population. Finally, although the clinicians rating psychopathology were technically blinded as to whether or not a participant was in receipt of educational assistance, in many cases this may have become apparent to them during the conduct of the clinical interview, which could have influenced our findings for the SEN group as a whole; however, it is worth highlighting that they would have remained unaware of SIS/CBCL group membership.
Implications
Overall, these findings suggest that the personality and behavioural features associated with the development of psychosis in those with intellectual impairments are similar in nature to those observed in people who are vulnerable to psychosis as a result of their familial genetic loading. They also raise the possibility of using relatively simple screening measures to identify those at greatest risk of future psychosis, and highlight the need to be vigilant for the presence of potentially treatable psychopathology, both of a psychotic and non-psychotic nature, in this vulnerable group.
Supplementary material
Supplementary material is available online at https://doi.org/10.1192/bjp.2018.296.
Funding
This study was supported by a programme grant from the UK Medical Research Council (G0100102) awarded to E.C.J., by the RS Macdonald Charitable Trust awarded to D.G.C.O. and by the Dr Mortimer and Theresa Sackler Foundation awarded to E.C.J.
Acknowledgements
We are grateful to all of the study participants and their families, without whom this study would not have been possible.


eLetters
No eLetters have been published for this article.