


High salt intake is associated with raised blood pressure and adverse cardiovascular health(Reference He and MacGregor1). Reducing population salt intake is recommended as one of the most effective and affordable public health strategies to lower blood pressure and reduce cardiovascular risk worldwide(2,3) . Although achievements in national salt reduction have been reported in some countries(Reference He and MacGregor1), excessive salt consumption remains a major public health problem in most countries, especially in low- and middle-income countries(Reference Du, Batis and Wang4,Reference Trieu, Neal and Hawkes5) . In view of different cultural habits and dietary preferences, dietary Na intake and the major contributory sources vary among populations(Reference Brown, Tzoulaki and Candeias6). Understanding the pattern of Na intake and its contributory food sources is therefore essential to provide insights into specific targets for tailoring salt reduction strategies in a population.
In Hong Kong, hypertension and CVDs are prevalent(7,8) and an age-related increase in comorbidities, including hypertension, stroke and heart diseases, starting from mid-life has been noted(9). The latest local statistic in 2014–2015 showed that the mean dietary salt intake estimated from 24-h urinary Na excretion was at 7·5 g/d for female and 9·7 g/d for male in the age group of 55–64 years and 6·8 g/d for female and 8·7 g/d for male in the age group of 65–84 years(10). However, local studies evaluating Na intake using 24-h urine samples and the food sources contributing to Na intake simultaneously are limited(Reference Liu, Ho and Tang11,12) . To our knowledge, no local studies have been conducted in other life stages of the population, in particular among healthy people from mid-life and over. It is necessary to investigate which dietary factors are associated with higher urinary Na excretion to promote salt reduction effectively in public health programmes.
Given this research gap and the importance of salt reduction in the prevention of hypertension and CVDs, the present study aimed to examine Na intake, its contributory food sources and the associations between dietary factors and urinary Na excretion in healthy Chinese adults aged 50 years and above in Hong Kong.
Methods
Participants
Data were derived from participants who completed a baseline assessment of a randomised controlled trial assessing the effectiveness of exercise and nutrition supplementation on improving physical and cognitive functions in Hong Kong (The Dutch Trial Registry – reference no. NTR6214)(Reference Woo, Chan and Ong13). One hundred and sixty-three Chinese men and women aged 50 years and over living in Hong Kong were recruited in community facilities. They were screened as robust according to the FRAIL scale(Reference Morley, Malmstrom and Miller14) and free of cognitive impairment based on the Chinese version of the Mini-Mental State Examination (i.e. with score > 18)(Reference Chiu, Lee and Chung15). Exclusion criteria included recent (i.e. past 3 months) or concurrent participation in any clinical trial or lifestyle intervention programme, BMI ≥ 27·5 kg/m2, self-reported allergy or intolerance to the ingredients of the nutrition supplement, poorly controlled chronic diseases, recent illnesses or fractures, a diagnosis of cancer and regular use of Ca or vitamin supplements and traditional Chinese medicines.
In the present study, analyses were based on the urine sample and dietary intake assessed prior to the intervention to reflect the usual dietary habits of the participants. Among 163 participants recruited, none of them showed inaccurate urine collection (criteria can be referred to the ‘Urinary biochemical measurements’ section). Instead, forty-nine participants were excluded due to missing urine samples (n 8) or recent use (i.e. 3 months) of anti-hypertensive medications or having medical history of stroke, heart diseases, liver disorders or renal diseases (n 41). The final analysis was based on data from 114 participants (fifty-five men, sixty-three women).
Demographic, general health and anthropometric data
Data on demographics and general health were collected by trained interviewers through face-to-face interviews using structured questionnaires covering age, gender, education level, occupational status, marital status, smoking habit, alcohol use and medical history. Body weight was measured to the nearest 0·1 kg with participants wearing a light gown, using the TANITA Body Fat Monitor/Scale (Model BF-522, Tanita Corporation of America, Inc.). Height was measured to the nearest 0·1 cm using the stadiometer (Model no. 213, SECA Gmbh & Co. kg). BMI was calculated as body weight in kg/(height in m2). Systolic blood pressure and diastolic blood pressure were measured by trained research staff using an automatic sphygmomanometer (OMRON Model: HEM-7130). Two consecutive blood pressure measurements were recorded, and the average of both readings was used.
Twenty-four hours urine collection
Participants were asked to provide a single 24-h urine sample. They were provided with a urine cup, a urine bottle and a detailed instruction leaflet on the method of 24-h urine collection. They were reminded to void their bladder before starting the collection and save all urines voided from that moment onwards for the subsequent 24 h. Participants were asked about the completeness of urine collection and to record the start and the final collection times. The total volume of urine was measured and the urine sample was mixed thoroughly before aliquots by trained research staff. Aliquoted urine samples were immediately frozen to −80°C until analysis.
Urinary biochemical measurements
Twenty-four hours urine samples were obtained for the measurement of urinary Na, K and creatinine. The assays were performed by an accredited laboratory in Hong Kong (PathLab Medical Laboratories Ltd.). Urinary creatinine (mg/d) was measured using spectrophotometry (Vitros Fusion 5,1, Vitros Chemistry Products, USA). Urinary Na (mmol/d) was measured using potentiometry (Vitros Na+ slide method, Vitros Chemistry Products, USA), and urinary K (mmol/d) was measured using potentiometry (Vitros K+ slide method, Vitros Chemistry Products, USA). Urinary Na and K excretion were converted to mg/d by using the molar mass of Na (23 mg/mmol) and K (39·1 mg/mmol). Urinary Na to K ratio was calculated by dividing urinary Na by K concentrations. The intra-assay and inter-assay CVs were 1·0 to 1·2 % and <1·5 %, respectively, for urinary creatinine, 1·0 to 1·7 % and 2·6 to 4·3 %, respectively, for urinary Na, and 1·7 to 2·6 % and 2·3 to 2·5 %, respectively, for urinary K. Total urine volume over 24-h was also measured. Urinary Na excretion was analysed as a proxy of salt intake (g/d) calculated by the formula: 24-h urine volume (l) × urinary Na (mmol/l) × 58·4(Reference Brown, Tzoulaki and Candeias6). Urinary K excretion was used to estimate K intake (g/d) using the formula: 24-h urine volume (l) x urinary K (mmol/l) x 50·8. Total urine volume and urinary creatinine were also used to assess the completeness of 24-h urinary collections. A daily urine volume of <500 ml and a creatinine excretion rate of <350 mg/d or >3500 mg/d suggest inaccurate urine collection(Reference Ix, Wassel and Stevens16).
Dietary assessment and estimation of dietary sodium intake
A 3-d diet record was used to assess participants’ dietary intake. Participants were asked to record their dietary intake for 3 d including food and beverages consumed and any salt/seasoning added at the table. The days of recording were randomly assigned so that all days of the week, including weekend days, were equally represented. Instructions about recording types of foods and how to estimate the portion sizes in household measures were given. On the scheduled visit, the trained interviewers checked the diet record for its completeness and clarified any unclear items or amounts with the participants. Participants were also asked to report their salt taste preference in comparison with general restaurants (not salty, slightly salty and salty). The daily food group consumption and nutrient intake were calculated by the Food Processor Nutrition Analysis and Fitness software version 8.0 (ESHA Research, Salem, USA), with the addition of the composition of local foods based on food composition tables from China and Hong Kong(Reference Yang, Wang and Pan17,18,19,Reference Yang, Wang and Pan20) . The Na consumption of the following sixteen food groups was calculated: cereals and their products; Chinese dim sum; preserved/salted foods (vegetables, meat, fish, etc.); milk and dairy products; animal meat; seafood; vegetables; soya foods; fruits; nuts; chips and cookies; beverages; soups; sugars and confectionary; fats and oils and condiments. In our study, condiments were defined as the salt/seasoning added during cooking and at the table. For the salt/seasoning added during cooking, the estimation was based on the participants’ responses on their salt taste preference (not salty, slightly salty and salty). For the salt/seasoning added at the table, the estimation was based on the amount reported by the participants when they completed the 3-d diet record (e.g. one tablespoon of oyster sauce was consumed with one bowl of boiled lettuce). Total Na intake was calculated by summing the estimates from all contributory food groups.
Statistical analyses
Statistical analyses were performed separately for men and women using the statistical package SPSS version 24 (IBM SPSS Statistics for Windows, Version 24.0 IBM Corp.). Data were checked for normality using descriptive analysis. Since the continuous variables were normally distributed, they are presented as mean and sd. The differences in general characteristics as well as other biochemical and dietary parameters between men and women were examined using the χ 2 test or Fishers’ exact test for categorical variables and by independent t-test for continuous variables, where appropriate. The differences in general characteristics between participants who remained in the analysis and participants who were excluded from the analysis were also compared.
The compliances to the WHO (<5 g/d) and China Nutrition Society (<6 g/d) recommendations for salt intake were assessed based on the urinary Na excretion(2,Reference Yang, Wang and Leong21) . The relative contribution of food groups to the dietary Na intake was expressed as percentages. Associations between the quantity of each food group and urinary Na excretion were analysed by a multiple linear regression adjusting for age, sex, BMI and daily energy intake. Results are presented as the regression coefficients (β) with 95 % CIs. All statistical tests were 2-sided, and P values < 0·05 were considered statistically significant.
Results
Characteristics of participants
Table 1 shows the characteristics of the participants. Participants aged between 50 and 83 years, with the mean age of 60·6 (sd 6·2) years. There were significant gender differences in the characteristics. Men were older, had a higher proportion of being married, and were more likely to be past or current smokers and alcohol users than women (P < 0·05). Men also had a higher body weight, height and blood pressure than women (P < 0·05). Participants who were excluded from the analysis were older (mean age: 62·8 years v. 60·6 years, P = 0·039) but did not show a significant difference in other characteristics in comparison with participants who remained in the analysis (details not shown).
Table 1 Characteristics of participants
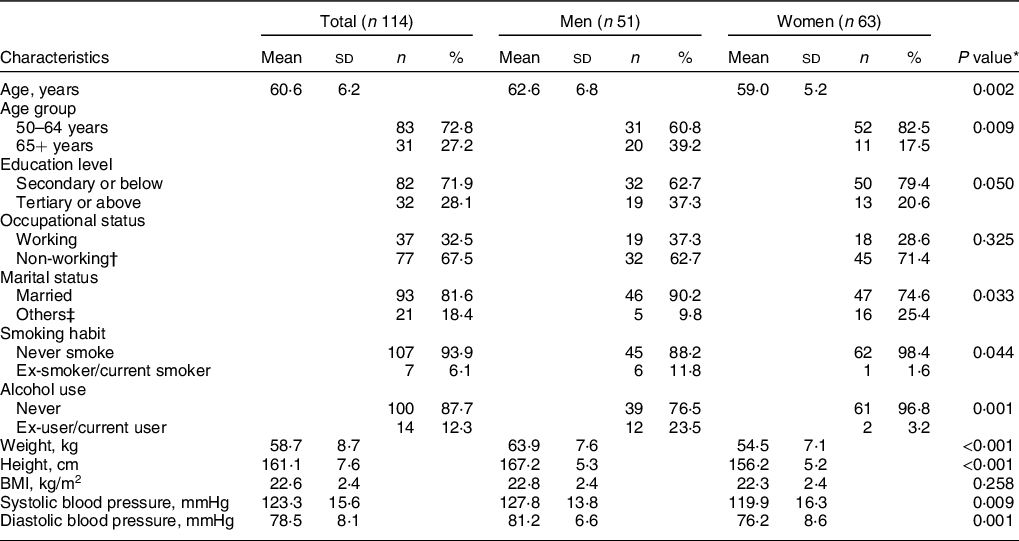
* P value for gender difference by independent t test or χ 2 test/Fisher’s exact test where appropriate.
† Non-working included retirement, unemployment and housewife.
‡ Others included never married, widowed, separated and divorced.
Urinary excretion and dietary estimation of salt, sodium and potassium
Table 2 shows the results of urinary excretion and dietary estimation of salt, Na and K of the participants. Most of the participants (61·0 %) reported slightly salty as their salt taste preference. Overall, the mean salt intakes estimated from urinary Na excretion and diet records were 7·3 (sd 3·2) g/d and 8·7 (sd 2·3) g/d, respectively. Based on the results of salt intake estimated from urinary Na excretion, 22·8 % of participants met the WHO recommendation(2), whereas 34·2 % of participants met the Chinese Nutrition Society recommendation(Reference Yang, Wang and Leong21). The mean urinary K excretion and the mean K intake estimated from the 24-h urine sample were 1915·3 (sd 675·3) mg/d and 2489·9 (875·3) mg/d, respectively. Only 8·8 % of participants achieved the WHO recommended K intake level(22). While urinary creatinine excretion was significantly higher in men than in women, there was no significant gender difference in the urinary excretion and dietary estimation of salt, Na and K. Men had a higher daily energy intake but lower energy-adjusted Na and K intakes than women.
Table 2 Data from 24-h urine samples and 3-d diet records of participants
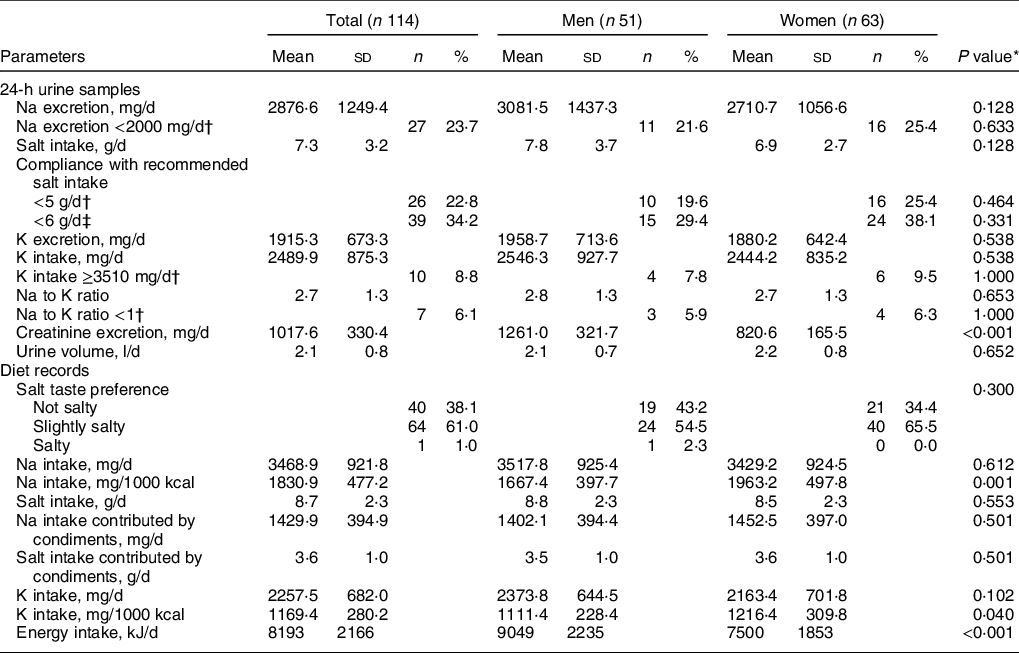
* P value for gender difference by independent t test or χ 2 test/Fisher’s exact test where appropriate.
‡ By the China Nutrition Society(Reference Yang, Wang and Leong21).
Sources of dietary sodium intake
Figure 1 shows the contribution of dietary Na intake from major food groups. The main sources of total daily Na intake were condiments (42·4 %), followed by cereals and their products (16·8 %) and soups (13·5 %). The main source of Na intake per meal occasion was cereals and their products for breakfast (40·6 %), condiments for lunch (46·7 %) and dinner (52·6 %) and chips and cookies for mid-meals (23·1 %). There were no significant differences in the percentage contribution of food groups to total daily Na intake between men and women, except for animal meat, which contributed to 5·8 % and 3·4 % of Na intake in men and women, respectively (P = 0·012, data not shown).
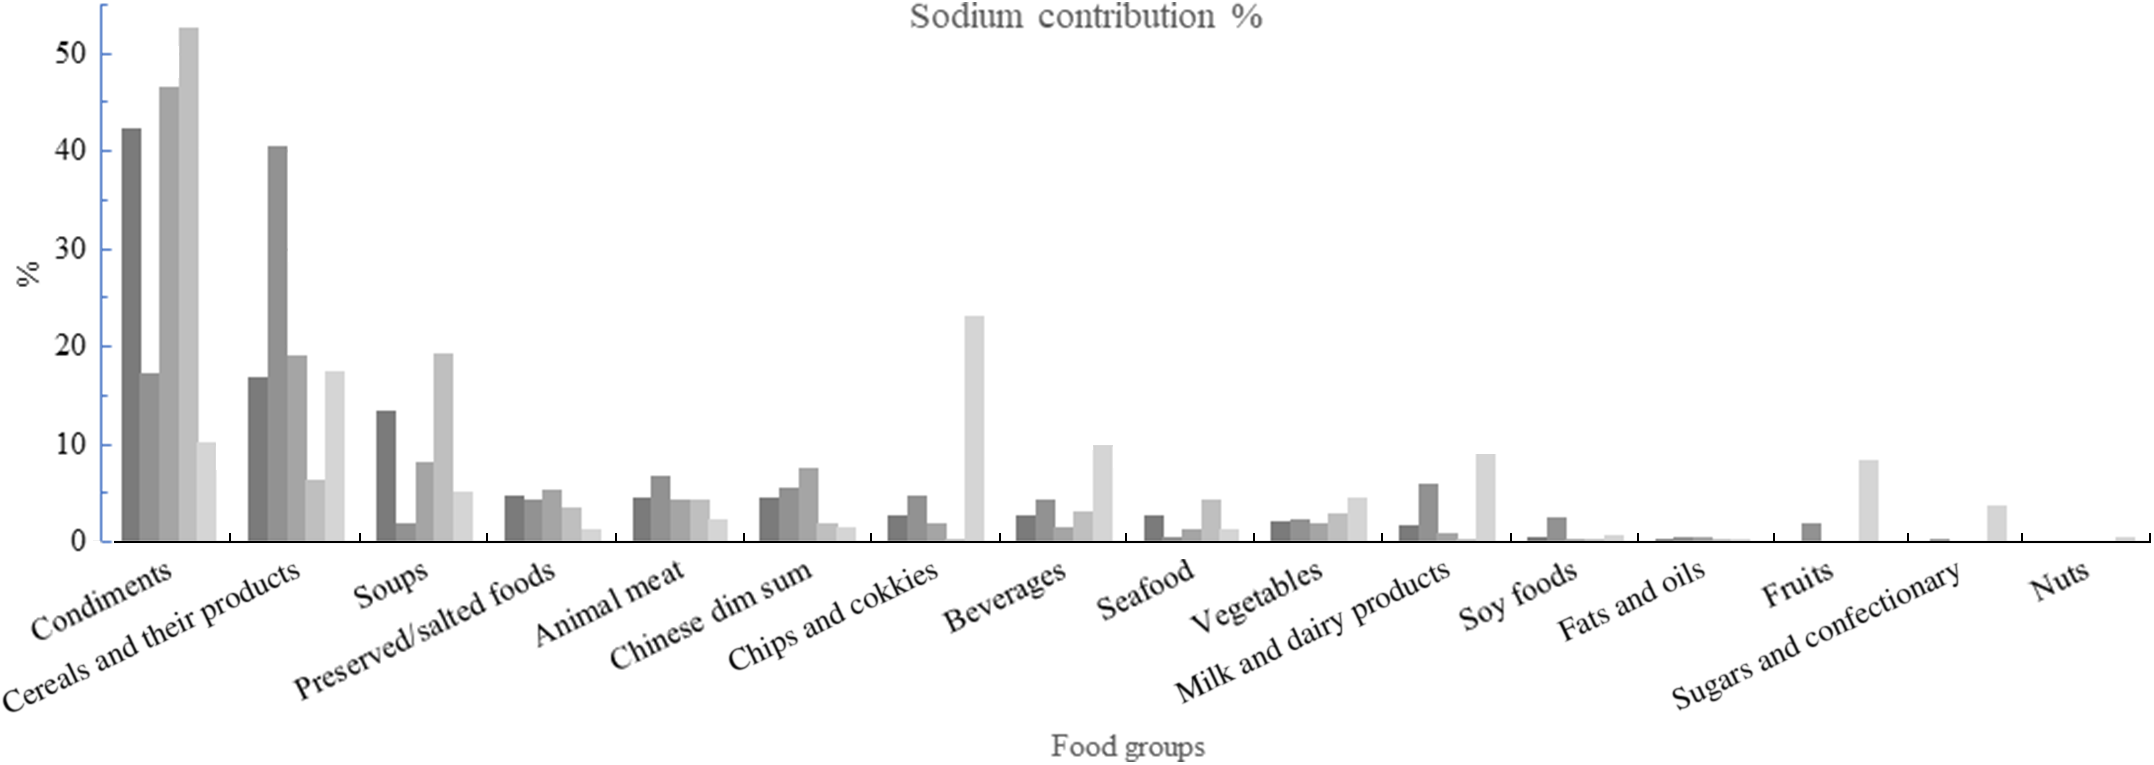
Fig. 1 Percentage contribution of food groups to dietary sodium intake among healthy Chinese adults aged 50 years and over in Hong Kong. ![]() , Total;
, Total; ![]() , breakfast;
, breakfast; ![]() , lunch;
, lunch; ![]() , dinner;
, dinner; ![]() , mid-meals
, mid-meals
Associations between the quantity of each food group and urinary sodium excretion
Table 3 shows the multiple linear regression analysis for urinary Na excretion using sex, age, BMI and dietary energy intake as covariates. Higher intake of seafood (β = −4·810, se = 2·297, P = 0·039) and nuts (β = −18·959, se = 8·393, P = 0·026) were associated with lower urinary Na excretion in the adjusted model. Higher intakes of cereals and their products and animal meat were associated with higher urinary Na excretion in the unadjusted model; however, the associations were not significant after adjusting for age, sex, BMI and daily energy intake. Intake of other food groups was not associated with urinary Na excretion.
Table 3 Associations between quantity of each food group and 24-h urinary sodium excretion
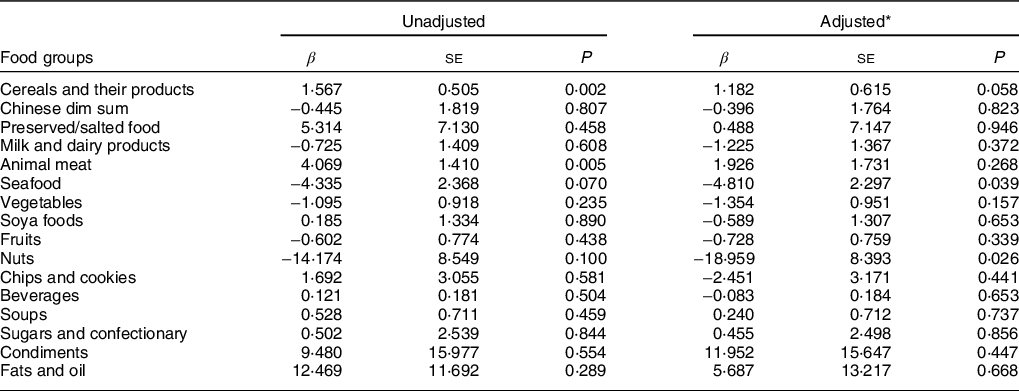
β, regression coefficient.
* Adjusted for age, sex, BMI and daily energy intake.
Discussion
The average salt intake estimated from 24-h urinary Na excretion was 7·3 ± 3·2 g/d among healthy Chinese adults aged ≥50 years, with 22·8 % and 34·2 % had salt intake below the WHO and China Nutrition Society recommendations, respectively. Condiments were the major contributor of Na intake, followed by cereals and their products and soups. Higher intakes of seafood and nuts were associated with lower urinary Na excretion.
The present study was in line with previous local studies which found that the average salt intake in Hong Kong exceeded the WHO recommendation. The first Hong Kong Total Diet Study conducted between 2005 and 2007 found an average salt intake of 5·3 to 7·3 g/d based on diet records among adults aged ≥50 years(12). A study in 2011 showed an average salt intake of 7·8 g/d estimated from the 24-h urinary samples among postmenopausal women with prehypertension. This corresponds to only 18 % and 32 % of individuals who had salt intake below the WHO and the China Nutrition Society recommendations(Reference Liu, Ho and Tang11). The Population Health Survey 2014/15 of the Department of Health reported an average salt intake of 6·8 to 9·7 g/d estimated from the 24-h urinary samples among adults aged ≥55 years(10). High dietary Na intake is associated with cardiovascular morbidity and mortality(Reference He and MacGregor1,Reference O’Donnell, Mente and Yusuf23) . Although average salt intake in Hong Kong was relatively lower than that assessed by urinary Na excretion in other parts of China (8·1 g to 11·8 g)(Reference Xu, Wang and Chen24,Reference Yang, Chen and Yin25) and Asian countries (10·4 g as reported in a meta-analysis)(Reference Huang, Crino and Wu26). Results of the present and previous local studies suggest that population-based strategies for reducing salt intake should be reinforced in order to further reduce the salt intake closer to the target of a 30 % relative reduction in the mean daily population salt intake by 2025, with an eventual target of <5 g/d as recommended by the WHO(27).
The main food sources identified in this study were consistent with previous local studies, which found that condiments/sauces/herbs, mixed dishes, soups, salted foods and Chinese dim sum were the major sources of Na intake in Hong Kong(Reference Liu, Ho and Tang11,12) . Condiments, cereals and their products and soups are considered a major part of the Chinese traditional diet and therefore persuading people to change their dietary behaviour is challenging. A reduction in the Na content of these major food sources of Na intake should be effective in decreasing Na intake.
There is a possibility for Hong Kong to adopt the UK model, in which the food industry offers reduced-Na foods without explicitly informing consumers of Na reduction. This was described as a clear advantage over launching new reduced salt products(Reference Tan, He and Ding28). A study evaluated the effect of food reformulation on dietary Na intake in a real-life canteen setting and showed that consumption of reduced-Na lunches (29 % to 61 % Na reduction) over 3 weeks was well accepted by the uninformed consumers(Reference Janssen, Kremer and van Stipriaan29). After consuming reduced-Na lunches, 24-h urinary Na excretion of the intervention participants was significantly lower (equivalent to a decreased daily salt intake of 2·3 g) than the control participants who consumed regular lunches. Indeed, a local study among older adults found that there was no significant difference in the tastiness rating of soup between the low-Na and medium-Na options, implying that there is room for reducing the Na content of soup without significantly affecting the tastiness of soup(Reference Chau, Ngai and Leung30). The same study also revealed that the willingness of older adults to consume low-Na food was the tastiness of the food, rather than health concern. Therefore, future strategies should focus on improving the taste of low-Na food to promote a reduction in dietary Na intake.
Another strategy for dietary Na reduction at the population level is consumer education. A report analysed the Na content of popular processed foods in Hong Kong and found a vast difference in Na content within products from the same food categories(31). The variation in Na content amongst comparable products highlights the potential for reformulation by food manufacturers, as well as consumer education on the selection of products with lower Na content. Furthermore, health education in salt reduction should be conducted at an early age given that childhood is a key period for the development of dietary habits and the potential influence of child on the dietary habits of the whole family. In China, primary school children were educated as part of their usual health education lessons regarding the detrimental effects of salt on health and the methods to reduce salt intake. These children were empowered to educate the whole family, resulting in a reduction of salt intake as measured by 24-h urinary Na excretion by 1·9 g daily in children and 2·9 g daily in adults after approximately 3·5 months(Reference He, Wu and Feng32). This strategy may play a role in reducing Na intake in our target population, as it is common to have grandparents share the responsibilities of childcare in Chinese families(Reference Leung, Leung and Luk33).
In the regression model, we observed that higher intakes of seafood and nuts were associated with lower urinary Na excretion. A local study showed that fruit intake was negatively while the vegetable intake was positively associated with urinary Na excretion among postmenopausal women(Reference Liu, Ho and Tang11). A study in Japan showed that daily intake of soups in men aged <50 years old and daily intake of beans, soups or pickles in women aged ≥70 years old were associated with higher values of urinary Na excretion(Reference Seko, Odani and Wada34). The different findings were partly explained by the different dietary patterns among these study populations. Our finding of the inverse associations between intakes of seafood and nuts and urinary Na excretion may reflect a generally higher education level and health consciousness in our studied population and in turn a healthier dietary habit (e.g. lower Na intake).
The strengths of our study included the collection of the 24-h urine sample, which is the recommended method of assessing salt intake as it is not prone to reporting bias and errors in food and nutrient composition tables as compared with the dietary methods(Reference Brown, Tzoulaki and Candeias6,Reference Cogswell, Maalouf and Elliott35) . This was also the first local study to investigate Na intake and its contributory food sources in relatively healthy adults from mid-life and over. Several limitations of this study should be noted. Urinary Na was assessed by a single 24-h urine sample, which may not accurately reflect an individual’s usual salt intake due to the day-to-day variations in salt consumption and excretion(Reference Cogswell, Mugavero and Bowman36). Nonetheless, a single urine measurement is considered an accurate measure of Na intake at a population level(Reference Luft, Fineberg and Sloan37). Second, inference as to causality cannot be drawn due to the cross-sectional design of this study. Third, the relatively small sample size could have limited our study. Lastly, our study was conducted among apparently healthy Chinese adults who voluntarily registered for a 6-month intensive intervention. This population is likely to be more health conscious and more likely to adopt healthy lifestyle behaviours compared with the general population(10) and therefore our results cannot be extrapolated to the general target population or applicable to other countries with different dietary preferences.
In conclusion, the present study shows a suboptimal dietary Na intake among healthy Chinese adults aged 50 years and over in Hong Kong. Effective reduction of Na intake requires not only reducing condiments in food preparation but also strategies to reduce the Na content of major food sources of Na intake including cereals and their products and soups.
Acknowledgements
Acknowledgements: Not applicable. Financial support: This work was funded by the FrieslandCampina, Amersfoort, and the Netherlands. The funders had no role in the design, analysis or writing of this article. Conflict of interest: The authors declare that there is no conflict of interest. Authorship: R.S.M.C. and J.W. designed research; R.S.M.C., L.L. and J.W. conducted research; S.S.Y.Y., L.L and J.L. analysed data; S.S.Y.Y. and R.S.M.C. wrote the paper; S.S.Y.Y. had primary responsibility for final content. All authors read and approved the final manuscript. Ethics of human subject participation: This study was conducted according to the guidelines laid down in the Declaration of Helsinki, and all procedures involving research study participants were approved by the Clinical Research Ethics Committee of the Chinese University of Hong Kong (CREC reference no.: 2016.532). Written informed consent was obtained from all subjects.


