


The Supplemental Nutrition Assistance Program (SNAP) is the largest public programme to address food insecurity in the USA. SNAP is a means-tested federal programme that provides households with benefits accessed through an electronic debit card that can be used for food purchases. To be eligible, households must either have a gross income that is less than 130 % of the US poverty level (approximately $US 2500 per month for a family of four) or be categorically eligible (usually also requiring a gross income below 185 % of the poverty level) through participation in a state Temporary Assistance for Needy Families programme, General Assistance or the Supplemental Security Income programme. Although details of eligibility and programme administration differ across states, the programme’s basic structure and payment amounts are set at the federal level.
In 2014, SNAP provided nutrition support with a total value of $US 70 billion to 46·5 million Americans living in 22·7 million households. According to the US Department of Agriculture, from 2000 to 2009, SNAP benefits reduced the incidence of household poverty by 4·4 %, deep poverty by 13·2 % and child poverty by 15·5 %( Reference Tiehen, Jolliffe and Gunderson 1 ). Importantly for the present study, participation in SNAP for 6 months is associated with a 10 % reduction in food insecurity( Reference Mabli, Ohls and Dragoset 2 ). Additional evidence suggests that when the American Recovery and Reinvestment Act of 2009 increased the amount of SNAP benefits, households that received higher payments became more food secure( Reference Nord 3 , Reference Nord and Prell 4 ). More generally, while SNAP benefits increase household food expenditures, additional food expenditures do not fully exhaust the value of the benefits received; this suggests that SNAP benefits free up dollars for non-food expenditures( Reference Fox, Hamilton and Lin 5 – Reference Hoynes, McGranahan and Schanzenbach 8 ). However, this relationship depends strongly on the income level of a household( Reference Hoynes and Schanzenbach 7 , Reference Shaefer and Gutierrez 9 ).
Food insecurity is associated with a host of adverse health outcomes( Reference Gundersen and Ziliak 10 ). In particular, food insufficiency affects individuals’ ability to obtain a proper diet and nutrition( Reference Rose and Oliveira 11 – Reference Lyles, Wolf and Schillinger 14 ) and has also been found to increase rates of adult mental health problems( Reference Laraia, Siega-Riz and Gundersen 15 – Reference Heflin and Ziliak 17 ), obesity( Reference Townsend, Peerson and Love 18 , Reference Wilde and Peterman 19 ) and diabetes( Reference Lyles, Wolf and Schillinger 14 , Reference Nelson, Cunningham and Andersen 20 – Reference Berkowitz, Baggett and Wexler 24 ). While SNAP participation has been associated with an increase in dietary intake and improved health outcomes across a range of measures( Reference Gundersen and Ziliak 10 , Reference Bitler 25 ), to our knowledge, the present study is the first to examine direct health benefits associated with the size of the SNAP benefit.
Previous research has demonstrated that both food spending( Reference Castner and Henke 26 , Reference Hastings and Washington 27 ) and food intake( Reference Todd 28 – Reference Wilde and Ranney 30 ) decrease during the SNAP benefit month as benefits (distributed monthly) are exhausted. For instance, using the nationally representative National Health and Nutrition Examination Survey, Todd( Reference Todd 28 ) found that before April 2009 when SNAP benefits increased with the American Recovery and Reinvestment Act, the amount of energy consumed by SNAP participants declined by 25 % at the end of the month. With increased benefits, no monthly patterns in energy intake were apparent; that is, households appeared to smooth consumption over the month. However, the health consequences associated with the monthly fluctuations in nutrient intake are less clearly understood.
A small set of studies has investigated the relationship between SNAP participation, hospital visits and health-care costs generally for all participants( Reference Meyerhoefer and Pylypchuk 31 – Reference Gregory and Deb 34 ); however, only two( Reference Seligman, Bolger and Guzman 35 , Reference O’Grady, Ledneva and Conroy 36 ) have examined the potential role of the monthly food consumption cycle on the timing of disease treatment. Seligman et al. ( Reference Seligman, Bolger and Guzman 35 ) used hospital admission data to model admissions for hypoglycaemia, which is a condition highly sensitive to food consumption. Their results indicated that, among those living in low-income zip codes, hospital visits for hypoglycaemia increased by 27 % in the last week of the month compared with the first week with no corresponding increase observed among higher-income residents. However, that research was limited by a reliance on residence in a low-income zip code as a proxy for household poverty and implied SNAP receipt.
Using statewide, hospital-based clinics data, O’Grady et al.( Reference O’Grady, Ledneva and Conroy 36 ) examined the monthly timing of emergency room (ER) visits and hospitalizations due to hypoglycaemia. Similar to the study by Seligman et al., O’Grady et al.’s study found that patients receiving Medicaid or Medicare had a higher rate of inpatient hospital admissions in the third and fourth weeks of the month. Although ER visits increased in the last week of the month for those on Medicaid and a primary diagnosis of hypoglycaemia, the researchers observed no similar pattern among those with secondary diagnoses or other insurance-payer types.
In the present study we examine the relationship between within-month variation in health-care utilization, specifically ER claims for hypoglycaemia, and the timing and amount of observed SNAP benefit receipt in Missouri. Our study exploits Missouri’s unique variation in timing of SNAP benefit issuance. SNAP benefits are disbursed over 22d of the month, which provides a random source of variation in SNAP timing that is unique in the USA. Thus, the study is consistent with the research trend towards examining the benefits of SNAP with high-quality research designs and provides a substantial contribution to the scant literature on SNAP benefit size and health outcomes through its novel use of administrative data and Missouri’s SNAP issuance policy. These data allow us to improve on previous studies( Reference Seligman, Bolger and Guzman 35 , Reference O’Grady, Ledneva and Conroy 36 ) by (i) limiting our analysis to households receiving SNAP and (ii) specifying SNAP issuance date, to separate the effects of the SNAP benefit cycle from the monthly pay cycle in ER treatment for the nutrition-related condition of hypoglycaemia.
Methods
Data
We used SNAP data from the Family Support Division of the Missouri Department of Social Services for the period January 2010 to December 2013, linked to Medicaid claims data for ER visits during that same time period. Unlike previous studies, which did not have direct information regarding reported SNAP benefit receipt and, instead, relied upon the average income level of the zip code of residence, our state administrative data contain direct measures of SNAP benefit level.
From January 2010 to December 2013 in Missouri, a total of 8 007 761 Medicaid claims were submitted for emergency care for 405 392 individuals living in households receiving SNAP benefits. Of these, 6 760 579 claims were submitted by individuals who had received SNAP within the prior 30 d. We determined that 3·7 % of these claims were submitted during a period when the individual had received an expedited SNAP benefit payment on an emergency basis (i.e. not conforming to Missouri’s SNAP benefit issuance schedule); as such, we excluded these claims from our sample. Thus, our final sample contained 6 502 061 ER claims for 362 101 individuals receiving SNAP (Supplemental Fig. 1). Descriptive statistics for the sample are presented in Supplemental Table 1 (see online supplementary material).
We used diagnosis codes from the WHO International Classification of Diseases, ninth revision, to indicate ER care due to hypoglycaemia following the protocol established and validated by Ginde et al. ( Reference Ginde, Blanc and Lieberman 37 ), a multicentre retrospective cohort study that used medical records. This protocol has a 89 % positive predictive value for detecting hypoglycaemia. We examined hypoglycaemia, a dangerous condition requiring medical attention, because low food intake can cause low blood sugar among those with diabetes, a condition held by 9·3 % of the US population( 38 ). In fact, previous research has demonstrated that food insecurity increases the odds of severe hypoglycaemia and interferes with effective diabetes management( Reference Seligman, Jacobs and López 22 , Reference Seligman and Schillinger 23 , Reference Seligman, Jacobs and Lopez 39 ).
Many cases of hypoglycaemia are treated in the ER and do not result in hospital admission, which is why we examined ER cases v. hospital admissions. We identified 24 231 ER claims with a hypoglycaemia diagnosis; out of every 100 000 ER claims submitted to Medicaid, 373 included a hypoglycaemia diagnosis. The majority of our identified cases (76·5 %) received a primary diagnosis of hypoglycaemia or diabetes with other specific manifestations; the remaining 23·5 % received a secondary diagnosis of hypoglycaemia.
Given that calendar months vary by number of days, we created a standard 28d month in order to conduct our analysis of the timing of ER claims. For each month, we allocated the first 14d to Weeks 1 and 2 and the last 14d to Weeks 3 and 4. We then allocated any remaining days to the end of Week 2 and the beginning of Week 3.
The SNAP benefit month is defined as the number of days between the date of the SNAP benefit receipt prior to the ER visit and the same date in the following month. To conduct analysis by the SNAP benefit month, we standardized the SNAP benefit month to a 28d month using the method as described for calendar months.
We selected detailed information from the SNAP administrative records regarding sex (male or female), age in years (18–39, 40–59, 60–79, or 80 or older), race (White, Black/African American, American Indian/Alaskan Native, Asian, Native Hawaiian/Pacific Islander, multiracial or unknown), Hispanic ethnicity (dummy variable) and household size (one, two, three, four or more, or unknown). To control for policy and economic changes over the time period, we also included dummy variables for the calendar year.
Missouri has a lower proportion of Hispanic residents than the national average; African American representation is close to the national average. Median household income in Missouri is about 5 % below that for the nation as a whole. Like the national caseload, Missouri’s Medicaid population – those of low income status and those not yet eligible for Medicare – is disproportionately female, African American and prime-aged (see Supplemental Table 1).
Analysis
We plotted the daily rate of ER visits due to hypoglycaemia per 100 000 ER claims by both calendar month and SNAP benefit month. Using a probit model, we estimated the probability of submitting a claim for hypoglycaemia as a function of the week and individual demographic characteristics selected from the administrative data (i.e. sex, race, Hispanic ethnicity, age, household size and calendar year). In these models, we interpret marginal effects as the mean change in the probability of submitting an ER claim for hypoglycaemia associated with a one-unit change (or discrete change for binary variables) in the independent variable.
For ease of interpreting results across models, we present marginal effects for ER claims for hypoglycaemia in Weeks 2 to 4, using Week 1 as the reference period and holding all covariates at their means. If the pay cycle is an important determinant of hypoglycaemia claims in the ER, we would expect to see claims increase towards the end of the calendar month. However, if Missouri’s 22d disbursement period smooths consumption over the pay cycle by providing a dedicated source of funds for food purchases at a time of the calendar month when other household financial resources are exhausted, we might see no variation by calendar month. Instead, we might observe a SNAP benefit cycle to hypoglycaemia claims. Therefore, we examine the timing of ER visits relative to both the calendar month and the SNAP benefit month.
We expect that the importance of SNAP benefits to the household food supply should be a function of both timing and size of the SNAP benefit. Larger SNAP benefits are more likely to be effective in supporting food consumption than smaller benefits in a dose–response framework, as shown by Nord and Prell( Reference Nord and Prell 4 ) for food insecurity. In order to explore the possible relationship between the size of SNAP benefits and the timing of ER claims for hypoglycaemia, we estimated probit models interacting the week of the calendar month and the size of the SNAP benefit while controlling for the full set of covariates indicated above. Finally, we present marginal effects from probit models of the effect of SNAP benefit size on ER visits for hypoglycaemia while controlling for sex, race, Hispanic ethnicity, age, household size and calendar year.
Results
Timing of SNAP benefits
In Fig. 1 we present the daily and weekly rate of ER visits due to hypoglycaemia by both the calendar month and the SNAP benefit month for the total sample. We use a 3 d moving average to smooth out some of the daily noise due to small sample size. In the aggregate, we find that both the daily and weekly patterns for calendar month and benefit month track closely and are virtually indistinguishable over the month, showing no systematic pattern of variation. That is, these results suggest no evidence of either a monthly pay cycle or a monthly SNAP benefit cycle to ER claims for hypoglycaemia in our Missouri Medicaid sample.

Fig. 1 Weekly and daily rates of emergency room (ER) visits for hypoglycaemia among individuals receiving Supplemental Nutrition Assistance Program (SNAP) benefits, January 2010 to December 2013†: ![]() , week of calendar month;
, week of calendar month; ![]() , day of calendar month;
, day of calendar month; ![]() , week of SNAP benefit month;
, week of SNAP benefit month; ![]() , day of SNAP benefit month. †Authors’ analysis of data from the Missouri Department of Social Services, linked to Medicaid claims data for ER visits during that same time period (6 502 061 ER claims for 362 101 individuals receiving SNAP), with daily rate reported as a 3d moving average
, day of SNAP benefit month. †Authors’ analysis of data from the Missouri Department of Social Services, linked to Medicaid claims data for ER visits during that same time period (6 502 061 ER claims for 362 101 individuals receiving SNAP), with daily rate reported as a 3d moving average
In order to control for demographic covariates that might be correlated with the timing of ER visits, however, we present findings for our estimates of the probability that a SNAP household has an ER claim for hypoglycaemia as a function of the week of the calendar month and basic demographic characteristics (sex, race, Hispanic ethnicity, age, household size and calendar year) in the second and third columns of Table 1. We find no evidence of a monthly pattern in ER visits due to hypoglycaemia in the full sample, which contradicts the findings of O’Grady et al. ( Reference O’Grady, Ledneva and Conroy 36 ) and Seligman et al. ( Reference Seligman, Bolger and Guzman 35 ). We similarly find no evidence for a SNAP benefit month cycle in ER claims for hypoglycaemia in the fourth and fifth columns of Table 1. We also estimated models where we controlled for both calendar month and SNAP month and found no statistically significant results. Given Missouri’s 22d disbursement period, this finding is consistent with an interpretation that having SNAP benefits spread over the month better allows a large portion of households to smooth their food consumption, avoiding statewide peaks and troughs at a population level in the distribution of ER visits due to hypoglycaemia.
Table 1 Marginal effects of calendar month and Supplemental Nutrition Assistance Program (SNAP) benefit month on emergency room (ER) visits for hypoglycaemia among individuals receiving SNAP, January 2010 to December 2013Footnote †
† Authors’ analysis of data from the Missouri Department of Social Services, linked to Medicaid claims data for ER visits during that same time period (6 502 061 ER claims for 362 101 individuals receiving SNAP), with results (mean marginal effects and robust standard errors) from probit regression models controlling for sex, race, ethnicity, age and year of ER visit.
‡ Reference category.
Generosity of SNAP benefits
We find no clear evidence of a monthly pattern to ER claims for hypoglycaemia at any level of SNAP benefit. Figure 2 depicts the interaction between the week of the calendar month and the size of monthly SNAP benefit based on regression results. Each week of the month follows a similar pattern: as the monthly SNAP benefit amount increases, the probability of submitting an ER claim for hypoglycaemia decreases. However, the differences between calendar weeks are not statistically significant. We found (but do not show) similar results for the SNAP benefit month.
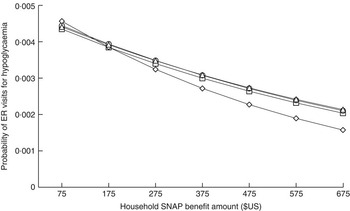
Fig. 2 Emergency room (ER) visits for hypoglycaemia by calendar week and Supplemental Nutrition Assistance Program (SNAP) benefit amount among individuals receiving SNAP, January 2010 to December 2013†: ![]() , Week 1;
, Week 1; ![]() , Week 2;
, Week 2; ![]() , Week 3;
, Week 3; ![]() , Week 4. †Authors’ analysis of data from the Missouri Department of Social Services, linked to Medicaid claims data for ER visits during that same time period (6 502 061 ER claims for 362 101 individuals receiving SNAP), with predicated probabilities estimated from probit regression models controlling for sex, race, ethnicity, age and year of ER visit
, Week 4. †Authors’ analysis of data from the Missouri Department of Social Services, linked to Medicaid claims data for ER visits during that same time period (6 502 061 ER claims for 362 101 individuals receiving SNAP), with predicated probabilities estimated from probit regression models controlling for sex, race, ethnicity, age and year of ER visit
We then investigated the risk of an ER claim for hypoglycaemia as a function of the SNAP benefit size, no longer focusing on the timing of benefit receipt. The coefficient for the size of SNAP benefits from this probit model is negative and statistically significant. The mean marginal effect of the SNAP benefit amount on ER visits for hypoglycaemia is –0·000005, meaning a $US 50 increase in monthly SNAP benefit would reduce the probability of an individual ER claim for hypoglycaemia by 0·00025 and a $US 100 increase in monthly SNAP benefits would reduce the likelihood of a claim by 0·0005. Stated differently, a $US 50 increase in monthly SNAP benefits would reduce the average number of hypoglycaemia claims per 100 000 ER claims by 25 and a $US 100 increase in monthly SNAP benefits would reduce the number of claims by 50 – amounting to a 12–15 % reduction in the number of ER visits for hypoglycaemia.
Table 2 presents the dose–response relationship for different values of SNAP benefits (holding all other characteristics at their mean values). The effect of SNAP benefit size on ER visits for hypoglycaemia is clearly negative and substantial, suggesting that each unit increase in SNAP benefits is associated with a reduction in the probability of being treated in the ER for hypoglycaemia across the full distribution of SNAP benefit payment amounts. The magnitude of the marginal return to an additional dollar of SNAP benefits is larger at the bottom of the SNAP benefit spectrum (when SNAP benefits total $US 75 per month) than at the top (with payment amounts up to $US 675 per month). A $US 100 increase in SNAP benefits from $US 75 to $US 175 decreases the likelihood of ER visits for hypoglycaemia by about 60 per 100 000 ER claims, while a $US 100 increase in benefits from $US 575 to $US 675 reduces the likelihood of ER visits for hypoglycaemia by about 30. Considering the average of ER visits for hypoglycaemia is 373 per 100 000 ER claims overall, the magnitude of this impact is substantial.
Table 2 Marginal effects of Supplemental Nutrition Assistance Program (SNAP) benefit amount on emergency room (ER) visits for hypoglycaemia among individuals receiving SNAP, January 2010 to December 2013Footnote †
***P<0·001.
† Authors’ analysis of data from Missouri Department of Social Services, linked to Medicaid claims data for ER visits during that same time period (6 502 061 ER claims for 362 101 individuals receiving SNAP), with results (mean marginal effects and robust standard errors) from probit regression models controlling for sex, race, Hispanic ethnicity, age, household size and year of ER visit.
‡ Mean predicted change in probability of ER visit for hypoglycaemia per $US 1·00 in SNAP benefit amount.
§ Continuous measure of SNAP benefit amount.
Sensitivity analysis
We also looked directly at per capita benefits (i.e. benefits/household size) as well as the return to the magnitude of the SNAP benefit separately by household size (i.e. one, two, three, or four or more members). Results (available from the authors by request) consistently show a dose–response relationship between the size of the SNAP benefit and ER visits for hypoglycaemia for each household size. Finally, we split the sample by individual age into the four age groups shown in Supplemental Table 1. We found no evidence of benefit timing effects for any age group.
Discussion
Using linked administrative data on a sample of SNAP recipients, we examined 6·5 million claims for ER visits between 2010 and 2013. Consistent with Todd’s prior analysis of the nationally representative National Health and Nutrition Examination Survey( Reference Todd 28 ), our analysis found no evidence of a SNAP benefit cycle or monthly cycle within household-level ER claims for hypoglycaemia. However, our findings suggest that ER claims for hypoglycaemia are in fact related to the size of the SNAP benefit. Households receiving high SNAP benefits are expected to have lower levels of household income and greater expenses than households receiving low SNAP benefits; as such, these households are also likely to differ on unobserved factors correlated with health disadvantage, which provides a downward bias to our results. Our results suggest that SNAP benefits compensate for such negative selection and provide important health benefits for those susceptible to hypoglycaemia. Hoynes et al.( Reference Hoynes, McGranahan and Schanzenbach 8 ) report that approximately one-fifth of SNAP-eligible households receive SNAP benefits that exceed their preferred food expenditures, which implies the possibility that SNAP receipt could increase food consumption more than a simple cash grant for this group. If hypoglycaemia is particularly likely for such households, increased food consumption due to SNAP may explain the lower rates of ER visits for hypoglycaemia.
Study limitations
One significant limitation of the current work is that, during the observation period, Missouri had very stringent income requirements for adults to qualify for Medicaid: in most cases, household income had to be below 33 % of the poverty line. Our very-low-income sample is likely sensitive to small fluctuations in income from any source and, as a consequence, our results may not reflect the effect of SNAP on the risk of ER visits for hypoglycaemia across the full range of SNAP recipients in Missouri or other states. Additionally, we have only analysed ER claims for hypoglycaemia. Health complications that result in medical treatment provided in other settings or that are not serious enough to require medical care are not captured by this analysis. Finally, the study used variation in SNAP payments observed in the population, making it non-experimental. There may well be unobserved differences by SNAP receipt and so inferences regarding the causal impacts of SNAP benefits should be treated with caution.
Conclusions and future research
There are many interesting implications of the present study for policy and future research. In terms of public policy, our results suggest that more generous SNAP benefits are beneficial in helping low-income Missourians manage their household budgets to avoid nutritional fluctuations in the quality and quantity of food that might result in low blood sugar severe enough to require treatment at the ER for hypoglycaemia. The beneficial effects of SNAP payments in reducing the incidence of treatment for hypoglycaemia has cost implications that should be examined in future work. According to one 2003 estimate, the average medical costs associated with a single episode of hypoglycaemia requiring medical treatment was $US 1186( Reference Heaton, Martin and Brelje 40 ). A benefit–cost analysis of the returns of higher SNAP benefits in terms of foregone medical care might provide policy makers important information when considering reauthorization of the Farm Bill, which provides funding for SNAP.
Future research will be needed to reconcile the lack of relationship found between the timing of ER claims for hypoglycaemia found here and the earlier findings of Seligman et al.( Reference Seligman, Bolger and Guzman 35 ) and O’Grady et al. ( Reference O’Grady, Ledneva and Conroy 36 ). It is unclear if the disparate findings are due to differences in the outcomes examined (i.e. ER claims v. hospital admissions), the means of identifying the low-income population (i.e. linkages with SNAP data v. zip code or health insurance provider), the sample (i.e. Missouri Medicaid administrative data v. California and New York hospital records), the timing of SNAP benefits issuance (i.e. across 22d in Missouri v. 9d in California and 14d in New York), or the 2009 increase in SNAP benefit amounts as a result of the American Recovery and Reinvestment Act (Seligman et al. ( Reference Seligman, Bolger and Guzman 35 ) used data from 2000 to 2008). Each of these possible explanations suggests a different social process through which SNAP benefits may be supportive to low-income households in providing a stable and nutritious food supply. For example, if there is evidence that issuing SNAP benefits at different times of the month is beneficial for households, states could change their schedule as a matter of administrative practice.
Finally, the relationship between timing and amount of SNAP benefits and other health outcomes that might be sensitive to daily fluctuations in food and nutrient intake should be examined as well. It is well understood that diet is critical in supporting individual health. Yet, we know surprisingly little about how federal food and nutrition programmes support health, let alone the extent to which administrative practices such as benefit issuance schedules might alter the effectiveness of these programmes for the average recipient.
Acknowledgements
Acknowledgements: The authors wish to acknowledge the helpful comments received during presentations at the Truman School of Public Policy and CIQLE/Yale Sociology. Financial support: This work was supported by the US Department of Agriculture, Economic Research Service (grant number #58-4000-4-0018). The US Department of Agriculture had no role in the design, analysis or writing of this article. Conflict of interest: None. Authorship: C.H. took primary responsibility for formulating the research question, study design and writing the article. L.H. took primary responsibility for data analysis. P.M. assisted with study design, data analysis and writing. Ethics of human subject participation: Not applicable.
Supplementary material
To view supplementary material for this article, please visit https://doi.org/10.1017/S1368980016003153


