


China’s Belt and Road Initiative (BRI) extends beyond geographical and political boundaries to enhance connections between countries in Asia, Europe and Africa(Reference Tambo, Khayeka-Wandabwa and Muchiri1). While BRI countries share huge economic opportunities and potential, they also share some common publish health threats, such as obesity and related disease burdens(Reference Tang, Li and Li2,3) .
Obesity, a condition influenced by genetics, environment and lifestyle factors, significantly elevates the risk of chronic diseases, including type 2 diabetes, heart diseases, certain cancers, and bone and joint disorders(Reference Piché, Tchernof and Després4–Reference Wearing, Hennig and Byrne6). High BMI (hBMI), defined as a BMI greater than 25 kg/m2 (which signifies overweight and obesity), has rapidly emerged as a global health crisis over the past few decades(Reference Blüher7). This global health challenge extends across borders, impacting populations worldwide.
Worldwide studies have highlighted the link between hBMI and higher rates of sickness and death(Reference Abdelaal, le Roux and Docherty8,Reference Kivimäki, Strandberg and Pentti9) . In BRI countries, an alarming increase in obesity rates is seen, influenced by diverse cultural, dietary and socio-economic landscapes(Reference Blüher7,Reference Jia and Wang10) . Moreover, the simultaneous occurrence of undernutrition and obesity, known as the ‘double burden of malnutrition’, presents a unique challenge in these regions(Reference Popkin, Corvalan and Grummer-Strawn11). This paradox highlights the multifaceted nature of nutritional issues faced by BRI countries.
While considering the intricate relationship between hBMI and disease burden in BRI countries, this study sought to analyse the disease burden attributable to hBMI (DB-hBMI) in BRI countries from 1990 to 2019. Knowledge of these dynamics is crucial for public health policymakers, healthcare providers and researchers, as it could inform evidence-based interventions and policies to mitigate health risks associated with obesity.
Methods
Data sources and definitions
This study was conducted using Global Burden of Disease 2019 (GBD 2019) study data obtained from the Institute for Health Metrics and Evaluation (IHME) website. All data for this study were obtained from the IHME website (https://www.healthdata.org/data-tools-practices/data-sources). The detailed methodology has been published elsewhere(12,13) .
Mortality, years lived with disability (YLD), years of life lost (YLL) and disability-adjusted life years (DALY) were recorded in this study. Age-standardised rates for mortality, YLD, YLL and DALY were calculated according to global age structure from 2019. The age-standardised rates were corrected by direct method and the world standard population in order to account for differences in population age structure. Our study followed the Guidelines for Accurate and Transparent Health Estimates Reporting (GATHER) to ensure its transparency and replicability (online Supplementary Table S1).
Our study focused on the BRI region with sixty-six participating member states, as detailed elsewhere(Reference Zhang, Luo and Yi14). The selection of BRI countries aligns with the GBD’s categorisation of global regions and international political and economic organisations. Additionally, we adopted two other key regional concepts: the World Bank region and the Socio-demographic Index (SDI) region. The SDI, developed in 2015, provides a comprehensive measure of a country or region’s development status by considering socio-economic factors. This index addresses the limitations of other indicators that solely reflect economic and developmental disparities among countries(Reference Andersen15). The World Bank classifies global economies into four income groups: low, lower middle, upper middle and high. Typically, low- and middle-income countries are considered developing, while high-income countries are classified as developed(16).
Statistical analysis
To quantify the DB-hBMI, we calculated age-standardised mortality, YLD, YLL and DALY for the BRI countries, stratified by gender, age and disease categories. Age-standardised estimates were adjusted to account for variations in the age distribution of populations, enabling meaningful comparisons across member states. We categorised age using three age groups: 15–49 years, 50–74 years and ≥ 75 years. Results of mortality, YLD, YLL and DALY are presented in absolute numbers and age-standardised rates per 100 000 population, along with their respective 95 % uncertainty intervals (UI)(Reference Roth, Mensah and Johnson17).
To assess trends in DB-hBMI from 1990 to 2019, we employed the average annual percentage change (AAPC), determined using the Joinpoint Regression Program (version 4.0.4, released May, 2013)(Reference Clegg, Hankey and Tiwari18). Each estimated metric was accompanied by a 95 % CI, providing a measure of statistical uncertainty. Statistical significance was defined as P < 0·05(19).
Results
The absolute numbers of age-standardised mortality, YLD, YLL and DALY in 2019 attributed to hBMI within BRI countries are presented in Table 1. In 2019, China reported 764 698·05 cases (95 % UI: 333 163·43, 1 310 557·19) of deaths and 24·83 million cases (95 % UI: 11·79, 40·55) of DALY attributed to hBMI.
Table 1 The absolute number of mortalities, YLD, YLL and DALY attributed to hBMI in the BRI countries in 2019 (Numbers and 95 % uncertainty intervals)
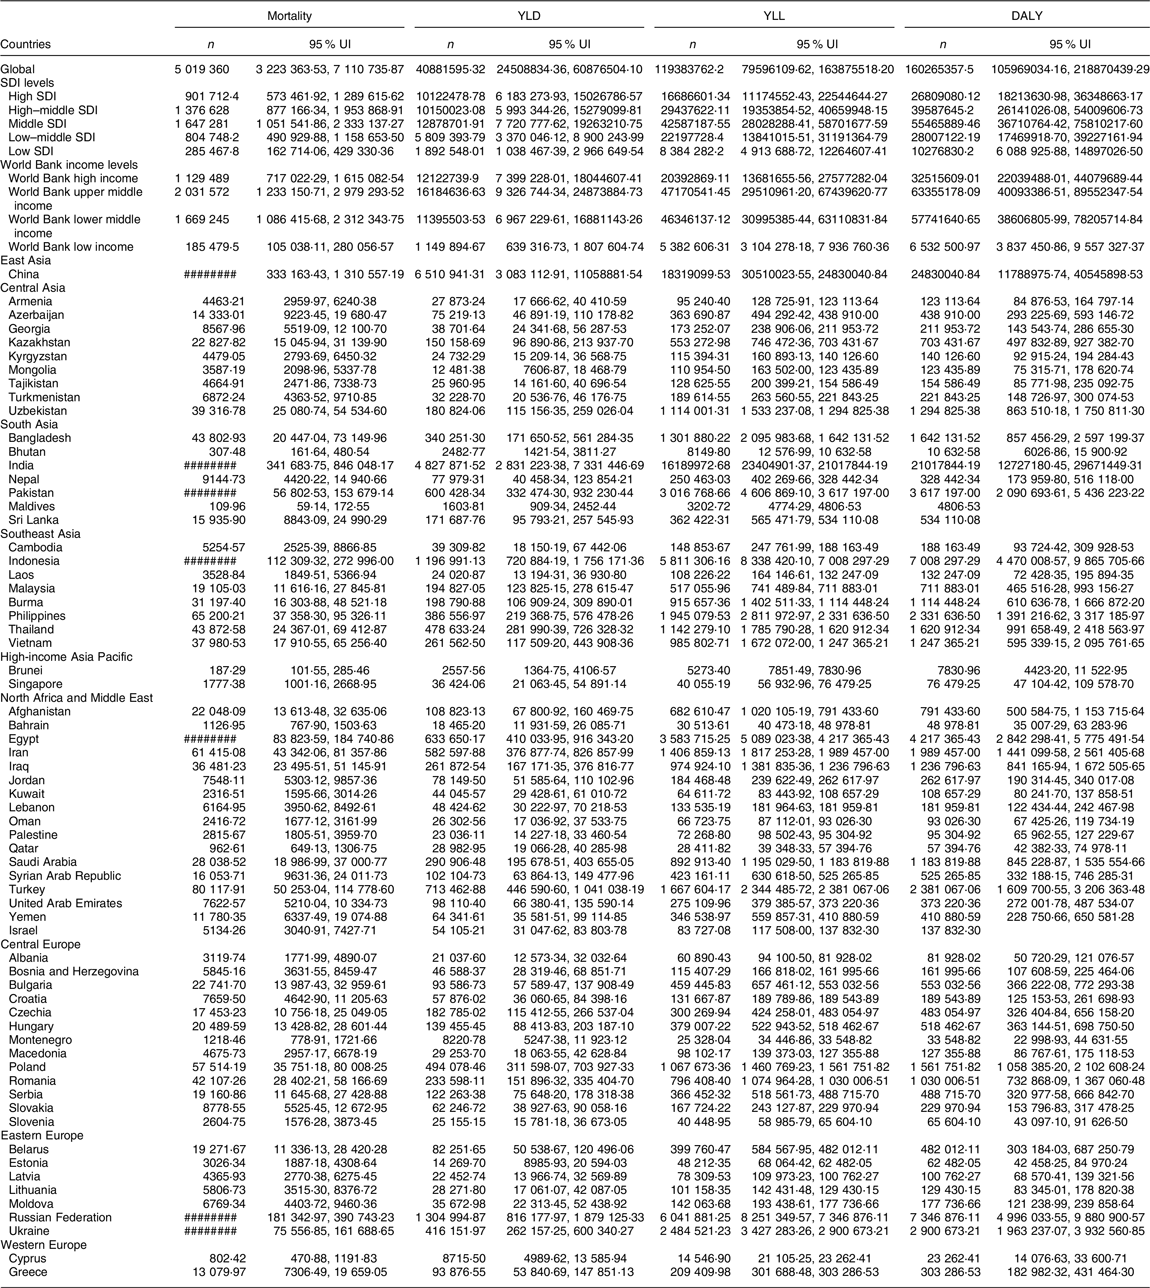
YLD, years lived with disability; YLL, years of life lost; DALY, disability-adjusted life years; hBMI, high BMI; BRI, Belt and Road Initiative; UI, uncertainty interval; SDI, Socio-demographic Index.
As for SDI levels, the regions with the highest mortality rates attributed to hBMI were the high SDI regions and the low SDI regions, with 901 712·38 (95 % UI: 573 461·92, 1 289 615·62) and 285 467·84 cases (95 % UI: 162 714·06, 429 330·36), respectively, while the country with the highest DALY was in the middle SDI region, at 55·46 million cases (95 % UI: 36·11, 75·81).
Interestingly, significant geographic disparities were observed in the mortality and DALY attributed to hBMI across member countries. In 2019, the three countries with the highest mortality and DALY attributed to hBMI were China, India and the Russian Federation. Based on DALY, the top three countries in Central Asia with the highest burden attributed to hBMI were Uzbekistan, Kazakhstan and Azerbaijan. In Central Europe, Poland, Romania and Bulgaria ranked highest. In Eastern Europe, the countries with the highest DALY were the Russian Federation, Ukraine and Belarus. In North Africa and the Middle East, Egypt, Turkey and Iran exhibited the highest DALY. Finally, in Southeast Asia, the leading countries were Indonesia, the Philippines and Thailand.
Figure 1 shows the age-standardised mortality, YLD, YLL and DALY attributed to hBMI in BRI countries during 1990 and 2019. In 1990, regions with higher mortality, YLD, YLL and DALY attributed to hBMI were primarily concentrated in North Africa and the Middle East and Central Europe. In BRI countries, countries in North Africa and Middle East with the highest DALY attributed to hBMI were the United Arab Emirates (5877·80 per 100 000 population), Qatar (5514·94 per 100 000 population) and Iraq (5512·65 per 100 000 population). Conversely, the lowest DALY were reported by the United Arab Emirates (5877·80 per 100 000 population), Qatar (5514·94 per 100 000 population) and Iraq (5512·65 per 100 000 population) in Asia. In 2019, compared to 1990, most member countries of the BRI experienced either stable or increased DALY attributed to hBMI. Notably, higher rates were still concentrated in North Africa, the Middle East, Central Europe and Central Asia. For more detailed information, refer to online Supplementary Table S2.
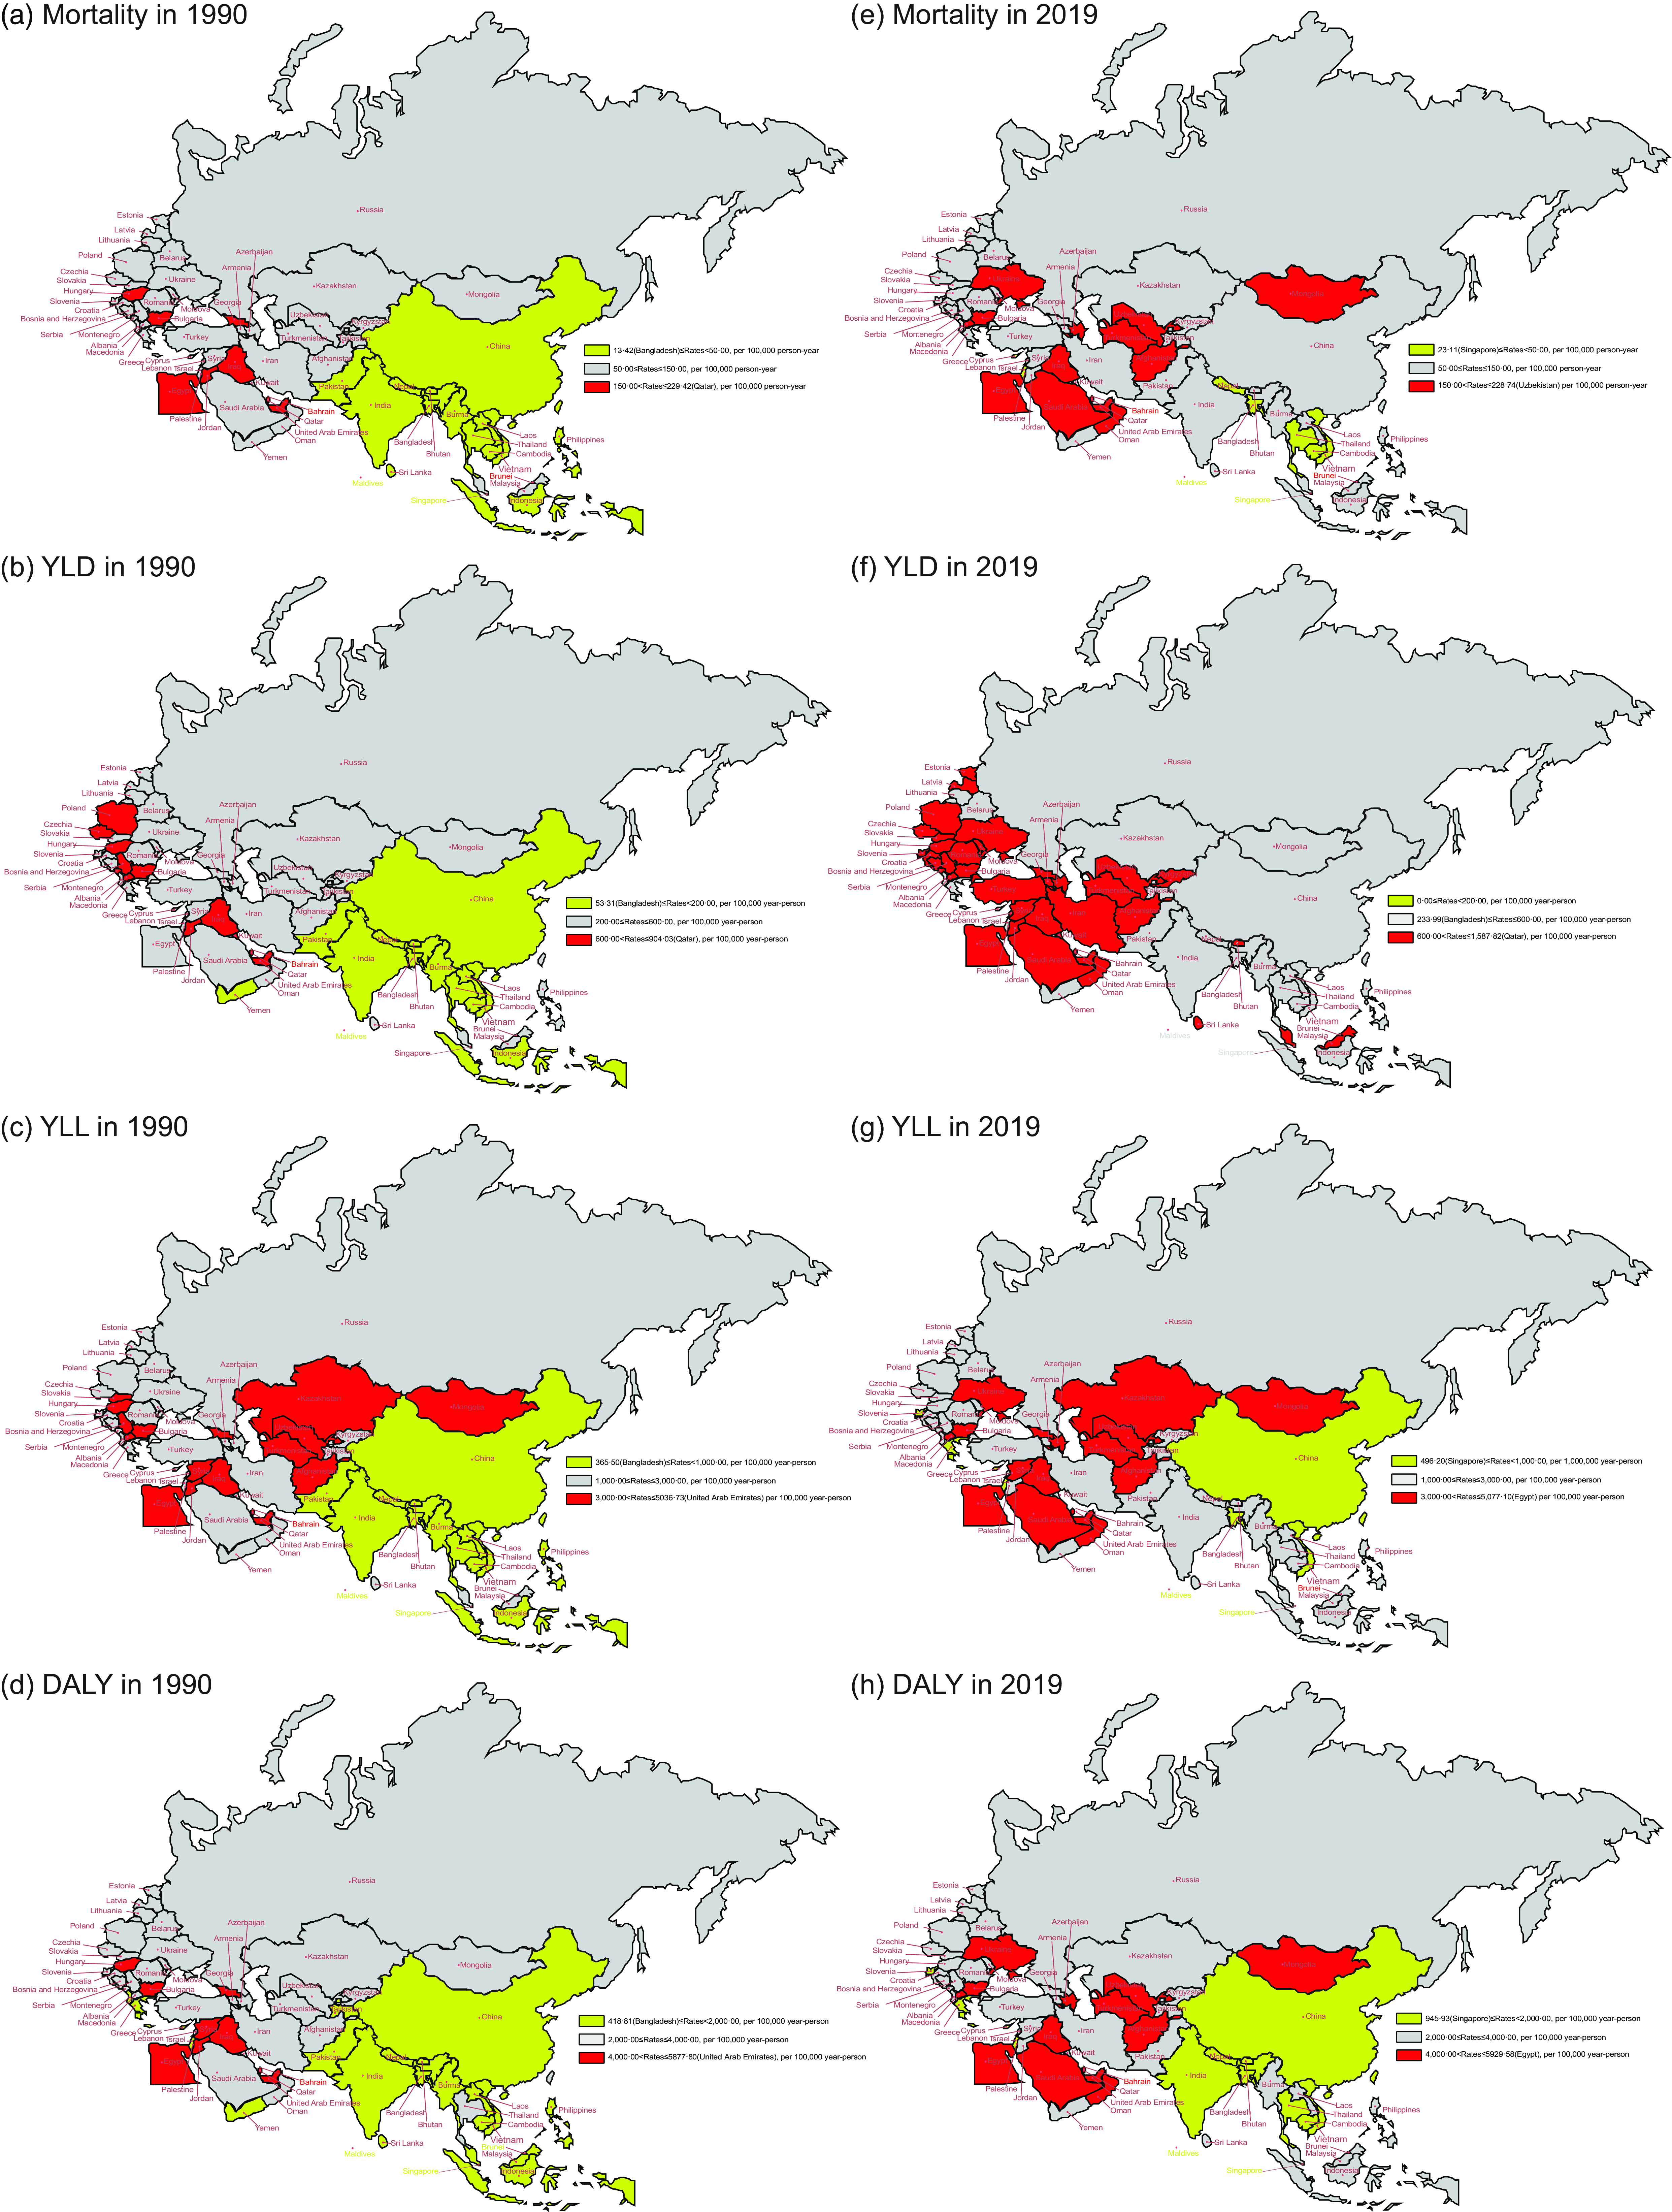
Fig. 1 Age-standardised mortality, YLD, YLL and DALY attributed to hBMI for BRI countries in 1990 and 2019. (a) Age-standardised mortality in 1990. (b) Age-standardised YLD in 1990. (c) Age-standardised YLL in 1990. (d) Age-standardised DALY in 1990. (e) Age-standardised mortality in 2019. (f) Age-standardised YLD in 2019. (g) Age-standardised YLL in 2019. (h) Age-standardised DALY in 2019. YLD, years lived with disability; YLL, years of life lost; DALY, disability-adjusted life years; BRI, Belt and Road Initiative
Figure 2 illustrates the temporal trends of age-standardised mortality and DALY attributed to hBMI in BRI countries from 1990 to 2019 and 2010 to 2019. Between 1990 and 2019, there were distinctive trends in age-standardised mortality and DALY attributed to hBMI observed among the BRI countries. Notably, Southeast Asian and South Asian nations generally exhibited an upward trajectory in both mortality and DALY, whereas most European countries experienced a significant decline. In particular, South Asian countries, including Bangladesh and Nepal, along with the Southeast Asian nation Vietnam, demonstrated the most significant increases in DALY, with AAPC values of 4·42 % (95 % CI: 4·00 %, 4·83 %), 4·19 % (95 % CI: 3·97 %, 4·41 %) and 4·28 % (95 % CI: 3·92 %, 4·64 %), respectively.
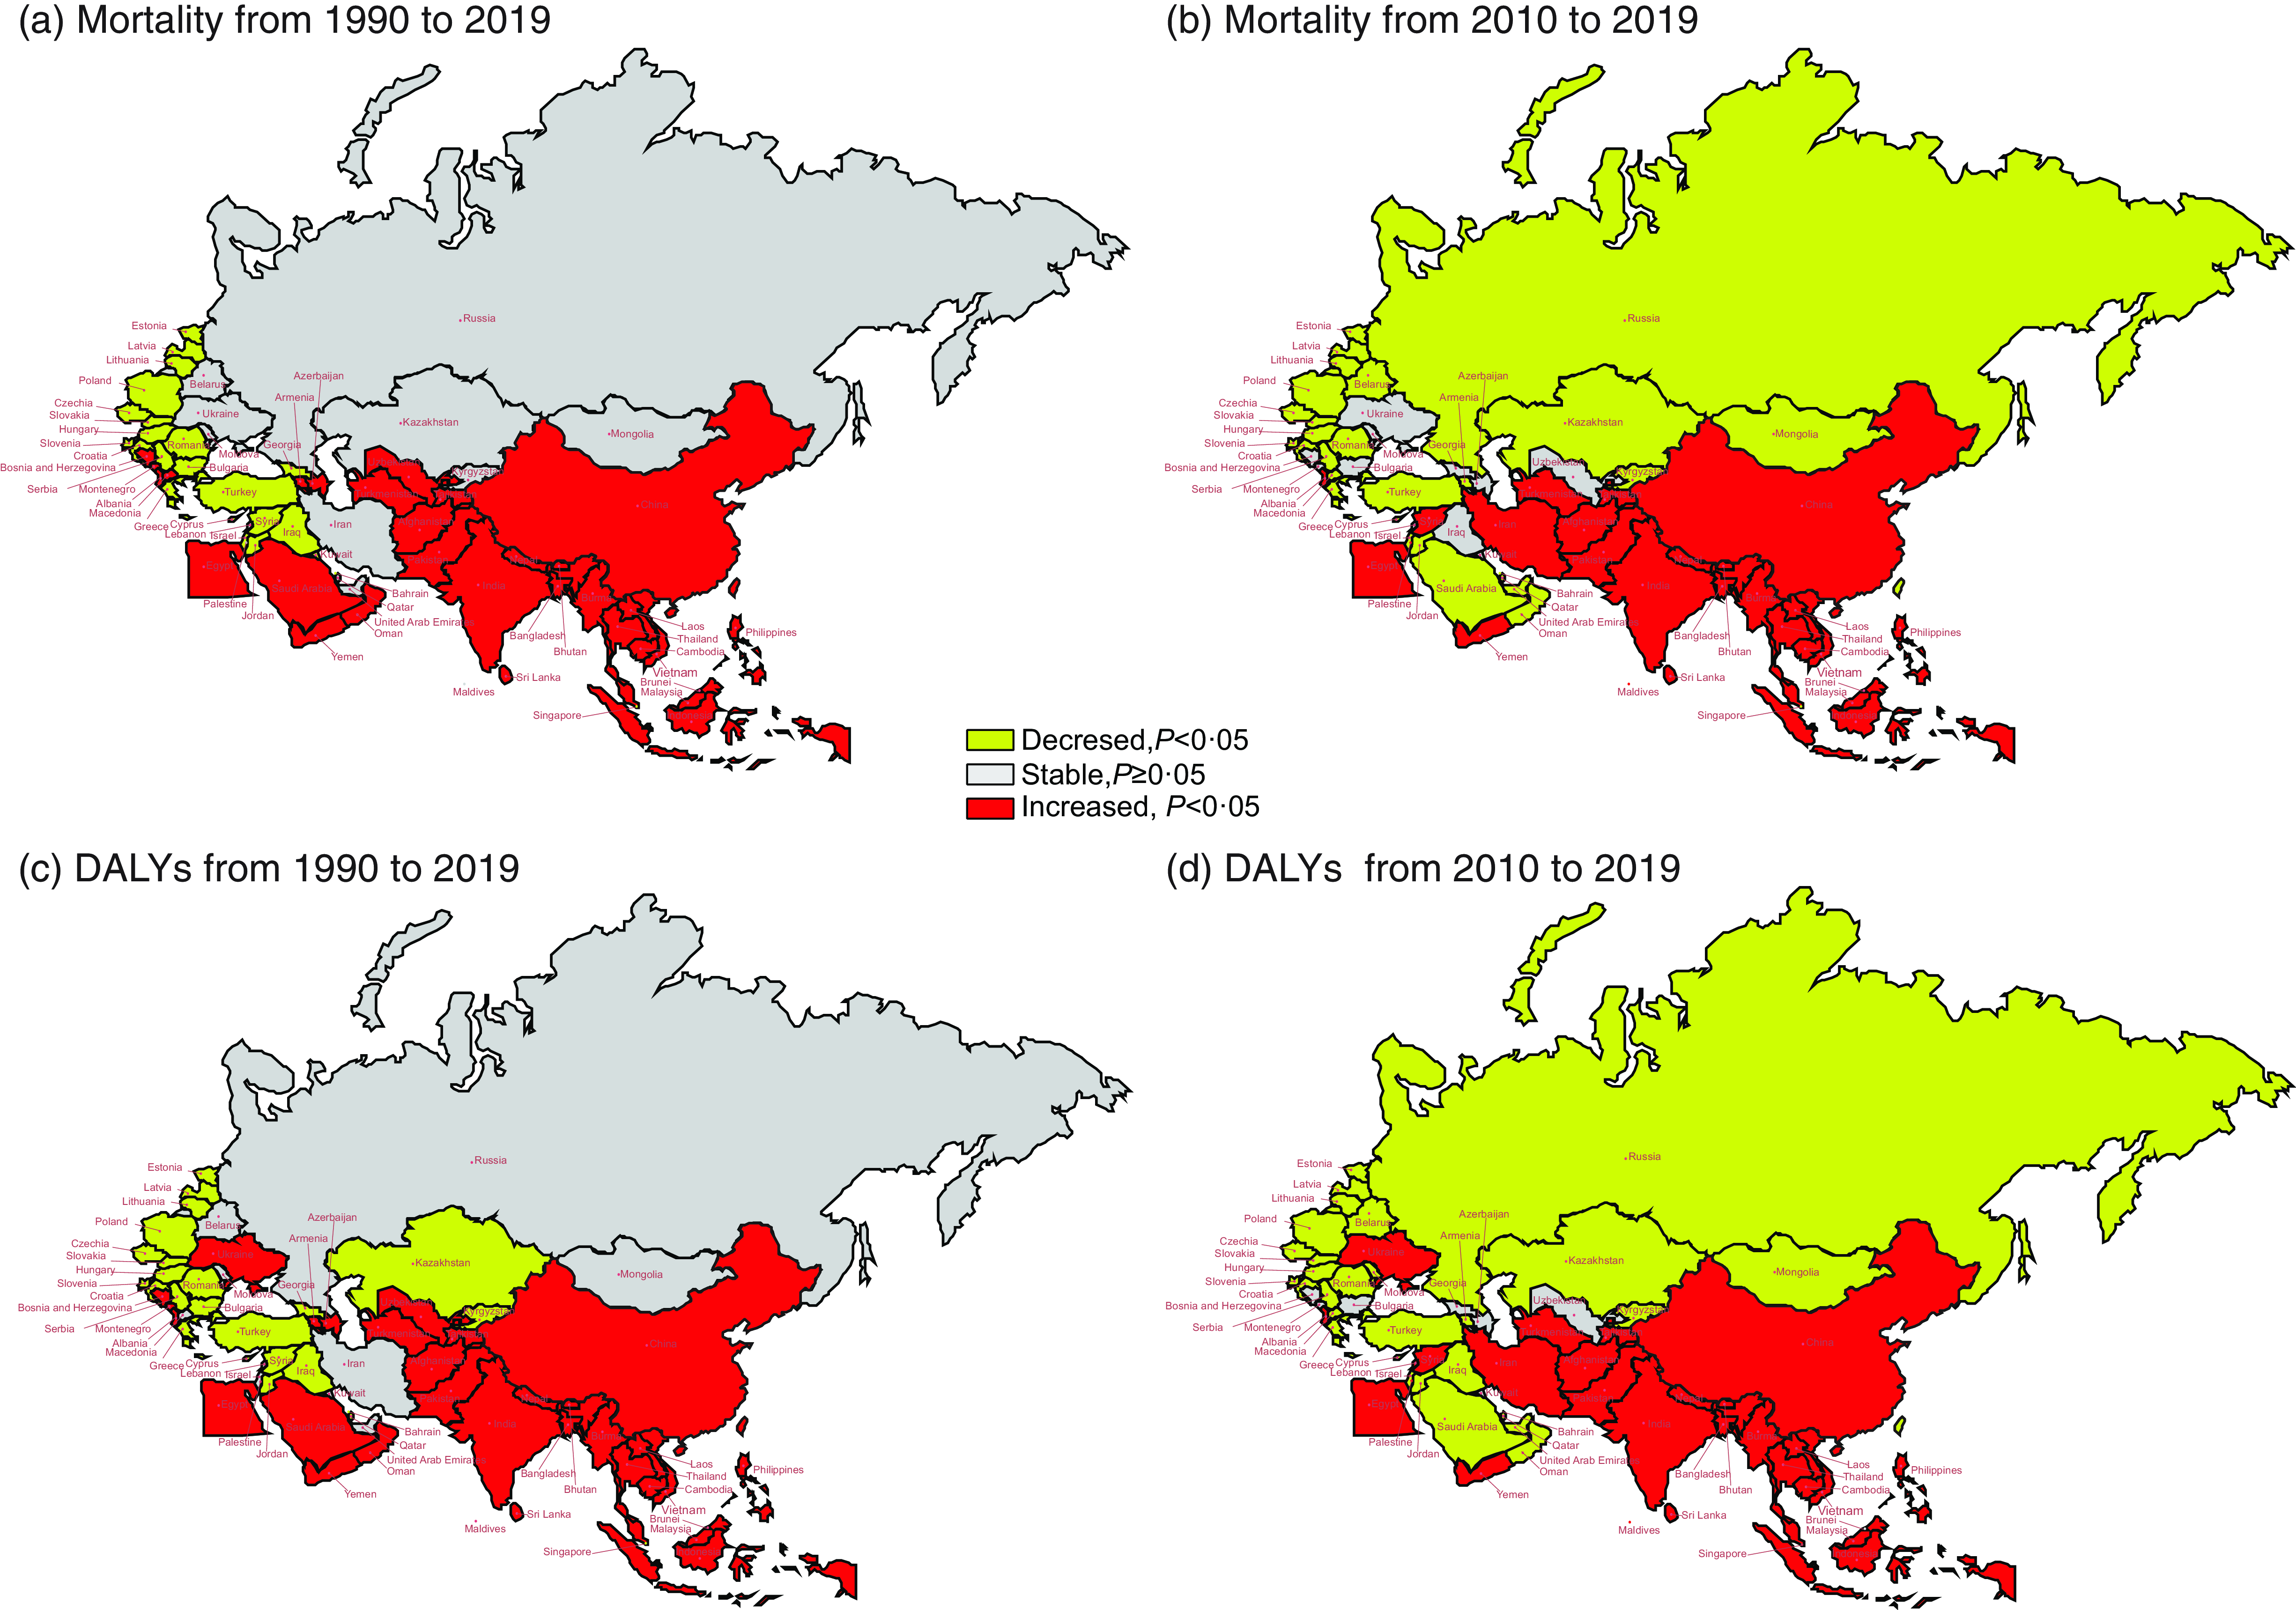
Fig. 2 The temporal trend in the age-standardised mortality and DALY rate attributed to hBMI for 1990–2019 and 2010–2019 in BRI countries. (a) The AAPC of age-standardised mortality rate from 1990 to 2019. (b) The AAPC of age-standardised mortality rate from 2010 to 2019. (c) The AAPC of age-standardised DALY rate from 1990 to 2019. (d) The AAPC of age-standardised DALY rate from 2010 to 2019. DALY, disability-adjusted life years; hBMI, high BMI; BRI, Belt and Road Initiative; AAPC, average annual percentage change
Conversely, Israel, together with Slovenia and Poland, saw notable decreases in DALY, with APCC values of –1·70 % (95 % CI: –1·85 %, –1·55 %), –1·63 % (95 % CI: –1·77 %, –1·48 %) and –1·58 % (95 % CI: –1·71 %, –1·45 %), respectively. While some countries experienced a rising or stable trend in DALY from 1990 to 2019, a downward trend emerged in the period from 2010 to 2019 for nations such as Oman, Mongolia and the Russian Federation, with APCC values of –1·94 % (95 % CI: –2·33 %, –1·56 %), –1·09 % (95 % CI: –1·63 %, –0·55 %) and –2·25 % (95 % CI: –2·77 %, –1·72 %), respectively. See online Supplementary Table S3 for more details.
Figure 3 depicts the trend changes in age-standardised DALY for males and females in BRI countries. In South Asia and Southeast Asia, except for Maldives, both males and females witnessed an increasing trend in DALY (all P < 0·05). For males, most countries in East Asia, South Asia, Southeast Asia and Central Asia, except for Georgia, Kazakhstan and Kyrgyzstan, showed an upward trend in DALY (all P < 0·05).
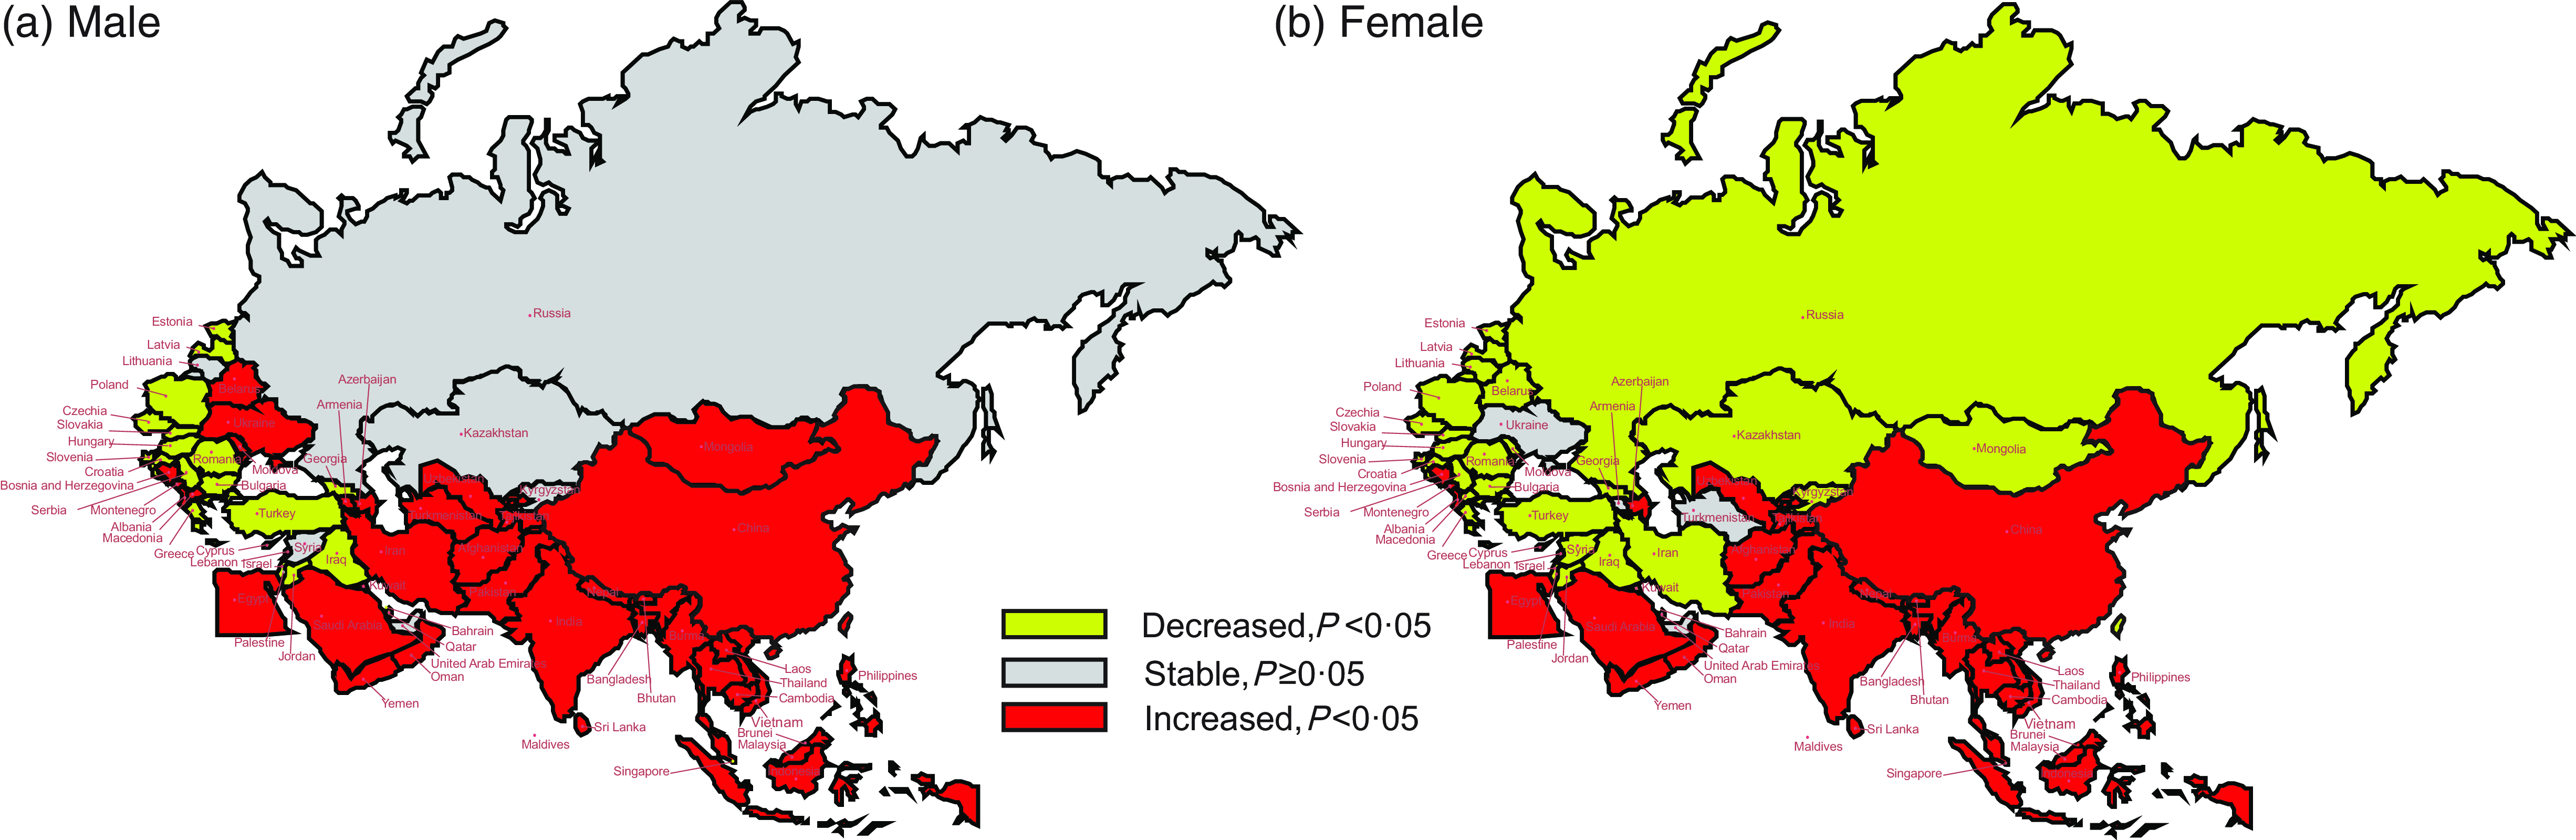
Fig. 3 The temporal trend in the age-standardised DALY rate attributed to hBMI, stratified by gender for 1990–2019 in BRI countries. (a) The AAPC of age-standardised DALY rate in males. (b) The AAPC of age-standardised DALY rate in females. DALY, disability-adjusted life years; hBMI, high BMI; BRI, Belt and Road Initiative; AAPC, average annual percentage change
Among these countries, Vietnam, Bangladesh and Nepal exhibited the most rapid increases, with AAPC values of 5·10 % (95 % CI: 4·73 %, 5·47 %), 4·79 % (95 % CI: 4·60 %, 4·97 %) and 4·61 % (95 % CI: 4·20 %, 5·01 %), respectively. Conversely, the most significant reductions were noted in Israel, Slovenia and Czechia, with their AAPC values being –1·75 % (95 % CI: –1·91 %, –1·58 %), –1·65 % (95 % CI: –1·78 %, –1·52 %) and –1·63 % (95 % CI: –1·83 %, –1·43 %), respectively. Unlike males, females in Central Asia (Mongolia and Kazakhstan), Southeast Asia (Maldives), North Africa and the Middle East (Iran, Kuwait, Lebanon, Palestine and Syrian Arab Republic), Central Europe (Macedonia) and Eastern Europe (Belarus, Moldova, Lithuania and Russian Federation) showed a decreasing trend in DALY (all P < 0·05).
In female populations, Jordan (North Africa and the Middle East) along with Poland and Slovenia (Central Europe) experienced the most notable declines, with their AAPC values being –0·18 % (95 % CI: –0·27 %, –0·08 %), –1·53 % (95 % CI: –1·67 %, –1·40 %) and –1·63 % (95 % CI: –1·83 %, –1·43 %), respectively (online Supplementary Table S4).
Figure 4 depicts the trend changes in age-standardised DALY across different age groups within BRI countries. Over this period, there was a notable increase in DALY across all age groups in China, South Asia and Central Asia, except for Turkmenistan (all P < 0·05). Individuals aged 20–54 years in most countries in North Africa and the Middle East, Central Europe, Eastern Europe, and Western Europe saw declines in DALY. In the 50–74-year age group, most countries in Central Asia, North Africa and the Middle East, and Europe experienced a decrease in DALY. For those aged 75 years and above, Nepal, Vietnam and Uzbekistan exhibited the most significant increases in DALY, with AAPC values of 4·16 % (95 % CI: 3·97 %, 4·36 %), 4·09 % (95 % CI: 3·81 %, 4·36 %) and 3·97 % (95 % CI: 3·42 %, 4·53 %), respectively (online Supplementary Table S5).
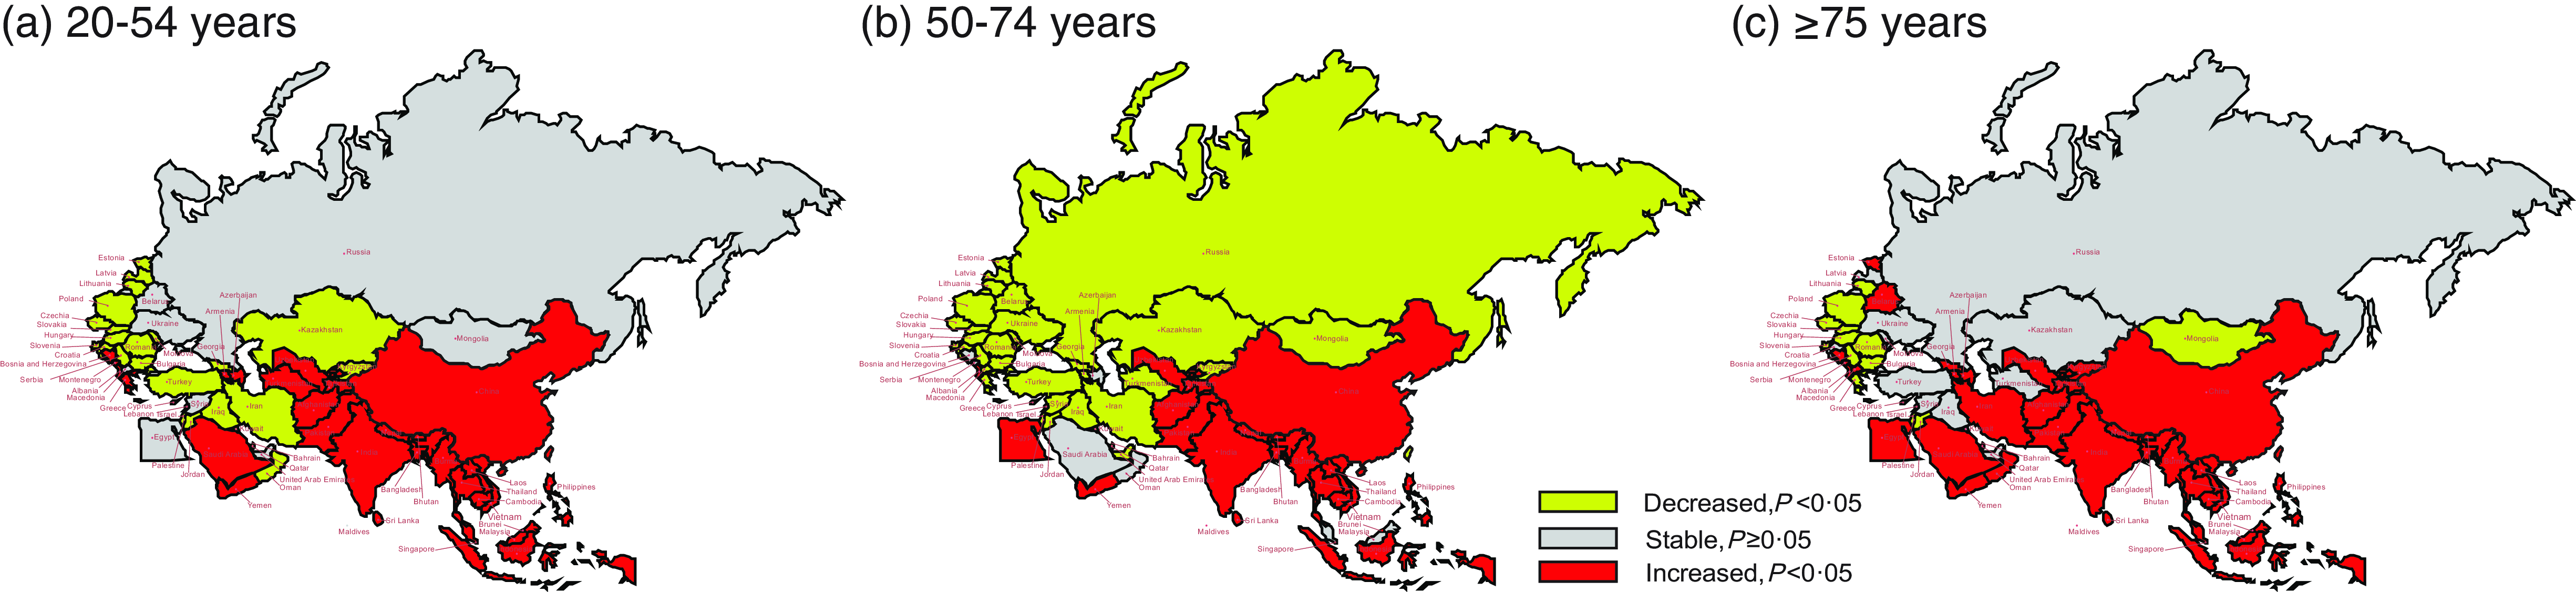
Fig. 4 The temporal trend in the DALY rate attributed to hBMI, stratified by age for 1990–2019 in BRI countries. (a) The AAPC of DALY rate in people aged 20–54 years. (b) The AAPC of DALY rate in people aged 50–74 years. (c) The AAPC of DALY rate in people aged ≥75 years. DALY, disability-adjusted life years; hBMI, high BMI; BRI, Belt and Road Initiative; AAPC, average annual percentage change
Figure 5 depicts the temporal trends of age-standardised DALY of hBMI attributed to various diseases. From 1990 to 2019, most BRI countries witnessed a significant increase in DALY for diabetes and kidney diseases, musculoskeletal disorders, neoplasms, neurological disorders and sensory organ diseases due to hBMI. Regarding DALY attributed to hBMI-related CVD, those countries experiencing increased DALY were predominantly in East Asia, South Asia and Southeast Asia, while those BRI countries showing a decline were mainly in Europe. In terms of DALY attributed to hBMI-related chronic respiratory diseases, countries such as India, Nepal, Maldives, Sri Lanka, Thailand, Oman, Bosnia and Herzegovina, and Montenegro exhibited an upward trend (all P < 0·05), while other BRI countries demonstrated a decrease or stability. For DALY attributed to hBMI-related diabetes and kidney diseases, only Mongolia and Cyprus displayed a downward trend (all P < 0·05) whereas other BRI countries showed an upward or stable pattern.
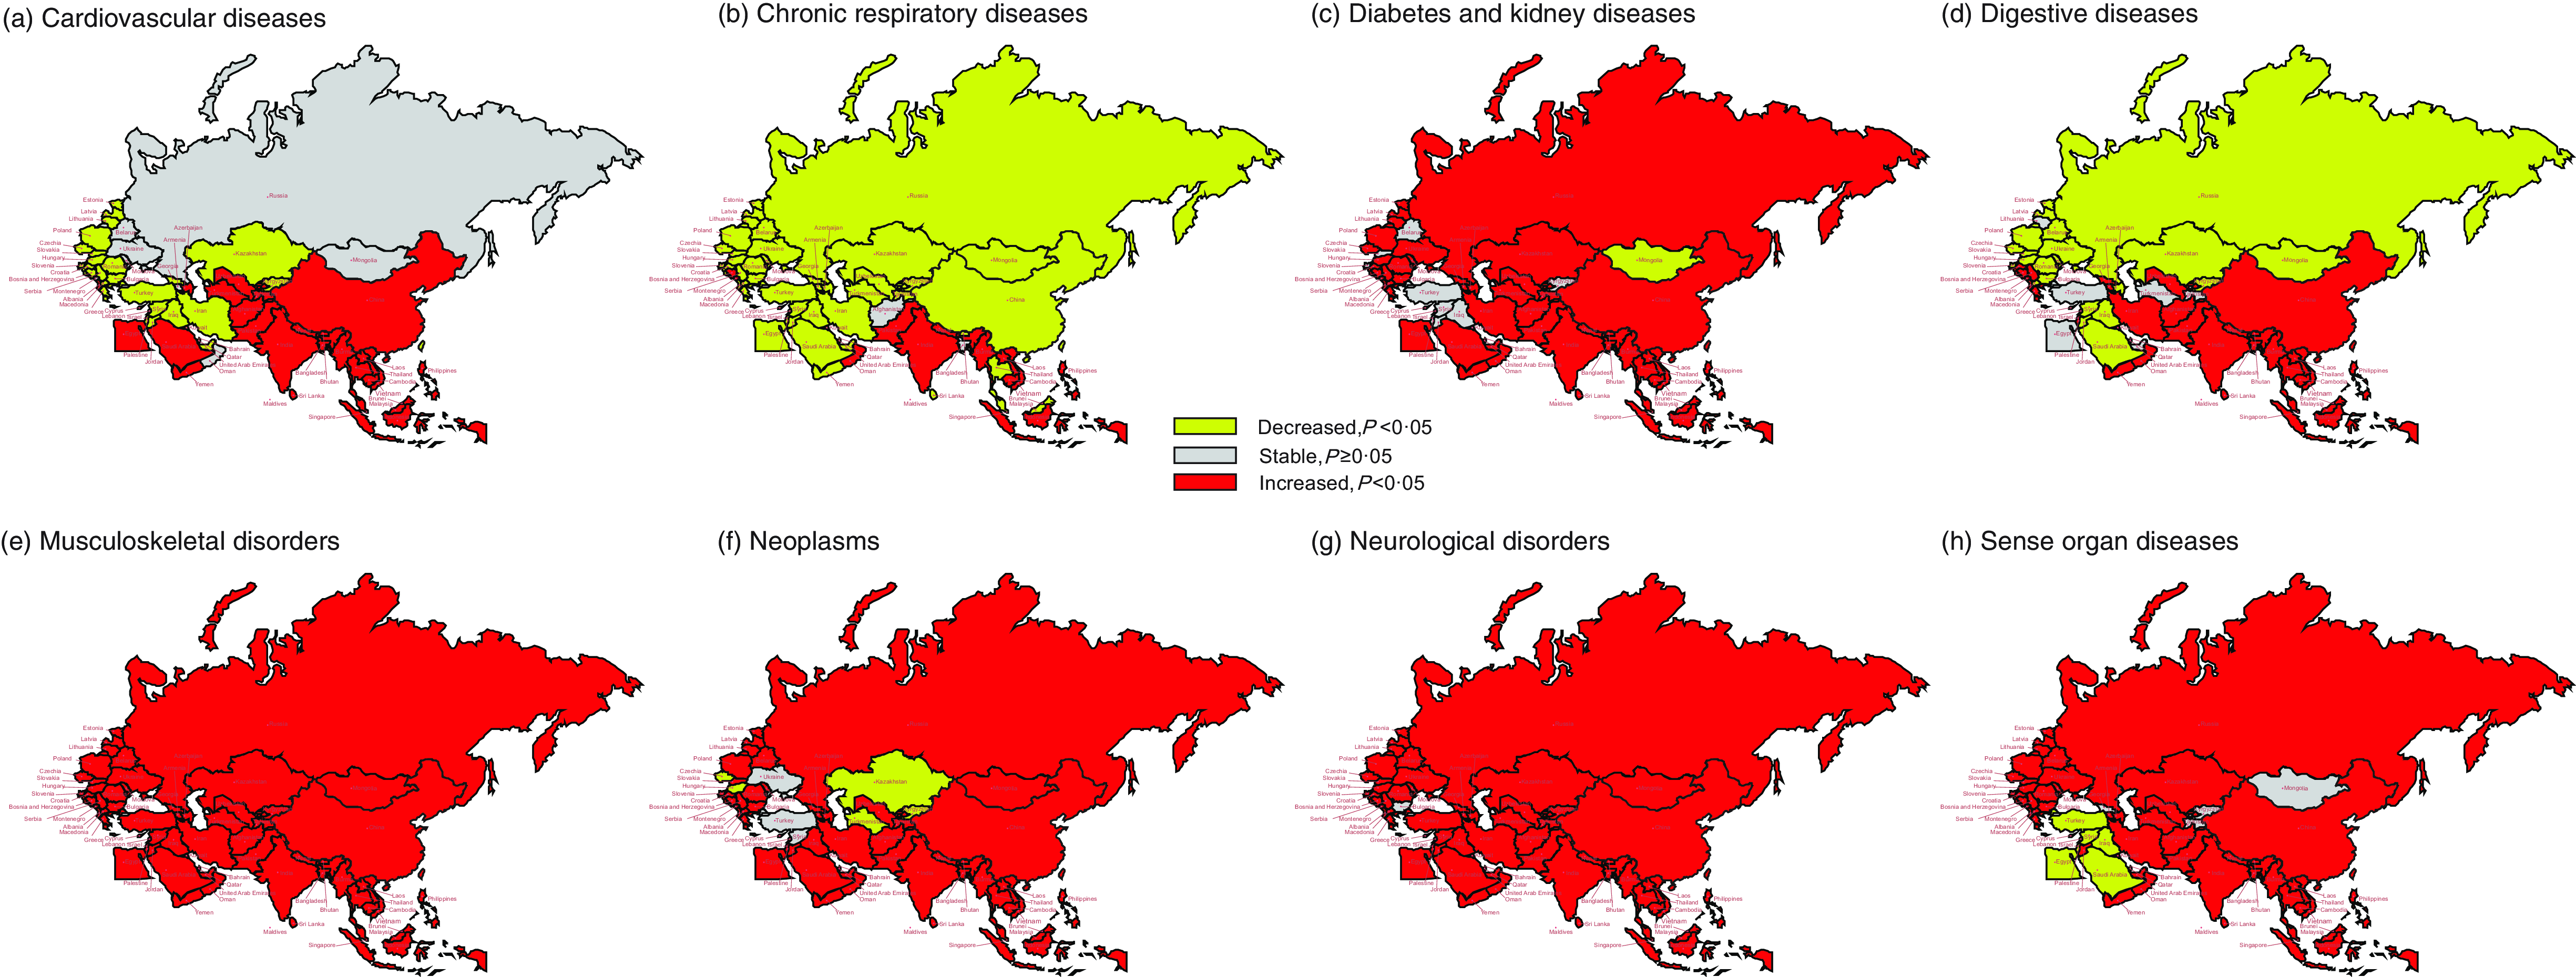
Fig. 5 The temporal trend in the DALY rate of attributed to hBMI, stratified by disease for 1990–2019 in the BRI countries. (a) CVD. (b) Chronic respiratory diseases. (c) Diabetes and kidney diseases. (d) Digestive diseases. (e) Musculoskeletal disorders. (f) Neoplasms. (g) Neurological disorders. (h) Sensory organ diseases. DALY, disability-adjusted life years; hBMI, high BMI; BRI, Belt and Road Initiative
In the category of DALY attributed to hBMI-related digestive diseases, an upward trend was noted in regions such as East Asia (particularly in China), South Asia, Southeast Asia, high-income Asia Pacific and some European countries. Conversely, most countries showed a decline or remained stable in this aspect. In particular, Bahrain, Mongolia and Poland experienced significant decreases, with AAPC values of –2·62 % (95 % CI: –2·94 %, –2·30 %), –1·96 % (95 % CI: –2·18 %, –1·74 %) and –1·73 % (95 % CI: –1·97 %, –1·50 %), respectively (online Supplementary Table S6).
As for DALY attributed to hBMI-related neoplasms, only Kazakhstan, Kyrgyzstan, Bahrain, Czechia, Hungary and Israel demonstrated a decreasing trend (all P < 0·05), while other BRI countries showed an upward or stable pattern. In the case of DALY attributed to hBMI-related sensory organ diseases, the majority of countries in North Africa and the Middle East displayed a downward trend, while other BRI countries exhibited an upward or stable trend.
Discussion
In this study, we aimed to investigate the trends and patterns of DB-hBMI across BRI member countries from 1990 to 2019. Our analysis provides valuable insights into the evolving landscape of hBMI-induced diseases in these countries.
Between 1990 and 2019, notable disparities in the trends of DALY due to hBMI were seen among countries in North Africa, the Middle East, Europe and Asia. By 1990, regions such as North Africa, the Middle East and Europe were already facing significant health burdens due to hBMI; this was largely attributable to early adoption of Western dietary patterns, sedentary lifestyles and urbanisation. However, in the following years, there was a marked decrease in DALY caused by hBMI, reflecting joint efforts towards enhancing public health awareness and implementing intervention measures(Reference Shibli, Aharonson-Daniel and Feder-Bubis20,Reference Mannucci and Peyvandi21) . This decline also highlights the value of Europe’s long-term investments in healthcare infrastructure, systems and public health initiatives(Reference Stenzinger, Moltzen and Winkler22,Reference Greer, Hervey and Mackenbach23) . Despite these positive developments, absolute numbers of DALY attributed to hBMI remain high in North Africa, the Middle East and Europe, underscoring the necessity to continue and intensify efforts to address the increasing prevalence of hBMI, especially in populous countries. In stark contrast to the downward trends observed in North Africa and the Middle East, South Asia and Southeast Asia have seen an upward trajectory in age-standardised DALY associated with hBMI. Countries like India, Nepal and Bangladesh have experienced significant increases in health burdens related to hBMI. These trends are likely influenced by a complex interplay of factors, including rapid urbanisation, shifts in dietary patterns and variations in healthcare accessibility(Reference Ng, Fleming and Robinson24). Addressing the rising health burdens in these regions poses a formidable challenge.
In our analysis, we observed distinct trends in age-standardised DALY due to hBMI across different regions and genders. For males, there has been a notable increase in DALY across East Asia, South Asia, Southeast Asia and Central Asia, suggesting a rising health impact of hBMI. Southeast Asia and South Asia, particularly countries like Vietnam, Nepal and Bangladesh, has seen the sharpest increases, likely reflecting poor nutritional habits, low physical activity levels and unhealthy lifestyle choices prevalent in these regions(Reference Khandelwal and Reddy25). In contrast, females in certain areas such as North Africa, the Middle East and parts of Europe, including Eastern and Central Europe, have experienced a decrease in age-standardised DALY related to hBMI. This gender difference might be attributed to factors like body fat distribution, with females generally having fat stored in less metabolically risky areas compared to males who generally store more abdominal or visceral fat than females(Reference Karastergiou, Smith and Greenberg26). Additionally, the level of physical activity among women in different regions is significantly influenced by cultural and social norms. In some underdeveloped areas of Asia and Africa, restrictions on women’s participation in sports and exercise may increase their susceptibility to health risks associated with hBMI(Reference Coleman, Cox and Roker27). In contrast, European regions actively encourage female participation in physical activities, which supports healthier lifestyle choices and contributes to lower BMI levels(Reference Coleman, Cox and Roker27). These observations underline the complex interplay of dietary habits, lifestyle choices and sociocultural factors in shaping the health outcomes related to hBMI(Reference Zaragoza, Generelo and Julián28). Moreover, it highlights the necessity for gender-sensitive and region-specific public health strategies to effectively address the challenges posed by hBMI.
Between 1990 and 2019, China and South Asia experienced a significant rise in DALY due to hBMI, signalling a health crisis across various age groups. This surge is particularly alarming among youth aged 20–54 years; the increased DALY among youth underscore the escalating obesity epidemic and its health consequences. The primary drivers of this trend include sedentary lifestyles, unhealthy dietary habits and restricted healthcare access, further aggravated by the rapid pace of urbanisation(Reference Gore, Bloem and Patton29,Reference Powell-Wiley, Poirier and Burke30) . The growing prevalence of obesity among the youth not only poses immediate health risks but also threatens long-term economic stability and healthcare system sustainability. Among older adults aged 50–74 years, the increased DALY reflect the compounded effects of chronic diseases associated with hBMI, such as diabetes and cardiovascular conditions(Reference Palmer and Jensen31). Ageing increases vulnerability to these conditions, underscoring the critical need for effective preventive healthcare measures and robust healthcare infrastructure to mitigate this burden. For those aged 75 years and above, the rise in DALY is influenced by the general demographic trend towards an older population structure in developed and developing countries. Indeed, advances in healthcare and living standards have led to longer life expectancies, thereby increasing the proportion of elderly individuals in populations(Reference Bloom, Luca, Piggott and Woodland32). This shift emphasises the ageing society as a key factor in the growing DALY related to hBMI, as older adults are more prone to the adverse health impacts of hBMI due to age-related metabolic changes(Reference Bloom, Luca, Piggott and Woodland32). The observed increase in DALY across all age groups in China and South Asia highlights the urgent need for adaptable healthcare strategies tailored to the region’s evolving demographic profile.
The significant increase in age-standardised DALY attributed to hBMI from 1990 to 2019 across various disease categories, including diabetes and kidney diseases, musculoskeletal disorders, cancer, neurological disorders and sensory organ diseases, in most BRI countries, reflects the comprehensive impact of hBMI on health. First, hBMI is closely linked to diabetes and kidney diseases(Reference Larsson and Burgess33). It leads to insulin resistance and impaired pancreatic function, increasing the risk of diabetes(Reference Piché, Tchernof and Després4). Diabetes, in turn, can damage kidney function, so hBMI indirectly contributes to kidney diseases. These two conditions interact, making it easier for individuals with hBMI to develop kidney-related complications(Reference Kjaergaard, Teumer and Witte34). Second, hBMI negatively affects the musculoskeletal system. Excessive weight or obesity places greater stress on joints, leading to joint pain, fractures and other musculoskeletal issues(Reference Anandacoomarasamy, Caterson and Sambrook35). These problems can limit mobility, further exacerbating the health burden in hBMI individuals. Third, hBMI significantly raises the risk of cancer. Obesity is associated with various cancers, including breast cancer, endometrial cancer and colorectal cancer. This association may be due to the presence of adipose tissue, which can trigger chronic inflammation and hormonal imbalances, promoting the growth of cancer cells(Reference Avgerinos, Spyrou and Mantzoros5). Finally, hBMI has adverse effects on the neurological system and sensory organs. Obesity is linked to neurological disorders like Parkinson’s disease and sensory issues such as vision impairment and hearing loss. Factors such as inflammation, metabolic disruptions and lipid deposits may contribute to the development of these neurological and sensory problems(Reference O’Brien, Hinder and Callaghan36). hBMI not only impacts one system or organ; it triggers chronic diseases through multiple pathways(Reference Larsson and Burgess33). These include chronic inflammation, metabolic disturbances, hormonal imbalances, among others, which interact to promote the development of various diseases(Reference Larsson and Burgess33). Consequently, developing comprehensive public health policies and individual health management plans to address the multifaceted impact of hBMI on health is essential.
The BRI encompasses a vast and geographically diverse part of the world, and, as evidenced by the study results, there are notable disparities among BRI countries in terms of the impact of hBMI on various diseases. These regional variations stem from a complex interplay of socio-economic, cultural and healthcare infrastructure factors. Addressing the public health challenges posed by hBMI in BRI countries necessitates robust international collaboration(Reference Tang, Li and Li2). Such collaboration should extend beyond borders and encompass a range of strategies. First, countries within the BRI should establish formal mechanisms for sharing best practices and lessons learned in managing and preventing hBMI-related diseases. This could involve regular conferences, workshops and knowledge-sharing platforms where experts and policymakers come together to exchange insights. Second, collaborative epidemiological studies can provide a more comprehensive understanding of the factors contributing to hBMI and its health impacts across the BRI countries. These studies can help identify common trends and shared risk factors, which can inform the development of region-specific preventive measures. Furthermore, pooling resources and expertise for healthcare infrastructure development can address healthcare accessibility issues, particularly in less developed regions of the BRI. International funding and support can play a pivotal role in upgrading healthcare facilities and training healthcare professionals.
This study also has several limitations. First, the analysis relies primarily on data from the GBD study, which compiles data from various sources, including surveys, censuses and hospital records. While the GBD study is a valuable resource, it may still be subject to data inaccuracies, misreporting or underreporting in some regions, potentially affecting the accuracy of our findings. Second, the study focuses on BRI countries that have a wide range of economic, cultural and geographical differences. While we have attempted to provide a comprehensive analysis, there may be nuances within individual countries or subregions that our study may not have fully captured. Sub-national variations in disease prevalence, healthcare infrastructure and public health policies could impact the overall trends observed. Nonetheless, we believe that this study provides valuable insights into the relationship between hBMI and disease burden, offering valuable information for future public health policies and interventions.
Conclusions
Our study spanning BRI countries from 1990 to 2019 reveals a concerning trend in DB-hBMI. While some countries have experienced declining trends in DALY from hBMI, others, particularly in South Asia and Southeast Asia, have seen an alarming rise. This calls for targeted interventions to address the multifaceted impact of hBMI on health. Tailoring healthcare strategies to the unique challenges faced by each region is essential, considering sociocultural and economic factors that contribute to these disparities. Therefore, collaboration among BRI countries is essential to devise and enact effective measures aimed at alleviating the impact of hBMI-induced diseases.
Acknowledgements
The authors would like to express our gratitude to the Global Burden of Disease (GBD) database for providing the valuable data used in this research.
Financial support
This study received funding from the Shanghai Municipal Program for Medical Leading Talents (2019LJ15), the National Key Research and Development Program of China (2022YFC3600901), and a key discipline project under Shanghai’s Three-Year Action Plan for Strengthening the Public Health System (2023-2025) (GWVI-11.1-44).
Conflict of interest
The authors declare that the research was conducted in the absence of any commercial or financial relationships that could be construed as a potential conflict of interest.
Authorship
X. L. conceived and designed the study, T. Y., Y. X., Q. W. and X. L. analysed the data, Q. W., X. L. and S. J. provided significant advice and consultation. Y. X. wrote the manuscript. All authors read and approved the submitted manuscript.
Ethics of human subject participation
This study relied on publicly available data from the Global Burden of Disease (GBD) database. Since the study involved secondary data analysis and did not directly involve human subjects, patient data or interventions, it was exempt from institutional ethical review board approval.
To download the data used in these analyses, please visit the Global Health Data Exchange GBD 2019 website.
Supplementary material
For supplementary material accompanying this paper visit https://doi.org/10.1017/S1368980024001253


 Open access