


Effective 1 April 2015, the City of Seattle enacted its multistep $15 minimum wage ordinance (MWO) to incrementally increase workers’ minimum wage to $US 15/h between 2017 and 2021, depending on the size of the employer and whether the employer offers medical benefits( 1 ). Many municipalities in the USA are implementing similar policy measures in an attempt to address income inequality and to provide low-income workers with a living wage( 2 – 6 ).
One counterargument to raising minimum wages is grounded in the concern that while increased labour wages may benefit low-wage workers, the increase in labour wages will be offset by higher prices of basic consumer goods, particularly food, thus burdening the very workers the policy is intended to help( 7 – 9 ). Food prices are of particular concern because the food system represents the largest employer of minimum-wage workers, with nearly one-third of all low-wage workers employed in the food system( 7 ). In particular, highly processed foods might be expected to experience greater increases in price than less processed foods based on the assumption that they must pass through more steps in the food system and thus involve more low-wage workers( 10 , 11 ).
The current literature is mixed regarding the pass-through effects of an increase in minimum wage on fast-food and restaurant prices. A 1994 study by Card and Krueger found that fast-food restaurant prices were impacted by a 16 % increase in minimum wage in New Jersey and rose 4 % faster than fast-food restaurant prices in unaffected Pennsylvania, suggesting a pass-through effect was a factor( Reference Card and Krueger 12 ). However, the study also found the price increase to be consistent across New Jersey fast-food restaurants despite differing initial wage rates, suggesting a pass-through effect was not the only factor influencing food prices( Reference Card and Krueger 12 ). A study by Aarsonson in 2001, which focused on the timing of changes in food prices in response to an increase in minimum wage, found that an increase in federal minimum wage passed through to restaurant food prices in the first quarter after the month of enactment, but not in prior quarters or quarters thereafter( Reference Aaronson 13 ). In a subsequent 2008 study, under the observation that one-third of restaurant workers are paid the minimum wage and one-third of total costs are labour costs, Aaronson et al. found that a 10 % increase in the minimum wage could result in a 0·56–1·09 % price increase in restaurants in a competitive labour market( Reference Aaronson, French and MacDonald 14 ). Moreover, a study which evaluated the impact of a 12 % increase in minimum wage in 1992 and a 9 % increase in minimum wage in 1997 found that food prices increased by less than 1 % each time. The authors concluded there was only a slight pass-through effect and that the magnitude of the minimum wage increase did not differentially affect food price increases( Reference Lee, Schluter and O’Roark 15 ).
Other studies indicate a more robust pass-through effect. One study estimated that an increase in federal minimum wage to $US 15/h would cause a 4 % increase in fast-food restaurant prices( Reference Ma and Ghiselli 16 ). A study of San Jose, California’s increased minimum wage in 2013 found that for every 10 % increase in minimum wage rate, restaurant prices increased by 0·58 %( Reference Allegretto and Reich 17 ). Finally, a 2016 study looked at the impact of a 33 % increase in federal minimum wage on fast-food prices of a burger, pizza and chicken, and found that a burger had the most elastic price, increasing by 3 % in response to an increase in minimum wage( Reference Otten, Buszkiewicz and Tang 18 ).
By contrast, little is known about the effects of increased wages on supermarket food prices. Preliminary studies on the effects of Seattle’s increased minimum wage on supermarket food prices have shown no evidence of changes in supermarket food prices by market basket, supermarket chain or food group in response to the early implementation of Seattle’s ordinance( 19 ). The present study advances these analyses by exploring the effects of Seattle’s increased minimum wage on supermarket food prices by level of food processing.
Grouping foods and beverages into categories based on the extent and purpose of food processing is a relatively new concept( Reference Monteiro 20 ). Past and present dietary guidelines use food groups (fruits, vegetables, grains, protein, dairy) to make dietary recommendations with the goal of improving diet nutrient quality( 21 – 23 ). More recently, dietary recommendations have begun to differentiate between fresh, processed and highly processed foods. This is due to emerging research showing that highly processed foods are strongly linked to obesity, type 2 diabetes and other diet-related chronic diseases, and that, for example, processed foods account for 90 % of the daily intake of added sugar in the USA( Reference Martínez Steele, Baraldi and Costa Louzada 24 – Reference Jannasch, Kröger and Schulze 27 ).
At the same time, diets high in energy-dense foods, many of them processed, tend to cost less than do diets high in nutrient-dense foods, such as fresh and minimally processed produce( Reference Drewnowski, Darmon and Briend 28 ). Subsequently, low-income shoppers are more likely to buy energy-dense and more highly processed foods( Reference Darmon and Drewnowski 29 ). Thus, it is important to better understand the potential pass-through effects of increased labour wages on supermarket food prices by level of food processing to understand how it might impact low-wage workers’ food purchasing behaviours and thus their health.
Studies examining the effect of price increases on shopping behaviour have shown mixed results. Several studies have found that, while small taxes or subsidies on food were unlikely to have a significant impact of overweight or obesity, sizeable increases can sway dietary patterns, particularly among low-resource populations( Reference Powell and Chaloupka 30 – Reference Schroeter, Lusk and Tyner 32 ). A review of experimental evidence on food purchasing patterns resulting from price changes found that price changes can impact the purchase of targeted foods; however, due to substitution effects it was unclear if this would positively impact health( Reference Epstein, Jankowiak and Nederkoorn 33 ). Andreyeva et al. conducted a review of the price elasticities of 160 food items and found that away-from-home foods, soft drinks, juice and meats are the most responsive to price changes, with own elasticities ranging from −0·7 to −0·8( Reference Andreyeva, Long and Brownell 34 ). They observed that a 10 % increase in soft drink prices could result in a reduction in consumption of 8–10 %( Reference Andreyeva, Long and Brownell 34 ). A recent study, conducted in Brazil, found that the share of ultra-processed food items purchased at supermarkets was 25 % greater than at other food stores( Reference Machado, Claro and Canella 35 ). In addition, the authors noted that a 1 % increase in the price of ultra-processed food items resulted in a 0·59 % reduction in energy acquisition at supermarkets( Reference Machado, Claro and Canella 35 ).
The purpose of the current analysis was to investigate whether the increase in minimum wage had a differential effect on supermarket food prices based on level of processing in supermarkets affected and unaffected by the MWO.
Methods
Data source
The data for the present study come from a market basket survey conducted by the Seattle Minimum Wage Study Team to evaluate the effects of Seattle’s MWO on supermarket food prices( 36 ). The use of a market basket is a commonly used approach to assess food prices( Reference Drewnowski, Aggarwal and Hurvitz 37 – 39 ). This approach is currently used by the US Bureau of Labor and Statistics to calculate the Consumer Price Index (CPI) as well as in other metropolitan cities such as Chicago( 40 , Reference Block and Kouba 41 ).
The current market basket consisted of 106 food and beverage items and was developed by the University of Washington’s Center for Public Health Nutrition based on the CPI and Thrifty Food Plan market baskets( Reference Drewnowski, Aggarwal and Hurvitz 37 ). The market basket includes common unhealthy and healthy items, including foods recommended in the Behavioral Risk Factors Surveillance System nutrition module and the 2015 Dietary Guidelines for Americans( 21 , 22 ).
Data collection
Details of the data collection are described in detail in a previously published paper and elsewhere( Reference Otten, Buszkiewicz and Tang 18 , 19 , Reference Buszkiewicz, Otten and Tang 42 , Reference Buszkiewicz, Otten and Tang 43 ). Briefly, data were collected at six affected supermarket chain stores in Seattle and six same-chain but unaffected supermarket chain stores in King County, Washington, USA in March 2015 (baseline: 1-month pre-policy enactment), May 2015 (follow-up 1: 1-month post-policy enactment) and May 2016 (follow-up 2: 1-year post-policy enactment) to capture supermarket prices at 1-month pre-, 1-month post- and 1-year post-MWO enactment. Table 1 shows the phase-in schedule for Seattle’s minimum wage at the three time points of data collection. The six supermarket chains were selected for the study based on a prior Seattle study conducted by Drewnowski et al. in 2012, showing that 65 % of a representative sample of Seattle and King County residents identified these six chains as a primary food source( Reference Drewnowski, Aggarwal and Hurvitz 37 ). These supermarket chains were also selected for inclusion of low price, medium price and high price total market basket costs, as determined by a 2009 Seattle study( Reference Drewnowski, Aggarwal and Hurvitz 37 , 39 ). These chains represent fifty of the seventy-eight supermarkets affected by the MWO in Seattle.
Table 1 Timeline of Seattle’s minimum wage increase during data collection

† For large employers who do not pay towards an employee’s medical benefits( 1 ).
‡ Three other phase-in schedules are possible based on employer size and provision of employee benefits. For more information, please visit: https://www.seattle.gov/laborstandards/ordinances/minimum-wage/.
For each market basket item, one researcher trained in the protocol recorded the lowest price available. This was often the store brand price. If store brand price was not the cheapest or not available, the next lowest price was recorded. No sales, promotions, coupons or discounted prices were recorded. When possible, items recorded were in the same purchasable form as prior collections. Market basket item prices with variable sizes were based on medium-sized items. If an item was not found, the researcher asked a store worker to help locate it. If the item was still unavailable, a similar product was chosen. For example, if a supermarket did not have a Red Delicious apple, the price of a medium-sized Fuji apple was recorded. In the rare event a similar product was not available, the researcher left that item price null and documented the attempt to locate it.
Food processing categorization
For the current analysis, market basket food items were categorized by level of food processing or the degree to which natural food was altered to create food products. Food processing categorization was assigned based on the extent of food processing and was determined using a food classification system commonly used by other studies( Reference Martínez Steele, Baraldi and Costa Louzada 24 , 39 , Reference Monteiro, Levy and Claro 44 , Reference Moubarac, Parra and Cannon 45 ). Based on the food classification system used by Martínez Steele et al., food processing categories, detailed in Table 2, included: unprocessed or minimally processed foods (group 1), processed culinary ingredients (group 2), processed foods (group 3) and ultra-processed foods (group 4)( Reference Martínez Steele, Baraldi and Costa Louzada 24 ).
Table 2 Food processing categorization based on the level of processing
Market basket items were independently coded by two researchers for data verification purposes. Researchers agreed upon the food processing categorization of ninety-three (88 %) of the 106 market basket items. The remaining thirteen (12 %) items were decided and agreed upon using a third researcher.
Statistical analysis
For the present study, all prices were converted to item-standardized units. For example, all prices collected for canned green beans were standardized to represent the price of a 411 g (14·5 oz) can, the most commonly available item unit. The ‘total market basket price’ is the sum of the market basket food items per location. The ‘average market basket price per food processing category’ is the mean price of the market basket food processing category per location.
A complete case analysis was conducted to exclude any item that was not consistent over the three data collection time points. Unpaired t tests were used to detect price differences by location at a fixed time. Paired t tests were used to detect average price differences, by food processing group and location, across time. A multilevel, linear difference-in-differences model was used to identify changes in the average market basket item food prices attributable to the MWO:
 $$\eqalignno{Price_{{ijkt}} {\equals} &\alpha _{j} {\plus}\beta _{k} Seattle_{k} {\plus}\gamma _{1} Post1_{t} {\plus}\gamma _{2} Post2_{t} \cr&{\plus}\delta _{1} Post1_{t} {\times} Seattle_{k} {\plus}\delta _{2} Post2_{t} {\times}Seattle_{k} {\plus}{\varepsilon}_{{ijkt}} ,$$
where Price ijkt is the estimated mean price for a food item i at store j in region k (affected (Seattle) or unaffected (King County) stores) at time t. α j is a store-level random effect. Seattle k is an indicator that equals 1 for Seattle stores and 0 for King County stores, and β k captures differences in mean item-level prices across regions. Post1 t are Post2 t are indicator variables that equal 1 for prices measured in the first (1-month or May 2015) and second follow-up periods (1-year or May 2016), respectively, and γ 1 and γ 2 capture differences in mean item-level prices across time relative to the baseline period.
Post1 t × Seattle k and Post2 t × Seattle k equal 1 only for Seattle stores in the follow-up periods 1 and 2, and δ 1 and δ 2 capture the difference in prices in Seattle in the post-policy periods that cannot be explained by region and time effects, and thus appear to be attributable to the MWO in each period. ε ijkt is the idiosyncratic error. In addition, this model utilized robust standard errors clustered at the store level.
Overall, there were twenty-one (2 %) market basket items out of 1272 items missing from follow-up 2 data collection. Missing data were assumed to be missing at random. A complete case statistical analysis was conducted, dropping missing items which did not have a comparison by time or within store. Missing items were dropped between baseline and follow-up 2 (n 12) and follow-up 1 and follow-up 2 (n 10). No items were missing between baseline and follow-up 1.
Results
Table 3 shows the range of differences in average market basket price per food processing category between Seattle and King County at each time point. Negative price differences indicate King County had higher prices and positive price differences indicate Seattle had higher prices, on average, per food processing category. At baseline, follow-up 1 and follow-up 2, unprocessed or minimally processed foods (group 1) had the largest difference in prices between Seattle and King County.
Table 3 The range in differences and mean differences in the average market basket price between Seattle (‘intervention’) and King County (‘control’), by food processing category, following Seattle’s minimum wage ordinance
Baseline, March 2015 (1-month pre-policy enactment); follow-up 1, May 2015 (1-month post-policy enactment); follow-up 2, May 2016 (1-year post-policy enactment).
† Differences between prices were computed by subtracting the price of each food processing category (the sum of individual item prices within each category) in King County from the price of the same food processing category in the corresponding Seattle supermarket chain.
Figure 1 shows the sum of market basket item prices within each food processing category by store chain and location at baseline, follow-up 1 and follow-up 2. There were no statistically significant differences in average prices between locations or supermarket chains at baseline, follow-up 1 or follow-up 2 for any food processing category.
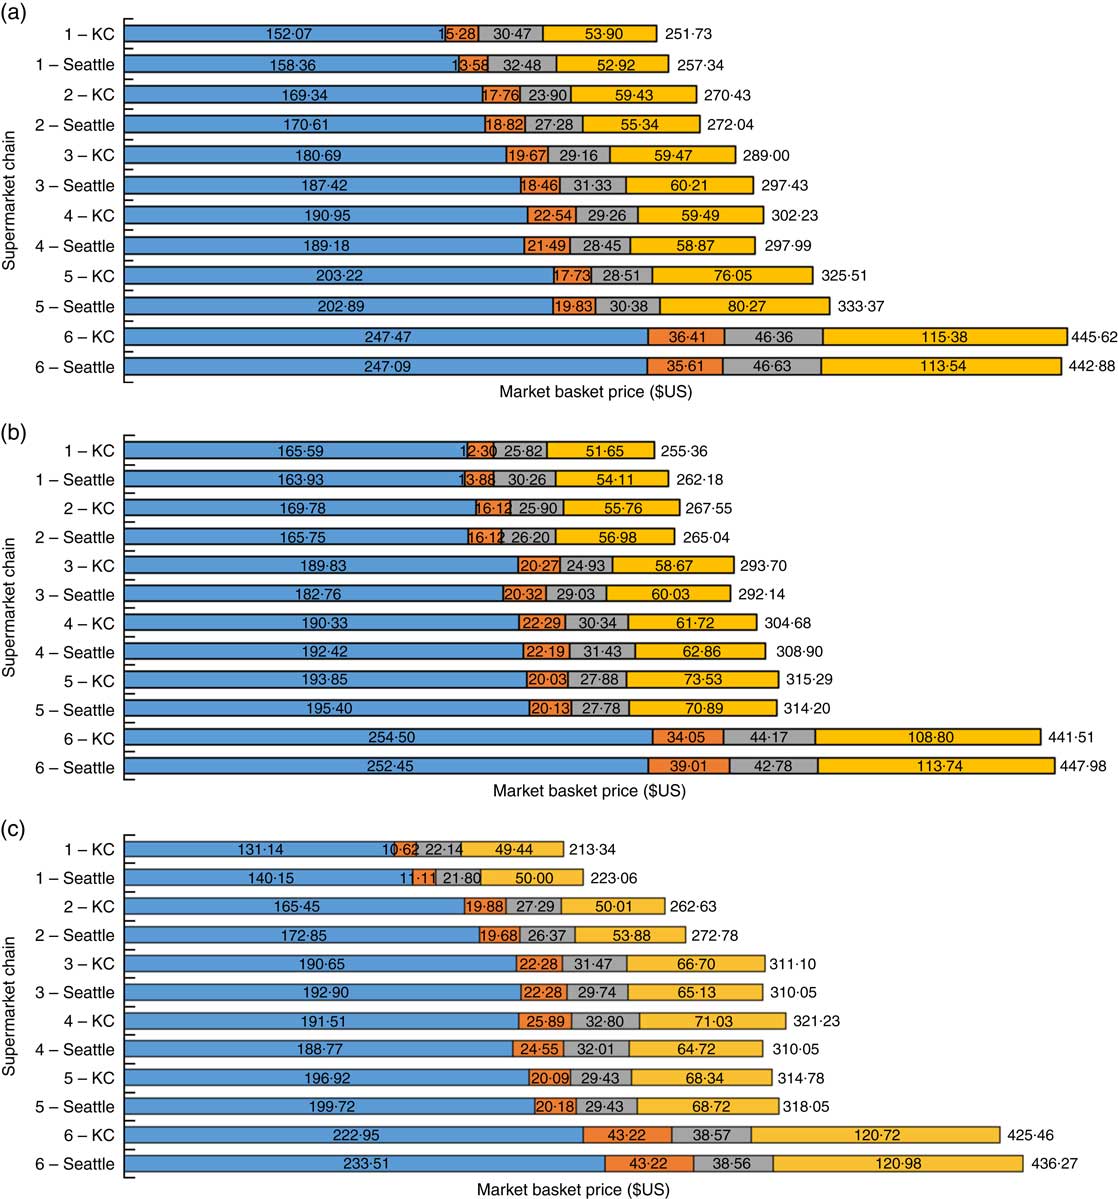
Fig. 1 (colour online) Impact of Seattle’s minimum wage ordinance on supermarket food prices. Market basket item prices summed within food processing category (![]() , group 1: unprocessed or minimally processed foods;
, group 1: unprocessed or minimally processed foods; ![]() , group 2: processed culinary ingredients;
, group 2: processed culinary ingredients; ![]() , group 3: processed foods;
, group 3: processed foods; ![]() , group 4: ultra-processed foods), by store chain (1–6) and location (Seattle, ‘intervention’; King County (KC), ‘control’) at (a) baseline (March 2015; 1-month pre-policy enactment), (b) follow-up 1 (May 2015; 1-month post-policy enactment) and (c) follow-up 2 (May 2016; 1-year post-policy enactment)
, group 4: ultra-processed foods), by store chain (1–6) and location (Seattle, ‘intervention’; King County (KC), ‘control’) at (a) baseline (March 2015; 1-month pre-policy enactment), (b) follow-up 1 (May 2015; 1-month post-policy enactment) and (c) follow-up 2 (May 2016; 1-year post-policy enactment)
Figure 2 illustrates the change in average price per item by food processing category by location between time points. The largest change in the average item market basket price between baseline and follow-up 1 was −$US 0·13 for processed foods (group 3) in Seattle; between follow-up 1 and follow-up 2 was $US 0·53 for processed culinary ingredients (group 2) in King County; and between baseline and follow-up 2 was $US 0·46 for processed culinary ingredients (group 2) in Seattle. The smallest change in the average item market basket price between baseline and follow-up 1 and baseline and follow-up 2 was −$US 0·01 for unprocessed or minimally processed foods (group 1) in Seattle; and between follow-up 1 and follow-up 2 was $US 0·00 for unprocessed or minimally processed foods (group 1) in Seattle.

Fig. 2 (colour online) Impact of Seattle’s minimum wage ordinance on supermarket food prices. Change† in average price of market basket food items by food processing category (![]() , group 1: unprocessed or minimally processed foods;
, group 1: unprocessed or minimally processed foods; ![]() , group 2: processed culinary ingredients;
, group 2: processed culinary ingredients; ![]() , group 3: processed foods;
, group 3: processed foods; ![]() , group 4: ultra-processed foods) in Seattle (‘intervention’) and King County (KC; ‘control’) between (a) baseline (March 2015; 1-month pre-policy enactment) and follow-up 1 (May 2015; 1-month post-policy enactment), (b) follow-up 1 and follow-up 2 (May 2016; 1-year post-policy enactment) and (c) baseline and follow-up 2‡. †Change was computed by subtracting baseline from follow-up 1, follow-up 1 from follow-up 2, and baseline from follow-up 2; ‡paired t tests were used to detect differences across time, statistically significant changes indicated by diagonal hatching
, group 4: ultra-processed foods) in Seattle (‘intervention’) and King County (KC; ‘control’) between (a) baseline (March 2015; 1-month pre-policy enactment) and follow-up 1 (May 2015; 1-month post-policy enactment), (b) follow-up 1 and follow-up 2 (May 2016; 1-year post-policy enactment) and (c) baseline and follow-up 2‡. †Change was computed by subtracting baseline from follow-up 1, follow-up 1 from follow-up 2, and baseline from follow-up 2; ‡paired t tests were used to detect differences across time, statistically significant changes indicated by diagonal hatching
There was a statistically significant change in the average price per item for processed culinary ingredients (group 2) in both Seattle and King County between follow-up 1 and follow-up 2 and between baseline and follow-up 2 (P < 0·01); and for unprocessed or minimally processed foods (group 1) in King County between follow-up 1 and follow-up 2 (P = 0·04).
Table 4 shows the results of the multilevel, difference-in-differences model. There is no evidence, either overall or for any specific food group, that the Seattle MWO raised supermarket prices. No change in average price per item in Seattle reached statistical significance for any of the food processing groups for follow-up 1 (1-month post-policy enactment) or follow-up 2 (1-year post-policy enactment). The largest estimated price change in Seattle that could be attributed to the MWO was $US 0·20 (se = $US 0·16) for processed culinary ingredients (group 2) between baseline and follow-up 1. Further note that the estimated impacts are $US 0·00 for both unprocessed or minimally processed foods (group 1) and ultra-processed foods (group 4) between baseline and follow-up 2 (se = $US 0·06 and 0·16, respectively).
Table 4 Overall and food processing group-stratified generalized least-squares regression results for the mean change in item-level price across Seattle (‘intervention’) and King County (‘control’) stores and time, from March 2015 to May 2016, following Seattle’s minimum wage ordinance
Baseline, March 2015 (1-month pre-policy enactment); follow-up 1, May 2015 (1-month post-policy enactment); follow-up 2, May 2016 (1-year post-policy enactment).
P values come from Wald tests.
*P<0·05, ***P<0·001.
Discussion
The present study examined the effect of Seattle’s MWO on supermarket food prices by level of food processing as the policy was being implemented and phased in from $US 9·47/h to $US 11·00/h to $US 13·00/h. Results indicate no statistically significant change in supermarket food prices by level of processing between supermarkets affected and unaffected by Seattle’s MWO over time. This result suggests there was no evidence of a pass-through effect of increased labour wages at 1-year post-policy enactment on supermarket food prices by level of food processing.
Our findings are consistent with Katz and Krueger’s 1992 study that found fast-food prices were not directly impacted by a 22 % increase in federal minimum wage( Reference Katz and Krueger 46 ) and with Card and Krueger’s well-known 1994 study which found that changes in fast-food prices were not solely attributable to an increase in minimum wage( Reference Card and Krueger 12 ). However, our findings are inconsistent with a more recent study which found that an increase in federal minimum wage to $US 15/h would increase fast-food prices by 4 %( Reference Ma and Ghiselli 16 ). To our knowledge, no prior studies have evaluated the impact of a city-wide increase in minimum wage on supermarket food prices by level of food processing. The present study fills this gap in the literature and serves as an initial study on which future studies can be based and compared. These findings are important in understanding the implications of the minimum wage on public health. Because low-income shoppers are more likely to purchase and consume highly processed foods rich in fat and sugar, which are linked to obesity and other diet-related chronic diseases, it is important to understand how potential pass-through effects of increased labour wages might differentially impact food prices( Reference Martínez Steele, Baraldi and Costa Louzada 24 – 26 , Reference Drewnowski, Darmon and Briend 28 ). This has important public health implications because, as noted earlier, low socio-economic shoppers tend to be particularly price sensitive to changes in price among highly processed food items( Reference Andreyeva, Long and Brownell 34 , Reference Machado, Claro and Canella 35 ).
There are many possible explanations for our lack of observed changes in supermarket food prices by level of food processing. First, processed foods are handled by minimum- and low-wage food system workers at both the food processing level and the retail level (in-store supermarket employees). Because food processing tends to occur outside Seattle, these labour wages would not be affected by the MWO. However, retail-level employees working in Seattle supermarkets would be impacted by the MWO and their increased wages may pass through to food prices. Given that our findings suggest that an increase in minimum wage for retail supermarket employees does not translate to an increase in supermarket food prices, these results could be explained by Seattle’s low-wage workers contributing a small share to the total amount of input cost in producing these supermarket foods. Second, the percentage of supermarket employees receiving minimum wage may not be great enough to impact food prices. Using administrative earnings and hours data from over 500 grocery establishments provided by the Washington Employment Security Department, we find that 14·3 % of jobs in grocery stores (NAICS (North American Industry Classification System) code 445110) in Seattle and 29·3 % in the rest of King County earned less than $US 11/h in the year preceding the passage of the MWO. Yet, these proportions are higher when compared with all low-wage wage jobs in all industry sectors, 7·2 and 9·9 % respectively, and thus the effect of the MWO on prices should be greater in grocery stores than in other industries. Given that the supermarket industry is competitive, we might expect food prices to increase in Seattle by 0·76 % in response to the initial increase to $US 11·00 from $US 9·47 (14·3 % × 33 % 16·2 %) and 0·73 % in response the increase to $US 13·00 from $US 11·00 (14·3 % × 33 % × 15·4 %) based on calculations by Aaronson et al. in 2008( Reference Aaronson, French and MacDonald 14 , Reference Matsa 47 , Reference Volpe 48 ). Third, four of the six supermarket chains are unionized and the union contracts or the corporate supermarket chains may have had a higher minimum wage rate in 2015 than Seattle’s $US 9·47/h rate. Consequently, the percentage increase in Seattle’s minimum wage from baseline to follow-up 2 would not be reflected in these supermarket chains. In our analysis, we did assess for differences by union status, both as a stratification variable and a covariate; no differences were found. However, given our relatively small sample, we were likely not sufficiently powered for this analysis. Fourth, highly processed foods may require fewer low-wage workers if highly processed foods are made by machines and unprocessed foods are hand-picked by workers. Fifth, there was an 11-month time gap from when Seattle’s minimum wage policy was proposed to the time of enactment, such that baseline prices may have been pre-emptively increased to capture predicted wage increases( 2 ). Lastly, the duration of exposure to MWO may not be sufficient to have a lasting impact on supermarket prices.
There were many strengths of the present study. First, it is a prospective, longitudinal study that observed the impact of Seattle’s incremental minimum wage increases over time at the same stores and across the same market basket items. Second, it used the established methodologies of the market basket approach and the food processing classification system. Despite these strengths, there are some limitations. First, the study is unable to capture wage or wage changes of the food workers in the food processing chain outside Washington State. Many studies have shown that the food processing chain is largely global in its scope. Second, we did not have information on prepared foods and thus we cannot comment on whether prices were passed through at the store level. Third, these results may not be generalizable to other localities. Fourth, our data do not capture purchasing habits, food and beverage item consumption, nor health outcomes. However, these data do contribute to the limited research on the effects of minimum wage policies on supermarket food prices. Fifth, the price of items collected reflected the lowest non-discounted cost of food items, which may not reflect the true cost of food items for shoppers. However, this market basket is a validated tool based on the same method the US Bureau of Labor and Statistics uses to calculate national, regional and city-level CPI( Reference Drewnowski, Aggarwal and Hurvitz 37 , Reference Monsivais and Drewnowski 38 , 40 , Reference Block and Kouba 41 , Reference Monsivais, Mclain and Drewnowski 49 , Reference Monsivais, Aggarwal and Drewnowski 50 ).
While not statistically significant, the present study found that unprocessed or minimally processed foods had the greatest difference in price between affected and unaffected supermarkets at all three time points. This finding, while unrelated to the increase in minimum wage, is interesting in that it suggests that supermarkets set a wider range in price for unprocessed or minimally processed foods by supermarket chain location than other processed food categories. At the same time, these items changed the least in price between time points. Future studies should examine these relationships using larger samples and greater regional variation.
Conclusion
In conclusion, the current analysis finds no evidence of a pass-through effect of increased labour wages due to a city-wide minimum wage on supermarket food prices by level of food processing. Future data collection is planned to capture supermarket food prices after longer durations of MWO enactment to provide further insights. Future studies should look at the impact of an increase in minimum wage on supermarket food items by price elasticity. Future research on the effects of local minimum wages on supermarket food prices should examine a larger sample of supermarket food prices, as well as greater variety of chains (e.g. national, regional and local; single-site v. multi-site; union v. non-union).
Acknowledgements
Acknowledgements: The authors thank Anju Aggarwal, Wesley Tang and the Seattle Minimum Wage Study Team for their advice and support. Financial support: The work was supported by grants from the Laura and John Arnold Foundation (http://www.arnoldfoundation.org/grants/); and the City of Seattle (grant number OCA 2014–04 AM03). The Laura and John Arnold Foundation and the City of Seattle had no role in the design, analysis or writing of this article. Conflict of interest: None. Authorship: A.L.S.: acquisition of data, interpretation of the data, drafting the manuscript, final approval; J.H.B.: analysis of data, interpretation of the data, critical revision of the manuscript, final approval; A.D.: conceptual design, revision of the manuscript, final approval; M.C.L.: revision of the manuscript, final approval; J.J.O.: conceptual design, interpretation of the data, critical revision of the manuscript, final approval. Ethics of human subject participation: Not applicable.


