


Household food insecurity, or the uncertain availability of culturally appropriate foods, is a major public health issue in many areas of the world. In many seasonal subsistence communities, periods of food insecurity are highly localised temporally, and correspond to the period of time immediately prior to the harvest of food crops. These periods are typically associated with multiple indicators of stress, anxiety and poor physical health status, and in response households typically employ various strategies to cope with these periods of hardshipReference Goodman and Leatherman1–Reference Ulijaszek and Strickland3. These strategies and the economic determinants of food insecurity have been quite well studied. Less well studied are the non-economic or social determinants of seasonal food insecurity; this despite social scientists' widespread acknowledgment that social networks may be an important means by which food shortfalls are bufferedReference Adams4–Reference Lemke, Vorster, van Rensburg and Ziche6. As a step towards understanding the social correlates of food insecurity at the household level, the present paper examines the relationship between the occurrence of seasonal food insecurity and perceived social support among two Tanzanian ethnic groups living in an area where seasonal food insecurity is a perennial source of consternation and stress.
While the relationship between economic resources such as material assets and livestock holdings and the occurrence of seasonal food insecurity is well understood, there have been relatively few empirical investigations of the role of social support and food insecurity (for exceptions see references Reference Lemke, Vorster, van Rensburg and Ziche6 and Reference Frongillo, Valois and Wolfe7). Social support theorists categorise support into four qualitatively different types: emotional, companionship, informational and instrumentalReference Cohen, Underwood and Gottlieb8. It is instrumental support, which involves practical help when necessary, that is most relevant as a potentially protective factor against food insecurity because individuals can call upon these social resources during periods of food stress or anxiety. Anthropologists have also called attention to the protective role that a support network can have on household well-being, and in particular have highlighted the protective nature of social networks and food and asset transfersReference Cashdan9–Reference Sear, Mace and McGregor13. Moreover, ethnographic data from developing (and some developed) settings strongly suggest that during periods of food scarcity people call on their friends and neighbours for assistance. Indeed, there is a longstanding notion in anthropology that in some settings networks and ‘having people’ are as important as, if not more so, than having material wealthReference Guyer10–Reference Sear, Mace and McGregor13.
Across many domains of temporary assistance, the effectiveness of calling on others is directly related to the ability of one's social network to actually provide appropriate assistance. If all other individuals within one's network are similarly facing high levels of food insecurity, then instrumental social support may not be efficacious. This may not hold true for other types of support, such as emotional or companionship, which might still be provided at high levels even in the face of very severe poverty. Instrumental support, however, may vary by population or community; individuals in poorer communities may enjoy less support and the support they have may be less effective. In contrast, wealthy communities may enjoy greater levels of support and when the support is needed it may be more effective. Thus, the level of wealth of a community will be an important predictor of the efficacy of instrumental support; and we suspect that individuals in wealthier communities will both report higher levels of instrumental support and enjoy greater returns on that supportReference Chen5, Reference DeRose, Messer and Millman14. Of course, the opposite may be true and greater levels of wealth may also lead to attempts to cut obligations to kin; some evidence for this comes from our own study siteReference Hadley12.
In this paper we use an adapted version of the Coping Strategies Index (as described by Maxwell et al. Reference Maxwell, Ahiadeke, Levin, Armar-Klemse, Zakariah and Lamptey15) as a means to identify and quantify food insecurity. We then test hypothesised relationships between the scale and measures of ethnicity, material wealth, livestock and social support. We also assess whether social support is more efficacious among wealthier communities. Finally, we test whether mothers' self-perceived health status and two measures of current dietary intake are related to past household food insecurity.
Methods
Description of the study site
Like many countries in sub-Saharan Africa, Tanzania suffers a tremendous burden of food insecurity with 44% of its children suffering from hunger and its sequelae16. The Rukwa region, where this study took place, is one of Tanzania's poorest and is characterised by limited infrastructure and heavy reliance on subsistence farming. Few villages in the region have electricity, most roads are dirt roads, and access to markets to sell crops is limited by the distance to towns and lack of transport. The study area is also marked by heavy rains beginning in November and ending in March; the agricultural schedule closely follows these rains and culminates in the harvest of maize in June or July. Preparation of fields and intense weeding begins in October and continues through to December and is coincident with declining food stocks. The period between January and March is a time of frequent but less intensive labour and reduced food availability, as the food stocks from the prior harvest have been depleted, and consequently many households experience food insecurity which in turn leads to considerable anxiety and stressReference Hadley17, Reference Wandel and Holmboe-Ottesen18.
This study represents a continuation of our previous work in the Rukwa region, encompassing over 40 months of residence and research by the authors and including extended periods of participant observation during all seasons. During the wet season, but very rarely in the dry, individuals were repeatedly observed to be struggling, as evidenced by persons seeking loans from others, selling their labour for food and complaining of their children going to bed hungry. Among some households, individuals woke each morning and began a day-long search for affordable food or to exchange their labour for food. In addition to this participant observation, we have also carried out household surveys and more than 14 rounds of anthropometric measurements that fall across the two seasons. This previous mixed-methods research is therefore the foundation for our baseline assumptions about the interplay of seasonal food insecurity and social support, and how these might vary by community wealth and ethnicity.
The two numerically dominant ethnic groups in the area are the Pimbwe and the Sukuma. The Pimbwe are a group of horticulturalists living in monogamous households of four to six with varying numbers of non-nuclear family relatives attached. Pimbwe households are closely spaced in densely settled villages. Crop portfolios for Pimbwe households typically include maize and peanuts, although millet and some cash crops (tobacco and sunflowers) are also planted. Many households also keep chickens, ducks and (more rarely) a small number of goats. Cattle-keeping among the Pimbwe is extremely rare, although it is practised by a large proportion of their agropastoralist neighbours, the Sukuma. The Sukuma agropastoralists have moved into the Rukwa valley in waves over the last three decades and are culturally and economically distinct from the Pimbwe. Occupying the areas surrounding Pimbwe villages, they live in large compounds frequently comprising of a father, his sons and their wives. These compounds vary in the number of members, but are typically larger than Pimbwe households. For a variety of historical reasons and owing to more diverse crop portfolios, Sukuma households also score higher on measures of assets, land ownership and food productionReference Hadley17, Reference Holmes19. Our previous work also shows that the Sukuma are less likely to report being food-insecure during the pre-harvest ‘hunger’ season and, as expected, are less likely to report not having enough food, having to sell assets to purchase foods or having to go in search for food (often in exchange for labour)Reference Hadley17. Based on our earlier work, which included the observation that Sukuma households appear to be particularly pro-socialReference Paciotti and Hadley20, we sought to examine whether social support might be an important factor in buffering households through the wet season. Earlier research additionally shows that Sukuma children at every age are heavier and taller than their Pimbwe counterparts, large numbers of whom show evidence of chronic undernutrition (stunted and underweight >25%).
Sample
For the present study, a sample of 208 women who had not participated in our previous research was randomly selected from three neighbouring villages in the Rukwa region of Tanzania. Women were eligible to participate in the study if they had a child under the age of 3 years. Once identified, households were visited, verbal consent was obtained, and questionnaires were administered in face-to-face interviews by trained local research assistants. The study was carried out between August and September 2004 representing the post-harvest season, a period usually characterised by sufficient food supplies. All study procedures were approved by the Brown University Institutional Review Board and the Tanzanian Science Commission (COSTECH). Participants received a small gift for their participation in the study. In addition to standard questions on sociodemographics, the questionnaire was used to collect information on the following variables.
Wealth measures
We included multiple measures of wealth in the questionnaire to ensure that we adequately captured this construct. Measures of wealth included: number of bags of corn harvested per person in the household, number of cows, goats, chickens and ducks in each household, and a measure of ownership of material goods (bike, wrist watch, radio, tin roof, plough). These latter material items were weighted based on the procedure outlined by Morris et al. Reference Morris, Carletto, Hoddinott and Christiaensen21 and summed to produce an asset score. The livestock data were summed and analysed as a single variable termed livestock.
Social support
In addition to the direct measures of wealth, a measure of instrumental support was created based on respondents' answers to the following questions; ‘For you, is it easy or difficult to borrow (1) a small amount of money (200 Tanzania shillings, equivalent roughly to $US 0.20), (2) a larger amount of money (1000 Tanzania shillings, $US 1.00), and (3) enough food to last for one month?’ Affirmative responses were then summed to create an ordinal variable that could take values between 0 and 3. Scores were reverse-coded so that high values were associated with greater instrumental social support.
Dietary intake
A food-frequency questionnaire was used to collect current dietary information. Measures of dietary intake were collected by asking mothers whether they had consumed a variety of foods over the last seven days, and if yes, how many in the last seven days they ate each item. Foods were selected for inclusion in the questionnaire based on their micronutrient (iron, zinc), protein and fat content. While this is not an exhaustive list of foods consumed in the study area, the measures enable calculation of indicators of dietary quality and probable fat intakeReference Neumann, Harris and Rogers22, Reference Ruel23. From these data we computed an indicator of animal-source food consumption by summing the number of days in the last seven that a mother reported consuming: fish (three types), chicken, goat, cow, other meats, and milk. As an additional indicator of fat consumption, we used the number of days in the last seven that a mother reported consuming cooking oil.
Health status
No objective measure of maternal health existed for this survey, so we relied on a subjective measure of health. Mothers were asked, ‘Do you think your health is better, the same, or worse than other mothers?’ Health (or ‘afya’ in Swahili) is well understood to mean an absence of illness. Answers were analysed as an ordinal-level variable.
Food insecurity scale
To assess the degree to which households were affected by food insecurity during the previous hunger season (January–May), mothers responded (retrospectively) to a seven-item scale that was constructed loosely following the guidelines explicated by Maxwell and colleaguesReference Maxwell, Ahiadeke, Levin, Armar-Klemse, Zakariah and Lamptey15, Reference Maxwell24. Maxwell describes the construction of a Coping Strategies Index, which consists of several frequently employed strategies for responding to short-term food shortages. To be valid, the approach relies heavily upon formative ethnographic research as a means to identify locally appropriate coping strategies used during periods of food insecurity. Once identified, these strategies can then be presented to respondents who in turn can respond how frequently they employed each strategy over a predefined period of time. Additionally, each item can be ranked in order of severity and responses can then be weighted so that greater weight is given to more severe measures. Items are then summed and the summed score represents the severity of food insecurity; the values are dimensionless and higher scores imply greater food insecurity.
For our construction of a coping index, seven strategies or responses to food insecurity were identified on the basis of our own extensive ethnographic and survey work in the areaReference Hadley17. These were: (1) consuming less preferred foods (e.g. sorghum instead of maize, maize instead of rice); (2) borrowing money from relatives; (3) borrowing money from friends; (4) selling labour for food or money to buy food; (5) gathering wild edible plants; (6) reducing the amount of food cooked; and (7) sitting the entire day without food. Mothers within households were asked, for each strategy, whether during the prior wet season they enacted each behaviour every day, on many days, on some days or never. Responses were then scored so that ‘never’ received a score of 1, ‘some days’ scored 2, ‘many days’ scored 3 and ‘every day’ scored 4. Two strategies, reducing the amount of foods consumed and sitting without food for an entire day, were weighted (1.5 and 2, respectively) to reflect the added severity of food stress that these responses implied. Weights were arbitrary, although consistent with our ethnographic work. Scores were reverse-coded so that greater values indicated increasing food insecurity. The continuous score was also divided into three categories which represent low, medium and high levels of food security. We did not use focus groups to rank the severity of these responses, as recommended by Maxwell, but rather relied on our own subjective ranking based on our ethnographic experiences in the study area.
Statistical analyses
Variables that failed to meet assumptions of normality were analysed using non-parametric methods such as Spearman's correlation, the Wilcoxon two samples test and the chi-square test. General linear models were also used to examine the independent effect of each factor while holding all other factors constant. The internal consistency and validity of the food insecurity scale were assessed by calculating Cronbach's α and by assessing predicted relationships between the summary scale and hypothesised predictors. Statistical analyses were carried out using SPSS release 11.0.1 (SPSS Inc.), and the 0.05 level was used as the criterion for statistical significance.
Results
Selected characteristics of the 208 households included in the study are shown in Table 1. Of these households approximately half were ethnically Sukuma, the other households were Pimbwe households. Households varied greatly in size, ranging from two to 21 occupants, although the mode was five people, about two of whom were children under the age of 5 years, and the average was about seven. Households also showed considerable variation in all measures of wealth. In terms of livestock, some households reported owning upwards of 200 cattle, goats and chickens. As predicted, evidence suggested that the Sukuma community was wealthier. Sukuma households had more livestock holdings (P < 0.0001), scored higher on the asset score (P = 0.037) and reported greater social support (P < 0.0001).
Table 1 Selected characteristics of study households
SD – standard deviation.
The food insecurity scale showed acceptable internal consistency and, in general, responses were consistent with expectations; for example, far more people reported never having to sit the whole day without food than reported having to frequently sit the whole day without food (Table 2). The value of Cronbach's α for the food insecurity scale in the entire sample was 0.79. Among the Sukuma ethnic group Cronbach's α was 0.73; among the Pimbwe it was 0.84. Given the relatively high values of Cronbach's αReference Streiner and Norman25, the items were summed and the overall summed score was used as a measure of food security. The mean ( ± standard deviation, SD) value of the food insecurity scale was 13.4 ± 4.6, and values ranged from 8.5 to 28 (lower scores denote greater food security). Not surprisingly, given the wealth differences described above, as a group the Sukuma scored significantly lower than the Pimbwe on the food insecurity scale, indicating greater household food security during the previous wet season (‘hunger season’). The mean ( ± SD) value for the Sukuma was 12.4 ± 4.3 and that for the Pimbwe was 14.4 ± 4.7 (P < 0.0001). Using the categorical measure of food insecurity, 50% of Sukuma households fell into the most food-secure category compared with 20% of Pimbwe households. At the other end of the distribution representing the most food-insecure households, 41% of Pimbwe households were present and only 27% of Sukuma households (χ2 = 19.6, P < 0.0001).
Table 2 Responses to the coping strategies index

Table 3 shows the Spearman's correlation coefficients between measures of wealth and the food insecurity scale for each ethnic group. The food insecurity scale was consistently and significantly associated with the multiple measures of household wealth. Households that scored higher on the material asset score (P < 0.0001), that had more livestock (P < 0.001) and that reported more bags of corn harvested per person in the previous season (P < 0.001) were more likely to have been food-secure during the prior wet season. To assess whether these associations were due to differences between ethnic groups in wealth holdings, three multivariate regression models were run that included an ethnic group term and each of the wealth measures. The results of these models were that the measures of wealth remained highly statistically associated with the food security score, even after allowing for the influence of ethnic group. Further analyses showed that total livestock holdings, per capita corn harvest and material assets were all significantly (P < 0.05) associated with food security within each ethnic group (Table 3).
Table 3 Bivariate correlations between measures of wealth and food insecurity in the previous wet season by ethnic group
*P < 0.05, **P < 0.01.
The measure of instrumental social support was also strongly associated with the food insecurity scale, and again this relationship held overall (r = − 0.48, P < 0.0001) and in both ethnic groups separately (Sukuma: r = − 0.60, P < 0.0001; Pimbwe r = − 0.28, P = 0.01; Table 3). Women with the lowest social support lived in households with a mean value of food insecurity of 16.5, whereas women with the highest levels of social support lived in homes with a mean food insecurity value of 10.4. The relationship between instrumental support and food security also held in a multivariate model that controlled for wealth holdings and ethnic group, showing an independent effect of instrumental social support (Table 4). As predicted, an additional interaction term between social support and ethnic group in this model was statistically significant (P < 0.001; food insecurity scores for the lowest and highest values of instrumental social support are plotted in Fig. 1), suggesting that the relationship between food insecurity and social support was modified by ethnic group. Sukuma households appeared to enjoy greater levels of food security as levels of social support increased. Livestock holdings and the interactions between ethnic group and livestock and material wealth were not significant and were removed from the model.
Table 4 Model predicting food insecurity score in the previous wet season (n=201, R 2=29%, F=16.19, P<0.001; seven cases excluded because of missing data)
SE – standard error.
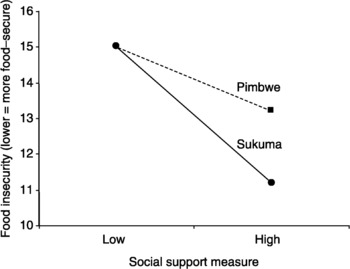
Fig. 1 Interaction between ethnic group, social support and past food insecurity
The food insecurity score was also associated with the two current measures of dietary intake. Women living in households with greater food security in the previous hunger season scored higher on the aggregate measure of animal-source food consumption (r = − 0.18, P = 0.01) and the weekly oil consumption measure (r = − 0.24, P < 0.001), indicating improved dietary quality and fat intake among households that were more food-secure. Animal-source food and oil consumption were also associated with material asset holdings (P = 0.001); per capita corn production and livestock holdings were associated with animal-source food consumption (P = 0.03) but not oil consumption. Within-group analyses, however, showed that while the relationship between oil consumption and food security held in both groups (Sukuma: r = − 0.28, P = 0.004; Pimbwe: r = 0.29, P = 0.003), there was no association between animal-source food consumption and food insecurity among the Pimbwe (r = − 0.085, P = 0.49).
A majority of women self-perceived their health as average, with only 27 women reporting their health as ‘better’ and 19 reporting their health as ‘worse’ than other mothers. There were no differences in the percentage of women within each ethnic group who self-perceived their health status as worse (χ2 = 0.0008, P = 0.93). Perceptions of health were, however, associated with the food insecurity scale (r = 0.14, P = 0.04) and with the social support measure (r = 0.19, P = 0.006), but not with material assets (r = 0.007, P = 0.92), corn production (r = − 0.094, P = 0.17) or livestock holdings (r = − 0.063, P = 0.36). Cell sizes were too small to perform within-group analyses.
Discussion and conclusions
There are four primary results of this work. First, in this area of rural Tanzania, food insecurity appears to affect a substantial portion of the population, although the burden of this seasonal hardship appears to fall disproportionately upon the Pimbwe; this confirms our earlier resultsReference Hadley17. Second, measures of material wealth and agricultural and livestock production are related in predictable ways to the occurrence of seasonal food insecurity. Third, and most interestingly, the measure of instrumental social support was strongly and independently associated with the occurrence of seasonal food insecurity, and appeared to be more protective among the wealthier community (the Sukuma). Fourth, mothers who reported experiencing greater food insecurity in the previous hunger season self-perceived their health as poorer and reported lower current consumption of animal-source foods and oil, which likely results in poorer dietary intake. These results have practical, methodological and theoretical implications.
Strengths of this study are the random sample, the reliance on ethnographic data to construct a food insecurity scale and inductively derive hypotheses, and the systematic assessment of the scale's internal consistency. Additional strengths are the multiple measures of wealth that were hypothesised to be associated with food insecurity. In particular, the examination of the relationship between social support and food insecurity makes a key contribution to our understanding of intra- and inter-population variation in food insecurity. Weaknesses of the study lie in the temporal nature of the data, specifically the fact that the seasonal food security data are not coincident with the measures of dietary intake, health and wealth. These latter issues raise important question about cause and effect. For instance, this cross-sectional and retrospective study design disallows us from concluding that seasonal food insecurity causes lower wealth and food insecurity. Although a limitation in some sense, most models of seasonal food insecurity do predict that relative impoverishment and poverty should predict past, current and future food insecurityReference Gittelsohn, Mookherji and Pelto26. An additional limitation lies in the rather crude measure of maternal health; while we hope to use more rigorous and objective measures in the future, it is noteworthy that food insecurity is associated with perceptions of poor health. Finally, there is overlap in the instrumental support measure and some items on the outcome measure of food insecurity (e.g. borrowing items). To examine whether this overlap was driving the results, we re-calculated the food insecurity scale without the inclusion of the two items on borrowing. Absent these items, the overall regression model remained virtually unchanged.
The food insecurity scale appears to be a valid measure of food insecurity at the village, ethnic group and individual household level. It showed not only adequate internal consistency, but also construct validity as expected on the basis of anthropological theory and our prior ethnographic expectations. Further, the tool was as effective as or more effective than traditional measures of wealth (e.g. corn produced per capita, asset holdings and livestock) in predicting mothers' perceptions of their health and their consumption of animal-source foods. Perhaps more importantly, as a measure of overall well-being, the tool matches more closely the construct of interest than do the traditional measures of wealth; while many participants remarked on their overall material deprivation, the stress and anxiety imposed by seasonal food insecurity was immediately apparent and a topic of daily conversation throughout much of the rainy seasonReference Hadley17. The tool additionally has external validity: our previous work also showed a higher degree of food insecurity among the Pimbwe ethnic group, as well as broad associations between measures of food insufficiency and measures of material wealth. That work, however, was based on a smaller and non-random sample and on different food security measures. Further, those measures may have been inappropriate as not all households may have been able to pursue the strategies mentioned. The finding that the scale presented in this paper is effective is an important one and suggests that this simple and easily administered tool may be useful for monitoring food insecurity in this highly seasonal environment. The study area is situated near a large national park and villagers will increasingly be the beneficiaries of community-based conservation programmesReference Borgerhoff Mulder27. These programmes, which will likely have as their core objectives both improving livelihoods and reducing poverty among villagers, should be aimed at reducing food insecurity. The tool outlined and tested in this paper suggests a means to target food-insecure households and to monitor the efficacy of such outreach programmes.
Most importantly, the results also indicate that instrumental support varies between ethnic groups in this area and that the different levels of support are associated with food insecurity. Bearing the cross-sectional nature of the study in mind, these results can be interpreted as supporting the hypothesis that during periods of need, or in the face of encroaching food insecurity, households may be called upon to collect resources. In some cases these resources appear to be sufficient to reduce the level of food insecurity. Interestingly, and as predicted, Sukuma women appear to not only have greater levels of instrumental support, but also appear able to capitalise on these resources to a greater degree. That is, at a given level of social support, Sukuma appear to be more effective at translating that support into food security. This is likely due to the higher levels of poverty among the Pimbwe, which affects all nodes of the network and subsequently reduces the efficacy of the network to effect change. In other words, calling on neighbours who are unable to offer help is unlikely to adequately buffer a household during times of need, whereas calling on individuals or households who have the resources to assist other households is likely to be more effective. This relationship appears to be quite general and it is hinted at in other studies from Asia, AfricaReference Adams4–Reference Lemke, Vorster, van Rensburg and Ziche6 and the USA. For instance, Henly et al. Reference Henly, Danziger and Offer28 used data from former and current welfare recipients in the USA to show that instrumental support among these low-income groups is unrelated to economic mobility, a finding that suggests individuals living in situations of poverty are unable to utilise their instrumental support to increase their economic position.
The notion that Sukuma women have more effective social networks to buffer them during periods of low food availability assumes that Sukuma women preferentially interact with Sukuma women and Pimbwe with Pimbwe women. Although we do not have any data from the current sample of women to formally test this hypothesis, there are pilot data from a previous study in this area that strongly support the notion that women's social networks are comprised almost exclusively of individuals from within the same ethnic group. In that pilot study, 47 of 48 Pimbwe women reported only Pimbwe in their social networks. Among the 36 Sukuma women interviewed, only three mentioned any Pimbwe in their social network. Sukuma social networks also comprised more individuals (Sukuma: 6.9 individuals; Pimbwe: 5.1, P < 0.0001). Interesting, and unexpectedly, most women reported several men, and often their husbands, in their networks, and these individuals were mentioned when women were asked who they would turn to if they need a small amount of money. Thus, while women from each ethnic group interact with one another on an almost daily basis, when asked about social support, they cite individuals from within their own ethnic group. That is, Pimbwe women call upon Pimbwe and Sukuma upon Sukuma during times of need.
Together, the results of this research suggest that greater levels of community wealth, indicated here as the wealth of each ethnic group, lead to lower food insecurity through both direct and indirect means. Greater levels of household wealth may indirectly influence the efficacy of social networks in buffering households during times of stress because they empower more nodes in a network to be in a position to actually help. This in turn might further reduce food insecurity by allowing households to seek aid during periods of short-term food insecurity. The results also suggest that past food insecurity is associated with current dietary intake, perceived health and wealth, which suggests that households may become locked into a cycle of poverty even though ‘hunger’ seasons are often of only limited duration. From a programmatic standpoint, this is encouraging because it suggests that buffering households during these relatively short periods of food insecurity might have far-reaching consequences.
Acknowledgements
Sources of funding: This research was funded through an award from NSF Cultural Anthropology to C.H. (#0412210).
Conflict of interest declaration: We declare that we have no conflicts of interest.
Authorship responsibilities: C.H. and M.B.M. conceived the study. C.H. was primarily responsible for writing and analysis with substantial inputs from M.B.M. E.F. oversaw data collection and pre-testing.


