


Populations are ageing throughout the world and this is accompanied by the rapid increase of very old populations aged 85 years or older( 1 ). Because of the vulnerability to age-related chronic diseases and disabilities among very old populations, the use of medical-care services by adults rises with age and per capita costs of health care are relatively high among older age groups. These costs are placing upward pressure on overall health-care spending. Preventing chronic and non-communicable diseases as well as the functional deterioration of very old populations is a major public health objective aimed at slowing the growing financial burden on societies( 1 ). Diet is one of the modifiable factors related to health. Understanding dietary habits and the relationship between diet and health conditions among very old populations is essential for providing dietary strategies focused on maintaining the health and independence of these individuals. However, information about dietary habits among very old populations throughout the world is still limited( Reference Mendonca, Hill and Granic 2 – Reference Bates, Prentice and Finch 8 ).
Japan has one of the highest percentages of older populations and is one of the most rapidly ageing countries in the world( 9 ). The size of the very old population (aged 85 years or older) in Japan was estimated to be 5·5 million (4·3 %) in 2017 and this is expected to continue increasing for some time in the future( 10 ). Clarifying dietary habits contributing to successful ageing for very old Japanese can potentially provide effective dietary strategies to health-care providers in other countries, which also face the challenges associated with an ageing population. However, few studies have examined the dietary habits of the very old population in Japan( Reference Takayama, Arai and Sasaki 11 , Reference Osawa, Arai and Takayama 12 ).
Dietary questionnaires can assess long-term dietary habits and are convenient for dietary surveys( Reference Willett 13 , Reference Cade, Burley and Warm 14 ). The brief-type self-administered diet history questionnaire (BDHQ) was developed to evaluate the dietary habits of Japanese adults( Reference Kobayashi, Murakami and Sasaki 15 , Reference Kobayashi, Honda and Murakami 16 ). The validity of the intakes of forty-two selected nutrients and twenty-nine food groups estimated by the BDHQ has been examined only among adult Japanese aged 31–76 years( Reference Kobayashi, Murakami and Sasaki 15 , Reference Kobayashi, Honda and Murakami 16 ). Meanwhile, the dietary assessment using questionnaires for very old populations poses many challenges because of magnified reporting error( Reference Tooze, Vitolins and Smith 17 ) possibly caused by both a decrease in cognitive function and systematic errors of calculation resulting from a lack of available data on portion sizes in this age group( Reference Adamson, Collerton and Davies 5 ). Therefore, the validity of the BDHQ for very old populations needs to be investigated. However, only one study has examined the validity of the BDHQ among very old Japanese, but only for two nutrients (i.e. EPA and DHA) using erythrocyte membrane phospholipid as a reference. That previous study showed a satisfactory correlation between the BDHQ and the biomarker for EPA (Spearman’s correlation coefficient=0·58 in men and 0·44 in women) and DHA (0·55 in men and 0·29 in women)( Reference Takayama, Arai and Sasaki 11 ). The validity of other nutrient and food intakes estimated by the BDHQ has yet to be examined among very old populations.
In Japan, the Tokyo Oldest Old Survey on Total Health (TOOTH) study( Reference Arai, Iinuma and Takayama 18 ) and the Septuagenarians, Octogenarians, Nonagenarians Investigation with Centenarians (SONIC) study( Reference Ryuno, Kamide and Gondo 19 ) are being conducted to demonstrate important perspectives on the health and well-being for old Japanese aged 80 years or older (the very old in the present study). These studies use the BDHQ to assess the dietary habits of the participants. Conducting a validation study for the intakes of comprehensive nutrients and foods estimated by the BDHQ among very old Japanese may advance TOOTH and SONIC studies and further epidemiological studies among very old populations in clarifying the relationship between diet and geriatric conditions such as frailty, osteoporosis and cognitive impairment. In the present study, we investigated the relative validity of nutrient and food group intakes assessed by the BDHQ among healthy very old Japanese compared with those assessed by a three-day, semi-weighed dietary record (DR).
Methods
Study population
The participants of the present study represented a portion of the participants aged 85 years or older from the TOOTH study( Reference Arai, Iinuma and Takayama 18 ) and the participants in their 80s or 90s from the SONIC study( Reference Ryuno, Kamide and Gondo 19 ). A detailed description of the study design and survey procedure of each original cohort study has been published elsewhere( Reference Arai, Iinuma and Takayama 18 , Reference Ryuno, Kamide and Gondo 19 ). For the present study, we recruited apparently healthy and community-dwelling TOOTH and SONIC participants living in Tokyo, which is the capital prefecture in Japan that includes urban and rural areas, at the 3- or 6-year follow-up survey for TOOTH (2012 or 2015) or at the 3-year follow-up survey for SONIC (2014). We asked the participants to conduct a three-day, non-consecutive semi-weighed dietary record, a one-time diet history questionnaire, and five to fourteen consecutive days of accelerometer wearing (Fig. 1). Although about half of the recruited participants declined to participate, a total of eighty participants (thirty-six men and forty-four women; forty-two from TOOTH and thirty-eight from SONIC) aged 82–94 years participated in the present study. For these participants, the mean score at baseline (3 or 6 years before the present study) of the Barthel index (BI) was 99·4 (sd 2·5), that of the Mini-Mental State Examination (MMSE) was 27·7 (sd 2·5) (n 42 from TOOTH; Y Arai, unpublished results, 2017) and that of the Japanese version of the Montreal Cognitive Assessment (MoCA-J) was 23·1 (sd 3·1) (n 38 from SONIC; Y Masui, unpublished results, 2017).
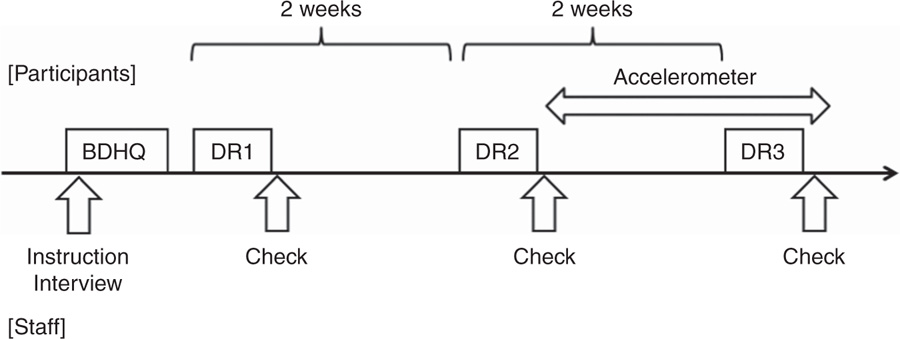
Fig. 1 Schedule for the present validation study (BDHQ, brief-type self-administered diet history questionnaire; DR, semi-weighed dietary record)
Three-day semi-weighed dietary record
Between June and August 2012 or between June 2015 and February 2016, the participants completed a non-consecutive, three-day DR at two-week intervals (Fig. 1). All of the recording days were weekdays. On the day prior to the first recording day, the research staff, including registered dietitians or nutritionists, visited each participant’s home to provide instruction on the whole survey protocol and dietary record. The research staff supplied the participants with recording sheets and a sample of a completed record and provided face-to-face verbal and written instructions on how to record the diet. Each participant was given a digital scale (model KD-812; Tanita, Tokyo, Japan; ±2 g precision for 0–500 g and ±3 g precision for 501–2000 g), taught how to assign weights to all foods and drinks consumed on the recording day, and asked to record them. If the participants did not cook for themselves, they were advised to request assistance from the person who usually prepared their meals consumed in their home (e.g. their spouse, adult child or helper). When assigning weights was difficult (e.g. when eating out), they were instructed to record the size and quantity of the food eaten using household approximations in as much detail as possible. On the day following each recording day, the research staff revisited the participant’s home to check the dietary record (Fig. 1). The staff reviewed the record and asked the participant to add to or modify the record if necessary.
All collected records were further checked by the research staff at the data centre. If necessary, the staff asked the participant to clarify unclear records by telephone or through an in-home visit. The keeping of records and the conversion of other measurements of quantities into grams were performed by trained dietitians at the survey centre in accordance with uniform procedures. A total of 969 food and beverage items appeared in the whole data of the dietary record.
Brief-type self-administered diet history questionnaire
All participants answered the BDHQ on the day prior to the first DR recording day after receiving instructions on the dietary record procedures (Fig. 1). The staff read through the BDHQ and wrote down the verbal responses obtained from each participant.
The BDHQ is a four-page, fixed-portion questionnaire that asks about the consumption frequency of selected foods, but not about portion size, to estimate the dietary intake of fifty-eight food and beverage items during the preceding month. To facilitate reading and completion for the elderly, we used a large-print version, which increased the size to ten pages but that contained no other changes to structure or content. Details of the BDHQ’s structure, method of calculating dietary intake, and validity for food group and nutrient intakes among the adult population (31–76 years) have been described elsewhere( Reference Kobayashi, Murakami and Sasaki 15 , Reference Kobayashi, Honda and Murakami 16 ). Briefly, the BDHQ consists of the following five sections: (i) intake frequency of food and non-alcoholic beverage items; (ii) daily intake of rice and miso soup; (iii) frequency of drinking and amount per drink for alcoholic beverages; (iv) usual cooking methods; and (v) general dietary behaviour. Food and beverage items contained in the BDHQ were selected from foods commonly consumed in Japan, mainly from a food list used in the National Health and Nutrition Survey of Japan( 20 ), while standard portion sizes were derived from several recipe books for Japanese dishes( Reference Kobayashi, Murakami and Sasaki 15 , Reference Sasaki, Yanagibori and Amano 21 ). Information on dietary supplements was obtained only for total frequency of use, without specific names or types and quantity of the supplements. Estimates of the intake for fifty-eight food and beverage items were calculated using an ad hoc computer algorithm for the BDHQ( Reference Kobayashi, Murakami and Sasaki 15 ).
Other variables
When the research staff visited the participants’ homes to provide instruction for the DR, in-home interviews were conducted during which the staff asked the participants about their living arrangements (living alone or living with others). Once the interviews were complete, the staff took in-home body weight measurements of the participants wearing light clothing and no shoes. The participants provided information about their date of birth, alcohol intake and dietary supplement use in the BDHQ. The participants had also been wearing a triaxial accelerometer (model Active style Pro HJA-350IT; Omron Healthcare, Kyoto, Japan) on the waist for five to fourteen consecutive days between the second and third DR (Fig. 1). The number of daily steps (steps/d) was summed over valid days and a mean value was calculated using the data from the accelerometer. Data for participants with at least three valid wear-days and at least eight hours of wear-time per day were included in the analysis. The individual body height measured at the previous follow-up survey, the proportion of past or current smoking status (yes or no) at baseline and the proportion of history of chronic disease (e.g. hypertension, diabetes mellitus, hyperlipidaemia, fragility fracture, cancer other than skin, stroke, heart diseases and renal diseases (yes or no)) at baseline were obtained from the original study (Y Arai, unpublished results, 2017). BMI was calculated as body weight divided by the square of body height (kg/m2).
Statistical analysis
All statistical analyses were conducted using the SAS statistical software package version 9·4.
Intake values of energy and selected nutrients were estimated based on the intakes of food items obtained from the DR or the BDHQ and the corresponding food composition list in the Standard Tables of Food Composition in Japan ( 22 ). In both the DR and the BDHQ, nutrients derived from dietary supplements were not included in the present study. For foods, we categorized the food groups according to the previous study( Reference Kobayashi, Murakami and Sasaki 15 ).
In consideration of reporting errors, energy-adjusted intakes, as well as crude values, were also calculated by the residual and density methods. The Shapiro–Wilk test for normality showed that almost all crude and energy-adjusted intakes of nutrients and food groups estimated by the DR and the BDHQ had non-normal distribution (about 72 % for nutrients and 94 % for food groups). Therefore, we used the non-parametric test in evaluating the validity for the BDHQ. We evaluated the relative validity of the BDHQ in terms of two abilities. One of the abilities is to estimate median values of a population, using the Wilcoxon signed-rank test. The median and interquartile range (IQR) were shown for dietary intakes estimated by the DR and the BDHQ. The result of P<0·05 for the test was considered to indicate a significant difference between the intakes estimated by the BDHQ and those by the DR. The other is the ability to rank the individuals in a population according to dietary intakes, using Spearman’s correlation coefficients between the intakes estimated by the DR and the BDHQ. Further, we evaluated the agreement for energy and macronutrient intakes between the DR and the BDHQ at the individual level as reference using Bland–Altman plots( Reference Bland and Altman 23 ).
Results
The mean age of the eighty participants, including thirty-six men (45 %) and forty-four women (55 %), was 87·2 (sd 3·5) years and their mean BMI was 22·4 (sd 3·4) kg/m2 (Table 1). A total of thirty-nine participants (49 %) lived alone (19 % for men and 73 % for women). The percentages of past or current smoker, alcohol drinker and dietary supplement user were all 40 %. Daily energy intake ranges were 4·24–13·6 MJ for the DR and 4·00–16·1 MJ for the BDHQ (data not shown). We included all eighty participants in the following analyses. We also describe the baseline characteristics of the original cohort of TOOTH (n 542) and SONIC (n 965) in Table 1 by referring to previous studies( Reference Arai, Iinuma and Takayama 18 , Reference Ryuno, Kamide and Gondo 19 , Reference Arai, Martin-Ruiz and Takayama 24 ) and unpublished results. Similar values were observed for BMI (mean of 21·4 kg/m2 for TOOTH and 22·4 kg/m2 for SONIC), past or current smoker (38 % for TOOTH and 40 % for SONIC) and alcohol drinker (34 % for TOOTH and 31 % for SONIC) between the present participants and the original cohort. The mean percentage of the history of eight chronic diseases for the participants was 21 %, while the respective value was 25 % for TOOTH. The mean scores of BI, MMSE and MoCA-J among the original cohort in the previous publications were 97·1, 26·2 and 21·8, respectively.
Table 1 Selected characteristics of the eighty very old Japanese participants (aged 80 years or older) and comparison with those of the original cohort of the TOOTH and SONIC studies
TOOTH, Tokyo Oldest Old Survey on Total Health study; SONIC, Septuagenarians, Octogenarians, Nonagenarians Investigation with Centenarians study; MMSE, Mini-Mental State Examination; MoCA-J, Japanese version of the Montreal Cognitive Assessment; DR, three-day semi-weighed dietary record; BDHQ, brief-type self-administered diet history questionnaire.
† All values were obtained at the time of the validation study unless otherwise stated; n 76 (thirty-three men and forty-three women) for daily steps. The values of the Barthel index and MMSE (n 42 (twenty-one men and twenty-one women (TOOTH)); Y Arai, unpublished results), MoCA-J (n 38 (fifteen men and twenty-three women (SONIC)); Y Masui, unpublished results) and history of chronic disease (Y Arai, unpublished results) shown were at baseline of the original cohort.
‡ Values of TOOTH presented were from Arai et al.( Reference Arai, Iinuma and Takayama 18 ) for age, sex, Barthel index and MMSE (n 542) and living arrangements (n 538); from Arai et al.( Reference Arai, Martin-Ruiz and Takayama 24 ) for past or current smoker and history of chronic disease (n 536); and from Y Arai (unpublished results) for BMI, alcohol drinker and dietary supplement user (n 513). Distribution for the age groups was n 496 (91·5 %) for 85–89 years, n 38 (7·0 %) for 90–94 years, n 6 (1·1 %) for 95–99 years and n 2 (0·4 %) for ≥100 years. The value for heart disease presented was from coronary heart disease.
§ Values of SONIC presented are those for the participants aged 80 years from Ryuno et al.( Reference Ryuno, Kamide and Gondo 19 ). Age range is shown.
Energy intake as determined by the BDHQ was significantly lower than that determined by the DR (Table 2). Spearman’s correlation coefficient for energy intake estimated by the DR and the BDHQ was 0·58. A total of forty-three energy-adjusted nutrient intakes for the DR and the BDHQ using the residual method are also described in Table 2. The intakes of twenty-one (49 %) nutrients differed significantly between the DR and the BDHQ. The median value of Spearman’s correlation coefficient was 0·39 (IQR 0·33–0·47). For retinol and cryptoxanthin, the intakes estimated by the BDHQ were not significantly correlated to those estimated by the DR. For nutrients in the crude and energy-adjusted values as determined by the density method, similar results were obtained (see online supplementary material, Supplemental Table 1). The number of nutrients whose intakes differed significantly between the DR and the BDHQ was seventeen (40 %) for the crude and thirty (70 %) for the density methods. The median value of Spearman’s correlation coefficients for the nutrients was 0·46 (IQR 0·37–0·50) for the crude and 0·39 (IQR 0·34–0·46) for the density methods.
Table 2 Daily energy and energy-adjustedFootnote † nutrient intakes and Spearman’s correlation coefficients estimated by the three-day semi-weighed dietary records (DR) and the brief-type self-administered diet history questionnaire (BHDQ) among the eighty very old Japanese men and women (aged 80 years or older), June–August 2012 and June 2015–February 2016
IQR, interquartile range.
Significant differences between the DR and BDHQ: *P<0·05, **P<0·01, ***P<0·001 (Wilcoxon signed-rank test).
† Energy adjustment was performed according to the residual method.
‡ Sum of EPA, DPA (docosapentaenoic acid) and DHA.
§ Sum of retinol, β-carotene/12, α-carotene/24 and cryptoxanthin/24.
║ Sum of β-carotene and α-carotene/2 and cryptoxanthin/2.
Twenty-seven food group intakes estimated by the DR and the BDHQ using the residual method are shown in Table 3. For a total of fifteen (56 %) food groups, the intakes estimated by the BDHQ differed significantly from those estimated by the DR. The median Spearman’s correlation coefficient between the intakes estimated by the DR and the BDHQ was 0·48 (IQR 0·39–0·55), as estimated by the residual method. Only the intakes of sugar estimated by the DR and the BDHQ were not significantly correlated. Similar results were obtained from crude values and energy-adjusted values as estimated by the density method (see online supplementary material, Supplemental Table 2). A total of fourteen (52 %) food group intakes in crude values and thirteen (48 %) food group intakes in energy-adjusted values using the density method differed significantly between the DR and the BDHQ. For Spearman’s correlation coefficient between the DR and the BDHQ, the median value was 0·47 (IQR 0·38–0·56) for the crude and 0·45 (IQR 0·36–0·54) for the density methods. We also examined the validity of the BDHQ among thirty-six men and forty-four women, separately (data not shown). The number of nutrients for which intakes differed significantly between the DR and the BDHQ was more in men than in women. The number of foods in men was almost the same as that in women. For the Spearman’s correlation coefficient, the median values of men tended to be higher than those of women for both nutrient and food intakes.
Table 3 Daily energy-adjustedFootnote † food group intakes and Spearman’s correlation coefficients estimated by the three-day semi-weighed dietary records (DR) and the brief-type self-administered diet history questionnaire (BHDQ) among the eighty very old Japanese men and women (aged 80 years or older), June–August 2012 and June 2015–February 2016
IQR, interquartile range.
Significant differences between the DR and BDHQ: *P<0·05, **P<0·01, ***P<0·001 (Wilcoxon signed-rank test).
† Energy adjustment was performed according to the residual method.
The Bland–Altman plots for energy and macronutrients are shown in Fig. 2 and the online supplementary material, Supplemental Fig. 1. Poor agreement was observed for the intakes of energy and each nutrient at the individual level.
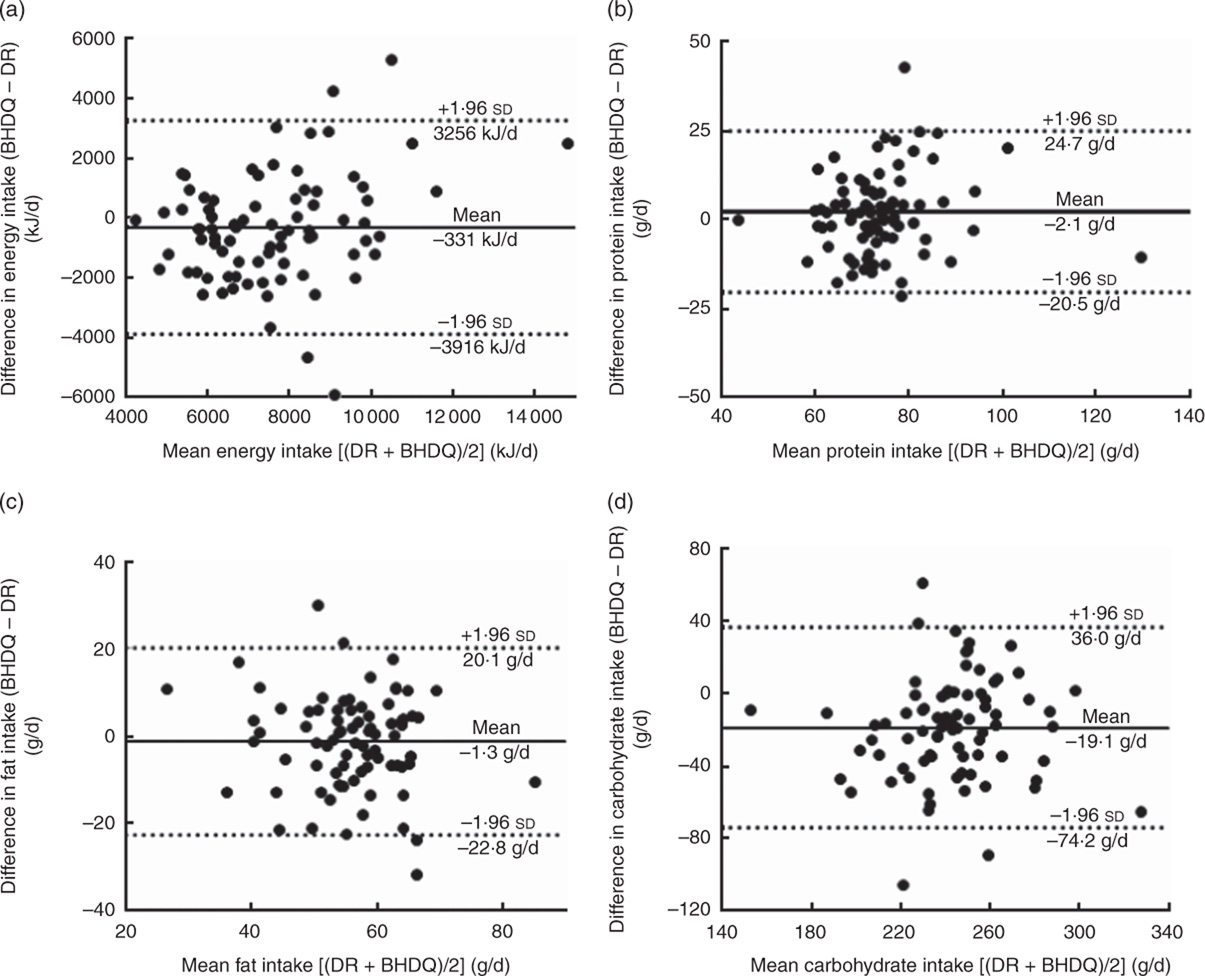
Fig. 2 Bland–Altman plots for agreement between energy and energy-adjusted macronutrient intakes estimated using the three-day semi-weighed dietary records (DR) and the brief-type self-administered diet history questionnaire (BDHQ) among eighty very old Japanese men and women (aged 80 years or older), June–August 2012 and June 2015–February 2016. The difference in intake between the two methods is plotted v. the mean intake from the two methods for: (a) energy; (b) protein; (c) fat; (d) carbohydrate. —— represents the mean difference (bias) and · · · represent the limits of agreement. Energy adjustment was performed according to the residual method
Discussion
The present study examined the relative validity among very old Japanese of the intakes of energy, forty-three nutrients and twenty-seven food groups as estimated by the BDHQ by comparing these values with the three-day DR as a reference. Relatively acceptable correlations were obtained for both nutrient and food group intakes between the DR and the BDHQ. The BDHQ may have the potential to rank individuals regarding dietary intakes among very old populations. Meanwhile, the intakes of approximately half (40–70 %) of the nutrients and food groups estimated by the BDHQ were significantly different from those estimated by the DR. For some nutrients and food groups, it may be difficult to use the BDHQ to accurately estimate representative intakes among very old Japanese populations as well as among adults aged 31–76 years( Reference Kobayashi, Murakami and Sasaki 15 , Reference Kobayashi, Honda and Murakami 16 ).
The median values of Spearman’s correlation coefficient were 0·39–0·46 for nutrients and 0·45–0·48 for food groups. Regarding the food groups, a previous study showed that the median values of Spearman’s correlation coefficient for adults were 0·48 for men and 0·44 for women( Reference Kobayashi, Murakami and Sasaki 15 ). The present study among the very old population showed median correlation values comparable to those of middle-aged adults. There are several reasons why the correlation between the BDHQ and the DR for very old populations was comparable to that for middle-aged adult populations. First, all our participants may be very healthy and active according to daily steps( Reference Tudor-Locke, Craig and Aoyagi 25 ). The food portion sizes consumed by our participants, as derived from the DR, might have little variety. Second, our participants might be sufficiently able to recall their diet during the preceding month. Although the MMSE or MoCA-J values for our participants were 3 or 6 years old, the values were relatively higher than those obtained from other studies among community-dwelling, very old Japanese( Reference Narazaki, Nofuji and Honda 26 , Reference Sakuma, Ura and Miyamae 27 ). Our participants might answer the BDHQ and conduct the DR with an appropriate level of consistency. Third, our participants answered the BDHQ verbally. This prevented the participants from becoming either tired or bored when answering the BDHQ. Further, verbal and courtesy questions from the staff may have helped the participants answer the BDHQ accurately. Meanwhile, for nutrient intakes, the median values of Spearman’s correlation coefficient among our participants (0·39–0·46) might be slightly lower than the medians of Pearson’s correlation coefficient in the previous validation study of adults (0·34–0·51 for men and 0·40–0·49 for women)( Reference Kobayashi, Honda and Murakami 16 ). These results may imply that different kinds of food items may be consumed by middle-aged Japanese and very old Japanese even if the same food groups were consumed. Unfortunately, these different correlation coefficients (i.e. Spearman’s and Pearson’s) could not be simply compared.
We compared the present results with those of previous validation studies that targeted very old populations. However, these studies included not only participants aged 80 years or older but also those aged 60–80 years( Reference Rosilene, Cumming and Travison 28 – Reference Ortiz-Andrellucchi, Sanchez-Villegas and Doreste-Alonso 35 ). One review study, where most of the participants were aged 65 years or older, defined the mean correlation coefficient values for micronutrients of 0·30–0·50, 0·51–0·70 and >0·7 as acceptable, good and very good correlation, respectively( Reference Ortiz-Andrellucchi, Sanchez-Villegas and Doreste-Alonso 35 ). In applying the same definition, our present study showed that almost all macronutrients had acceptable (82–88 %) or good (12–18 %) correlation. Many of the micronutrients (54–77 %) achieved acceptable correlation and 15–19 % nutrients achieved good correlation. Most of the food groups showed acceptable (48–52 %), good (33–41 %) or very good (0–4 %) correlation. These results may indicate that the BDHQ is useful for ranking in terms of most of the dietary variables. However, the correlation coefficients of some micronutrients, such as retinol, vitamin D, cryptoxanthin and thiamin, were low. We should treat the intakes of these nutrients estimated from the BDHQ carefully in an epidemiological study.
For food group intakes in the present study, the intakes of bread, potatoes and confectioneries estimated from the BDHQ were significantly higher and those of rice and sugar were significantly lower compared with the DR. Meanwhile, energy and carbohydrate intakes estimated from the BDHQ were lower than the DR estimates, although bread, potatoes and confectioneries were assumed to be high-energy-density foods. Since rice is the first contributor of energy (35 % for men and 29 % for women) and carbohydrate (55 and 43 %) among the Japanese population( Reference Sasaki, Takahashi and Iitoi 36 ), the low estimation of rice from the BDHQ may affect the low estimation for energy and carbohydrate from the BDHQ. Further, the BDHQ estimated fruit and vegetable intakes to be reasonably consistent with those from the DR. However, many of the micronutrients did not estimate well from the BDHQ. To estimate dietary intakes among very old Japanese by the BDHQ more accurately in the future, determining the portion size of rice and reconsidering the food code assigned to food items in the BDHQ might be the most immediate priorities.
The strength of the present study was that we conducted multiple semi-weighed DR with a very old population aged 80 years or older. To collect dietary information from the participants as accurately as possible, the research staff visited each participant’s home on the day following each recording day, reviewed the record and asked for clarification on unclear points face-to-face.
Several limitations of the present study warrant mention. First, our participants might be extremely healthy. Daily steps and the cognitive function of our participants may be relatively high compared with other very old, community-dwelling Japanese( Reference Tudor-Locke, Craig and Aoyagi 25 – Reference Sakuma, Ura and Miyamae 27 ). Further, the participants may have high health consciousness, given that all of them completed this time-consuming survey. Therefore, the results obtained from the present study cannot be readily extrapolated to the general very old Japanese population. However, the scores of the BI, MMSE and MoCA-J, and the prevalence of the history of chronic diseases did not differ significantly from those of the original cohort of TOOTH and SONIC, although our participants may be slightly healthier than the participants of the original cohort. These results may indicate that the BDHQ can be used not only for the present participants but also for those in the original TOOTH and SONIC studies. Second, we mainly conducted analysis using the combined data of men and women, not by sex, because the number of participants was not large enough( Reference Fukumoto, Asakura and Murakami 37 ). However, we examined the validity of the BDHQ for energy-adjusted intakes as well as crude intakes. Although men had higher energy intakes than women, the effect of the different energy intake by sex was attenuated by using energy-adjusted values in the present study. Further, many other validation studies for dietary questionnaires among elderly populations used combined data of men and women and examined a similar number of subjects( Reference Shatenstein and Payette 30 – Reference Mitchell, Tucker and Maras 32 , Reference Henn, Fuchs and Moreira 34 , Reference Ortiz-Andrellucchi, Sanchez-Villegas and Doreste-Alonso 35 ). These results may provide support for our methods of analysis as acceptable and valid. Although we also examined the validity of the BDHQ by sex as reference, we thought that more participants were needed to conclude the sex-specific result. Third, in the present study, our participants answered the BDHQ verbally. This method may help our participants answer the BDHQ easily and in a more focused manner. If the participants wrote down the answers to the questionnaire by themselves, the validity of the BDHQ may be lower. Fourth, we used the DR as a reference and assumed that dietary intakes derived from the DR were accurate. Although the relative validity in the present study relied on the extent to which the DR is accurate, a DR is susceptible to measurement error because of erroneous recording and potential changes in eating behaviour. However, errors in the DR are thought to have lower correlation with errors in the BDHQ compared with other dietary assessment methods that rely on memory( Reference Willett 13 ). Further, family’s or helper’s support to record the DR (about thirty participants) and our face-to-face checking of records on the day following each recording day may have been helpful in obtaining accurate dietary information of our participants. Meanwhile, biomarkers are a better standard for some nutrients and any errors in such markers are independent of errors in the questionnaires. A validation study for some nutrients using 24 h urine collection as a reference among very old Japanese is also needed in the future. Fifth, we did not consider the supplement intakes in calculating nutrient intakes from the DR and the BDHQ. Although the BDHQ asks about the use of dietary supplements, the types and the quantity of the supplements were not queried. Even if the BDHQ asks about supplement intake, we cannot consider the intake of supplements in the calculation because of a lack of a reliable food composition table for dietary supplements in Japan. A previous study showed that the omission of dietary supplements might alter the estimation of nutrient intakes among elderly populations( Reference Fabian, Bogner and Kickinger 38 ). The intakes of some nutrients described in the present study might therefore be underestimated. Also, the validity of the BDHQ for some nutrients might have been altered if nutrient intakes derived from dietary supplements were added to the DR. Sixth, because of no reliable data on the food portion size among very old populations, the BDHQ calculated dietary intakes using general adult portions. This may make it more difficult to estimate accurate dietary intakes among very old populations than among other age groups of adults. Finally, we conducted the DR for only three days. A previous study showed that estimating usual intakes among adults with 95 % CI with a deviation within 20 % required measurements for more than three days for almost all nutrients( Reference Fukumoto, Asakura and Murakami 37 ). A long-term DR is therefore more appropriate for reference. However, a three-day DR was thought to be more feasible because of the considerable burden placed on very old participants for recording such information. Meanwhile, seasonality on the validity of the BDHQ was not considered in the present study. However, the seasonality of the validity of a comprehensive diet history questionnaire (DHQ), from which the BDHQ was developed, showed that to rank individuals by nutrient intake is acceptable for epidemiological studies regardless of season, even though the estimated nutrient intakes in one season should not be interpreted as yearly average intakes( Reference Suga, Asakura and Sasaki 39 ). That previous study might be helpful for interpreting the seasonality of the BDHQ.
Conclusion
In conclusion, the present study showed that the BDHQ provided acceptable Spearman’s correlation coefficients for the intakes of nutrients and food groups examined, using a three-day DR as a reference, among the very old participants who participated in the TOOTH and SONIC studies. The present results indicated that the BDHQ is a good candidate for dietary assessment in epidemiological studies among very old Japanese. Meanwhile, accurate median dietary intakes among the population could not be estimated for some nutrients and food groups, which is one of the present limitations for usefulness of the BDHQ. Reconsidering food portion size to calculate dietary intakes in the BDHQ is necessary when estimating dietary intakes accurately among the general very old population. Further efforts to enhance the validity of the BDHQ for very old populations are needed.
Acknowledgements
Acknowledgements: The authors would like to thank all the participants for their participation in this time-consuming research. They would also like to express their appreciation for the support of the dietitians on the research staff: Chisa Katsuragi, Nana Kimoto, Nanako Koe, Kazuyo Shozawa, Yuko Sunami and Tomono Yahata. Financial support: This study was supported by a grant from the medical–welfare–food–agriculture collaborating consortium project from the Japan Ministry of Agriculture, Forestry, and Fisheries, and a grant from the Foundation for Total Health Promotion. The funding agencies had no role in the design, analysis or writing of this article. Conflict of interest: Y.Ar. received research grant funding from Daiichi-Sankyo Company, Limited, a pharmaceutical company. The funder did not provide the grant to this article and had no role in the design, analysis or writing of this article. The remaining authors declare that they have no financial disclosures. Authorship: S.S. designed and directed the study. Y.O., T.H., M.T., Y.Ar., Y.M. and T.I. contributed to the coordination of the fieldwork and recruitment for the study. S.K. and Y.O. arranged the fieldwork. S.K., Y.O., T.H., M.T. and Y.Ar. conducted fieldwork and data collection. S.K. and X.Y. performed the statistical analyses. Y.Ab., Y.Ar. and Y.M. supported data analyses. S.K. drafted the manuscript. All authors provided input into the final draft of the manuscript. Ethics of human subject participation: The protocol of this study was approved by the Ethics Committee of the Keio University School of Medicine (approval number 2011276; approved on 26 December 2011), the University of Tokyo Faculty of Medicine (approval number 10828; approved on 12 June 2015) and the Tokyo Metropolitan Geriatric Hospital and Institute of Gerontology (approval number H27-18; approved on 9 July 2015). Written informed consent was obtained from all participants.
Supplementary material
To view supplementary material for this article, please visit https://doi.org/10.1017/S1368980018002331


