The Universal Declaration of Human Rights declared the right to food one of the most basic human rights(1). This statement is profound, yet many in the USA take this right for granted(Reference Fitchen2). Many US residents are regularly unable to obtain an adequate diet. As of 2004, food insecurity had increased for five consecutive years to 13·5 million US households (11·9 %), with 4·4 million US households (3·9 %) experiencing food insecurity with hunger(Reference Nord, Andrews and Carlson3).Footnote † In 2005, the rate of food insecurity decreased to 11·0 %, although the hunger rate remained unchanged(Reference Nord, Andrews and Carlson7), and rates for 2006 were essentially the same (10·9 % food-insecure, 4·0 % hunger)(Reference Nord, Andrews and Carlson8).
Food insecurity can have harmful health consequences due to undernutrition or overnutrition with unhealthy foods, leading to overweight and obesity(Reference Cook9, Reference Vozoris and Tarasuk10). Overweight and obesity are linked to cancer, diabetes and CVD(Reference Klein, Burke, Bray, Blair, Allison, Pi-Sunyer, Hong and Eckel11, Reference Morin, Stark and Searing12). Further, children in food-insecure households are often sent to school hungry, which is associated with poor concentration(Reference Casey, Szeto, Robbins, Stuff, Connell, Gossett and Simpson13). Poor concentration in school has been linked to cognitive, behavioural and physiological delays that, in already disadvantaged children, contribute to the cycle of poverty(Reference Casey, Szeto, Robbins, Stuff, Connell, Gossett and Simpson13, Reference Sherman14).
US residents experience food insecurity for numerous reasons including economic conditions and low levels of food skills(Reference Olson, Anderson, Kiss, Lawrence and Seiling15). Evidence for an inverse relationship between income and food insecurity has been found(Reference Bernell, Weber and Edwards16). One study compared the relationship between household poverty index ratioFootnote ‡ and food insecurity, finding that food insecurity decreased as the ratio increased(Reference Alaimo, Briefel, Frongillo and Olson17). Other researchers assessed the income and food insecurity relationship using the income-to-poverty ratio,Footnote § finding that food insecurity decreased as the income-to-poverty ratio increased(Reference Nord and Winicki18). Thus, in these studies, households with lower incomes were more likely to experience food insecurity.
Low-income individuals employ many strategies to cope with food insecurity including bargain shopping, using alternative food sources and drawing on social relationships(Reference Ahluwalia, Dodds and Baligh19, Reference Hoisington, Shultz and Butkus20). Examples of the latter include obtaining information from others about locating cheaper food and sending children to others’ homes for meals(Reference Schwartz-Nobel21). This concept, termed social support, may be an important factor in coping with the possibility of food insecurity, although little social support literature focuses on food insecurity. Social support is the receipt of help imparted through social transactions(Reference Heaney and Israel22) and is multidimensional(Reference Throits23). The most frequently assessed dimensions of social support are its functions and sources(Reference Heaney and Israel22, Reference Berkman and Syme24). Social support can have an instrumental function characterized by the receipt or provision of tangible resources(Reference Heaney and Israel22), an emotional function distinguished by reassurance and sympathy(Reference Lin, Dean and Ensel25), or an informational function that involves giving and receiving helpful information(Reference Schaefer, Coyne and Lazarus26).
The sources of social support include an intimate partner, a social network and the community(Reference Heaney and Israel22, Reference Berkman and Syme24). The most proximal source is an intimate partner, usually a spouse(Reference Coyne and DeLongis27). A second source is the social network, which consists of relationships between kin, co-workers and friends(Reference Berkman28). The third and most general source is the community. Community social support is typically discussed in terms of the ties individuals have to their communities that result in feelings of belongingness(Reference Green and Rodgers29). These ties include participation in formal or informal groups (civic groups, sports teams) and faith community membership(Reference Cleak and Howe30, Reference Krause and Shaw31).
Researchers in various fields have provided convincing evidence that social support improves well-being(Reference Heaney and Israel22, Reference Baxter, Shetterly, Eby, Mason, Cortese and Hamman32, Reference Cohen and Wills33). Most studies have evaluated social support’s relationship with mortality, depression and well-being(Reference Berkman and Glass34, Reference Israel, Farquhar, Schulz, James and Parker35). Only a few studies have explored the food insecurity–social support relationship. For example, in a qualitative study with low-income North Carolinians, participants described three sources of social support to help in coping with food insecurity: (i) a close family member like a spouse; (ii) friends; and (iii) neighbours/acquaintances(Reference Ahluwalia, Dodds and Baligh19). Other researchers found that food-insecure Canadians had greater odds of reporting poor social support(Reference Vozoris and Tarasuk10). Recently, researchers assessed the effects of social support on food insecurity in two rural Iowa counties, determining that individuals with higher social support were less likely to experience food insecurity, although receipt of food from one’s network was not a significant predictor of food insecurity(Reference Garasky, Morton and Greder36). Perhaps developing stronger social ties can lower food insecurity.
Social support can buffer against stressors, diminishing the stressor’s influence on well-being(Reference Black, Cook, Murry and Cutrona37, Reference Strogatz, Croft, James, Keenan, Browning, Garrett and Curtis38). Social support has been shown to moderate the relationship between stress and mental health(Reference Kohler, Anderson, Oravecz and Braun39), poverty and negative parenting behaviours(Reference Hashima and Amato40), and acculturative stress and health(Reference Lee, Koeske and Sales41). A few studies have examined the interaction effects of income and social support on outcomes like parenting style and depression. One study found that the presence of social support reduced negative parenting behaviour among low-income families(Reference Hashima and Amato40). Another found that, in the presence of economic challenges, mothers with more social support were less likely to experience depression than similarly burdened mothers with less social support(Reference Kohler, Anderson, Oravecz and Braun39). Taken together, these findings suggest the existence of joint effects of income and social support.
Given the evidence that social support moderates the relationship between income and some health-related outcomes, social support may also moderate the relationship between income and food insecurity. However, most studies that have explored this relationship are qualitative in nature, and none specifically assessed the moderating role of social support(Reference Ahluwalia, Dodds and Baligh19, Reference Pierce, Sheehan and Ferris42). Even so, research suggests that social support is often used to cope with the stress of food insecurity(Reference Hoisington, Shultz and Butkus20, Reference Rosenberger and Gross43). Accordingly, the research questions addressed in the present study were:
1. Does social support moderate the relationship between income and food insecurity?
2. Do the moderating effects of social support differ by the function and source of the social support received?
Methods
Sample
The current study focuses on Oregon because of the state’s unique pattern of food insecurity. Oregon had the highest rate of food insecurity during the late 1990s and early 2000s until 2004, when it was the only state with a significant decline(Reference Edwards and Weber5, Reference Brown and Fournier44). Oregon’s rates have been attributed to high rates within households expected to be vulnerable to food insecurity (i.e. those with no employed adults, with adults who work only part-time or part-year, and those who have relocated in the last year) and households not normally expected to be vulnerable (i.e. those with no unemployed adult, with adults who work full-time and full-year, and two-parent households)(Reference Edwards and Weber5).
The target population was Oregonians aged 18–64 years. Persons over 64 years of age were excluded because they often receive social security and retirement benefits and are more likely to have lower household expenses than younger individuals, and thus have more income to purchase food(Reference Nord, Andrews and Carlson45). Individuals under 18 years of age were excluded because they do not often have financial responsibility for a household. We used disproportionate stratified random sampling with systematic selection to oversample rural Oregonians, which afforded broader representation of residents across the state(Reference Trochim46). Urban and rural strata were created at the census tract level: census tracts with more than 10 % of their geographic area contained within an urban growth boundary were considered urban. All other tracts were considered rural. Survey Sampling International (Fairfield, CT, USA) created the sampling frame and drew the sample using a large database of US households based predominantly on telephone records. The sample list included names and addresses of the household head, to whom the questionnaire was mailed.
Procedures
From August to November 2006, we collected data. The target person in each household was the individual (18–64 years) who last had a birthday. To be eligible, the person completing the survey had to consider Oregon her/his usual place of residence, following US Census procedures (K Vaidya, personal communication, 7 April 2006). To maximize response rate, we contacted each sampled household up to four times including use of a pre-notice, reminder postcard and a second questionnaire mailing(Reference Dillman47). We included a $1 bill in each initial survey. Surveys were sent to a total of 1200 households (600 rural, 600 urban). Of those, eighty-three had undeliverable addresses, 110 had no one under 65 years old at the address, ten were addressed to deceased individuals, and one was a business. Of the remaining 996 households, 343 surveys were received (response rate 34·4 %); sample characteristics are presented in Table 1.
Table 1 Sociodemographic and social support characteristics of the sample of Oregon residents (n 343)

All data are weighted except for the total n for each variable.
†Some numbers do not add up to the total sample because of non-response.
Measures
The questionnaire, which was eight pages in length and written at a 6th grade reading level, took approximately 10 min to complete and consisted of three sections: (i) social support; (ii) food security; and (iii) sociodemographics. We piloted the questionnaire to determine time for completion and if any questions were confusing or offensive. Minor changes were made. The Institutional Review Board at Oregon State University approved the protocol. The measures are described below. The social support items are listed in the Appendix.
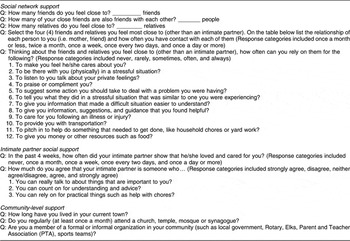
Social network support
We measured social network support received from family and friends using twelve items, four for each function (instrumental, informational and emotional). The items were adapted from previous studies(Reference Heaney and Israel22, Reference Berkman and Syme24, Reference Lin, Dean and Ensel25). We created a mean scale score for each of the three social support functions (range 0–4) and a total social network support mean scale that included all twelve (range 0–4). These scales had α coefficients ranging from 0·86 to 0·95, indicating high internal consistency reliability.
Intimate partner social support
We measured social support from an intimate partner with four items, which were adapted from a large body of previous work on social support(Reference Heaney and Israel22, Reference Berkman and Syme24, Reference Cohen, Underwood and Gottlieb48). We calculated the mean of the four items to create a scale score (range 0–4). This scale had an α coefficient of 0·97, indicating high internal consistency reliability.
Total social support
We calculated a combined mean scale score for the amount of social support received from an intimate partner and social network using the responses to the intimate partner support items and the social network support function items (range 0–4). The internal consistency reliability of the scale was high (α = 0·91).
Community-level social support
We measured community-level social support by asking about faith community attendance and organization membership using items from prior studies(Reference Abbey, Andrews and Halman49, Reference Newsom, Nishishiba, Morgan and Rook50).
We assessed the construct validity of the sixteen-item total social support scale using two recommended methods(Reference Netemeyer, Bearden and Sharma51, Reference Singleton and Straits52). First, we examined the correlations between the social support scale and the following measures of theoretically related variables: faith community attendance, family size and frequency of social contact. We found positive correlations between the social support scale and faith community attendance (0·18), family size (0·21) and frequency of social contact (0·22), providing evidence of the construct validity of the scale. Second, we compared scores on the social support scale for the following groups, which we expected to differ on social support: (i) respondents who lived alone v. those who lived with others; and (ii) respondents who did not attend a faith community v. those who did. Those who lived alone or did not attend a faith community had significantly lower scores on the social support scale, providing evidence of the social support scale’s construct validity.
Food insecurity
We measured food insecurity with ten questions from the US Department of Agriculture (USDA) Food Security Core Module(Reference Bickel, Carlson and Nord53). The Module consists of eighteen questions; however, eight refer only to households with children and could be excluded without any loss in precision (M Nord, personal communication, 2 February 2006). A sample question is: ‘In the last 12 months, did you ever eat less than you felt you should because there wasn’t enough money to buy food?’ The responses to the ten items were summed to create a scale; this scale had high internal consistency reliability (Kuder–Richardson 20 coefficient = 0·91). Using USDA-developed scaling procedures, we categorized individuals with zero to two affirmative responses as food-secure, with three to five affirmative responses as food-insecure without hunger, and with six to ten affirmative responses as food-insecure with hunger(Reference Bickel, Nord, Price, Hamilton and Cook54). Because the rate of hunger in this sample was less than 8 %, we created a binary outcome variable by combining the two food insecurity categories (0 = food-secure, 1 = food-insecure).
Sociodemographics
Respondents were asked their gender, age, race/ethnicity (using Office of Management and Budget guidelines(55)), education, employment, income, marital status, home ownership, possession of reliable transportation, household size and percentage of income spent on housing. We measured income by asking: ‘Which of the following categories would best describe your total household income before taxes for 2005?’ We provided twelve answer choices. We then initially collapsed income using the 2005 poverty guidelines for a family of four such that the first category ($19 999 or less) was approximately 100 % of poverty or less, the second category ($20 000 to 39 999) was approximately 101 % to 200 % of poverty, and the third category ($40 000 or more) was approximately 200 % of poverty or more. Based on the US Department of Housing and Urban Development’s affordable housing definition(56), we created a dummy variable for affordable housing with 1 = more than 30 % of income goes to housing and 0 = 30 % or less of income goes to housing.
Data analysis
Prior to conducting our main analyses, we assessed all covariates including social support variables for multicollinearity and found no evidence of highly correlated variables. To answer our first research question, we used hierarchical logistic regression, in which sets of variables are entered into the regression model in blocks, to determine whether total social support (i.e. amount of social support received from intimate partner and social network) moderates the relationship between income and food insecurity. We followed standard procedures(Reference Baron and Kenny57) used in other studies of social support(Reference Hashima and Amato40, Reference Lee, Koeske and Sales41, Reference Chou, Chi and Chow58). Food insecurity was the dependent variable. We estimated both a constrained and a full model. The constrained model contained the main effects of income and total social support. The full model included both the main effects and the interaction of income and total social support. The covariates included in both models were those determined to have significant bivariate associations with food insecurity at P < 0·1 (gender, marital status, age, education, employment, home ownership, percentage of income spent on rent, possession of a vehicle and rural residence)(Reference De Marco59, Reference De Marco and Thorburn60). We used three post-estimation procedures to determine whether including the interaction of income and total social support improved the fit of the model to the data. These were the likelihood ratio χ 2 test to evaluate the coefficients of the two models and two measures of goodness-of-fit, the McFadden’s adjusted R 2 and the Bayesian information criterion(Reference Long and Freese61, Reference Hensher and Johnson62).
We used the same procedures to evaluate the moderating role of individual sources and functions of social support to answer our second research question. We produced both a constrained and a full model for each of seven social support measures: the three functions of social network support (instrumental, informational and emotional), total social network support, intimate partner support, and two measures of community support (faith community attendance and organization membership). The constrained models contained the main effects and the full models added the interactions of income and the social support measure of interest. We included the same covariates and generated the same post-estimation measures as we did to answer our first research question.
For all multivariate analyses, we ran an original set of models with income categorized based on the 2005 federal poverty guidelines. With this income categorization, we found evidence for moderation of the relationship between income and food insecurity for three of the eight social support measures (emotional support, social network support and organization membership). However, probably because of the small number of respondents in the lowest income category (n 34, unweighted), the odds ratios for the main effects of the lowest income category ($19 999 or less) in the presence of their interactions were very large for emotional and social network support. For example, the odds ratio for the main effect of the lowest income category in the presence of the interaction of income with emotional support was 4136·79. Further, wide confidence intervals for the odds ratio (i.e. 3·24, 227·74) for the main effect of income in the presence of the interaction of income and organization membership were seen. To address these issues, we created a different income categorization (≤$34 999, $35 000–74 999, ≥$75 000) and re-ran the analyses. We present the results from the analyses with income recategorized.
The number of cases included in the multivariate analyses was 287 because cases with missing data were excluded. To ensure that the data were representative of all working-age Oregonians, we used a weight that is a product of weights accounting for: (i) the different sampling fractions used for disproportionate stratified random sampling; (ii) non-response due to low response rate; and (iii) the number of residents in each household who met the criteria for survey completion(Reference Trochim46). Except where noted, all data presented are weighted. We conducted all analyses using the STATA statistical software package version 9·2 (Stata Corp, College Station, TX, USA).
To ensure that our sample size provided adequate power for the complexity of these models, we conducted power calculations using the Power and Precision software (Biostat, Englewood, NJ, USA). The present analyses had adequate power (0·80 or greater) to detect moderate effects for the set of independent variables we had.
Results
Social support characteristics are included in Table 1. The results of analyses to answer our first research question, shown in Table 2, suggest that the amount of total social support received does not moderate the relationship between income and food insecurity. The main effects of income and total social support contributed significantly to the constrained model, as evidenced by the block χ 2 (![]() , P < 0·05, block χ 2 not shown in table). One income category had a significant association with food insecurity; respondents with incomes less than or equal to $34 999 were more likely to experience food insecurity than respondents with incomes of $75 000 or greater. However, total social support was not significantly associated with food insecurity. In addition, the inclusion of the interaction between income and total social support did not further improve the fit of the model to the data (block
, P < 0·05, block χ 2 not shown in table). One income category had a significant association with food insecurity; respondents with incomes less than or equal to $34 999 were more likely to experience food insecurity than respondents with incomes of $75 000 or greater. However, total social support was not significantly associated with food insecurity. In addition, the inclusion of the interaction between income and total social support did not further improve the fit of the model to the data (block ![]() , P > 0·05, block χ 2 not shown in table). The post-estimation analyses comparing the constrained and full models support this; all three post-estimation procedures indicated that the constrained model (i.e. without the interaction) fit the data better.
, P > 0·05, block χ 2 not shown in table). The post-estimation analyses comparing the constrained and full models support this; all three post-estimation procedures indicated that the constrained model (i.e. without the interaction) fit the data better.
Table 2 Hierarchical logistic regression analysis: predicting food insecurity with total social support among the Oregon residents (n 287)

df, degrees of freedom; LR, likelihood ratio; BIC, Bayesian information criterion.
All data are weighted. Total social support is a combined measure of support from an intimate partner and social network. Both models were adjusted for gender, marital status, age, educational attainment, employment status, home ownership, percentage of income spent on rent, possession of a vehicle and rural residence. The full model included the income and social support interaction terms, while the constrained model did not.
*P < 0·05, **P < 0·001.
†Wald χ 2 for the entire model.
To answer our second research question, we examined whether the moderating effects of social support differed by the function or source of the social support received. Results were similar to those for total social support (data not shown). In particular, the lack of a significant moderating effect was consistent across analyses using measures of individual sources and functions of social support.
We also conducted a non-response analysis by comparing sample demographics to Oregon data from the 2005 American Community Survey(63). The results indicated that study respondents were more likely to be married, older, employed, college-educated and have higher incomes than the general Oregon population, suggesting some selection bias. The bias toward those with higher socio-economic status was not unexpected because higher-income individuals are more likely to participate in research(Reference Turrell, Patterson, Oldenburg, Gould and Roy64).
Discussion
The present study advances knowledge regarding the relationship between income and food insecurity through the examination of the potential moderating effects of social support, which had not been tested in prior research. Although other studies have suggested that social support may be important because individuals draw on such resources when threatened with food insecurity(Reference Vozoris and Tarasuk10, Reference Ahluwalia, Dodds and Baligh19, Reference Garasky, Morton and Greder36), we found no evidence of an association between social support and food insecurity and no evidence that social support acts as a moderator between income and food insecurity. These findings may be attributable to several factors. First, perhaps no social support differences exist between the food-insecure and food-secure in Oregon. Second, differences may exist, but food-insecure respondents may have over-reported social support due to social desirability. Third, the effect of social support may be small. Our power calculations indicated that the sample size was sufficient to detect moderate, but not small, effects. In light of this, future studies should obtain a larger sample. In particular, the following techniques could help increase the proportion of low-income participants: increasing the number of contacts made with individuals, reducing survey length, increasing the incentive amount, and/or oversampling in low-income census tracts. Studies that include more participants with low incomes could produce different findings.
Another avenue for future research is the role of social capital(Reference Putnam65). Community context may be more important than social support alone in determining why some individuals experience food insecurity and others do not. Studies focusing on social capital could provide richer information about the community, including whether relationships between neighbours are characterized by trust and reciprocity, and insight into the development of community support. The association between community-level social capital, measured by the percentage of the population involved in a community organization and residential stability(Reference Flora66), and community food insecurity rates could be assessed to determine whether community social capital is a salient factor in the experience of food insecurity. Previous research found evidence of an inverse association between social capital and the risk of hunger(Reference Martin, Rogers, Cook and Joseph67). At the individual level, extent of community involvement, feelings of community connectedness, and reciprocity and trustworthiness of relationships could be measured(Reference Liu and Besser68). In fact, one study found that lower social capital at the individual level was associated with poorer diet(Reference Locher, Ritchie, Roth, Baker, Bodner and Allman69).
The present study has several strengths including the use of a rigorous probability sampling method that improved the generalizability of our findings. Another strength is our use of the USDA Food Security Core Module, which is widely used and has strong psychometric properties(Reference Bickel, Nord, Price, Hamilton and Cook54, Reference Carlson, Andrews and Bickel70). In addition, we measured a wide range of factors related to food insecurity. Further, the study was informed by a robust literature on social support. We used a large number of social support measures that have been used extensively in previous research, have strong properties, and capture various social support sources and functions.
Despite these strengths, the study also has several limitations. Compared with typical response rates for mail surveys(Reference Dillman47), ours was low (34·4 %), which may be due to the study’s focus on the general public. Some survey recipients may not have been sufficiently interested in the topic to complete it. Moreover, initial surveys were mailed in August when people are often vacationing. Findings may not be generalized to other states or the nation. The study was cross-sectional, so causal inferences cannot be made(Reference Portney and Watkins71). Further, the study relied on self-reporting and is subject to the potential risks inherent in the methodology(Reference Bradburn, Rips and Shevell72). Last, the database from which the sampling frame was created was based primarily on data from telephone directories, so the sample may include fewer low-income Oregonians than would a sample drawn using another source.
Undoubtedly, food insecurity exists in Oregon. The State of Oregon has recognized food insecurity as an important issue for residents and is working to eliminate the environmental factors that contribute to it(73). Although previous research suggested that social support could offset the negative impact of low income on food security(Reference Garasky, Morton and Greder36), we found no support for such a beneficial effect. Further research is clearly needed.
Acknowledgements
Sources of funding: None. Conflict of interest declaration: There are no conflicts of interest. Author contributions: At the time of the study, M.D. was a doctoral student with the Department of Public Health at Oregon State University. M.D. conceived of the study, collected the data, carried out the analyses, and wrote the manuscript. S.T. assisted with the conception of the study, gave guidance on data collection and analyses, and assisted in writing the manuscript. Acknowledgements: The authors would like to thank Stephanie Bernell, PhD, Lori Cramer, PhD, Carolyn Raab, PhD and Bruce Weber, PhD for their review, feedback and conceptual contributions to the larger project from which this study came. The authors would also like to thank Virginia Lesser, DrPH for her assistance with the sampling and weighting techniques necessary for the study; C. Scott Walker for his assistance with the GIS mapping needed to draw the sample; and Chris Wiesen for his statistical advice and assistance.
Appendix
Social Support Survey Items