


Iodine is an essential element in thyroid hormones required for normal growth and metabolism of tissues such as the central nervous system and for maintaining energy production and metabolic rate( 1 ). Iodine deficiency may lead to goitre, hypothyroidism, and impaired mental and physical development. Excess iodine intake may lead to enlargement of the thyroid gland and elevated production of thyroid-stimulating hormone. Dietary iodine requirements increase from childhood to adulthood, with the greatest requirement being for lactating and pregnant women( 1 ).
New Zealand is considered to have low-iodine soils resulting in low concentrations in locally grown foods( 1 ). Iodine-deficiency goitre was endemic in New Zealand by the early 1900s before the iodization of salt in 1924( Reference Thomson 2 ). Estimated dietary intake of iodine in New Zealand has decreased over the past 25 years due to decreased use of iodine-containing disinfectants in the dairy industry and changing food consumption patterns( Reference Thomson, Vannoort and Haslemore 3 ). Estimated average iodine intake is low for most New Zealanders, ranging from 40 to 57 % of the recommended daily intake across eight population groups based on Total Diet Surveys( Reference Thomson, Vannoort and Haslemore 3 ). Low iodine intake is consistent with evidence of low and decreasing urinary iodide levels and hence iodine status( Reference Skeaff, Ferguson and McKenzie 4 – Reference Thomson, Colls and Conaglen 7 ).
The use of iodized salt, containing between 25 and 65 mg iodine/kg salt, was mandated in the manufacture of bread in New Zealand in September 2009 as a major step towards redressing the low iodine status of New Zealanders( 8 ). This intervention is consistent with WHO recommendations to use iodized salt to control iodine deficiency( 9 ). Further interventions include advice on food sources of iodine (seafood, iodized salt, seameal custard, milk and eggs)( 10 ) and supplementation for pregnant women( 11 ).
Previous iodine dietary intake assessments for New Zealand were deterministic, based on 14 d simulated diets( Reference Thomson, Vannoort and Haslemore 3 ). While this approach provides population-average dietary intakes it does not provide information on the likely distribution of intake and thus the proportion of consumers who may be at risk from either too little or too much iodine. More informative modelling of the effectiveness of dietary interventions may be achieved using individual 24 h diet records, as applied to folic acid issues( Reference Green, Newton and Bourn 12 , Reference Hamner, Mulinare and Cogswell 13 ).
A model was developed to assess (i) the potential impact of replacing non-iodized with iodized salt in bread manufacture, (ii) the amount of single foods that are sources of iodine to be eaten to meet dietary guidelines for iodine, (iii) the potential impact of supplementation for pregnant women and (iv) the potential impact of further raising the level of salt iodization for use in bread manufacture, on the usual iodine intake for six New Zealand population groups over 5 years of age.
Methods
Food consumption surveys
Food consumption information was drawn from the 1997 National Nutrition Survey (NNS)( Reference Russell, Parnell and Wilson 14 ) that included 4636 nationally representative New Zealand respondents aged 15 years and older. Respondents participated in an individual interview to capture 24 h diet recall information, a self-administered qualitative FFQ including questions relating to food preparation habits and a physical examination. Repeat data were obtained for approximately 15 % of respondents, interviewed on a second day. Food consumption information for children aged 5 to 14 years was taken from the 2002 National Children's Nutrition Survey (CNS)( 15 ) that captured 24 h diet recall information, with repeat data for 15 % of respondents, and data on eating patterns of 3275 respondents. Interview days were randomized across days of the week and time of the year, for both studies, to remove potential biases. The two complete sets of dietary exposure estimates were divided to provide information on six groupings that most closely align with New Zealand dietary reference value guideline groups( 1 ), namely (i) ≥25-year-old males, (ii) 19–24-year-old males, (iii) ≥15-year-old females (non-pregnant), (iv) ≥15-year-old females (pregnant), (v) 9–13-year-old boys/girls and (vi) 5–8-year-old children.
Concentration of iodine in foods
Mean iodine concentrations in 266 New Zealand foods were collated from the 2003/2004 New Zealand Total Diet Survey( Reference Vannoort and Thomson 16 ), ESR (Institute of Environmental Science and Research Ltd) Client Reports( Reference Thomson 17 , Reference Love and Jones 18 ) and the New Zealand Food Composition Database( 19 ). Iodine concentration was calculated from simple recipes for a few common combination dishes or snacks (pasta dishes with cheese, tomato, or cheese and tomato; bread with cheese, meat, fish or fruit). Where data were retrieved from multiple sources, a weighted mean was calculated that accounted for different numbers of samples in different studies.
Modelling iodine intake
Food descriptors from the 1997 NNS and 2002 CNS were mapped to the 266 foods for which iodine concentration data were available. Where there was no direct match, the food descriptor was mapped to the most similar food with regard to the potential iodine source in the food of interest. For example, ‘French stick’ in the NNS was mapped to ‘white bread’ and ‘cheesecake’ was mapped to ‘dairy dessert’. Furthermore, the proportion for each food descriptor that equated to the mapped food was determined. For most cases this was 1·0. However, when a food of interest was only a component of a described item, such as the bread component of a filled roll, an estimate of the proportion of the food most likely to contribute to iodine intake was specified, based on standard recipes. For example, the iodine concentration for ‘Pita bread with vegetable’ was mainly from the pita bread, mapped to bread, with a proportion of 0·75 to allow for the non-bread component. For a few food descriptors namely bitters, blancmange, curry paste, curry powder, dietary supplement, gelatine, malt drink, mustards, powdered meal substitute, relish, seeds (caraway/mixed/mustard/poppy/pumpkin/sesame/sunflower), tahini, vinegar and wasabi, no match was obvious. Since none of these foods were considered to be significant sources of iodine based on an understanding of iodine sources and quantities consumed, they were not included in the intake estimates.
Estimates of iodine intake were made by combining mean iodine concentrations with individual 24 h dietary recall information from the NNS and CNS. Consumption information for each food consumed by each respondent was combined with concentration data using Microsoft FoxPro software (Microsoft Corporation, Redmond, WA, USA). Intakes were summed over all foods for each respondent to estimate a daily intake per individual. Repeat intake estimates were determined for a proportion (14–19 %, depending on population group) of respondents for whom repeat 24 h dietary recall data were available.
The BestFit function in the Excel add-in @Risk (Palisades Corporation, Ithaca, NY, USA) was used to determine the parametric distribution most closely representing the distribution of dietary iodine intakes (Fig. 1). The software uses a maximum likelihood estimation algorithm.
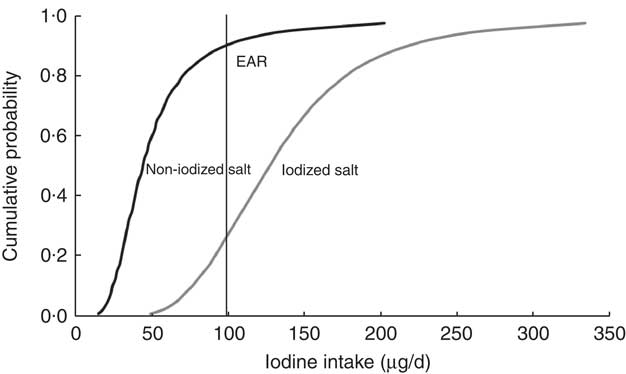
Fig. 1 Cumulative probability of usual iodine intake for bread made with iodized (50 mg/kg) or non-iodized salt for ≥15-year-old females (non-pregnant) in New Zealand. The Estimated Average Requirement (EAR) for iodine is shown as a reference point
Predictive intervention modelling
Available concentration data for iodine in retail bread pre-date mandatory use of iodized salt in bread manufacture. The potential impact of replacing non-iodized salt in bread with iodized salt was modelled by substituting the concentration value of iodine in white, wholemeal and grain bread with those obtained from iodine fortification trial studies for salt iodized at 25–65 mg iodine/kg salt( Reference Thomson 20 ). Revised iodine concentrations were derived for bread products included in the new food standard( 8 ) (e.g. bagels and English style muffins) and for bread-containing recipes (cheese-, fish-, meat- and fruit-containing sandwiches and rolls; see Appendix). Dietary iodine intakes were re-calculated for each population group with the revised iodine concentrations.
The impact of increasing the level of iodine in salt, from an average of 50 mg iodine/kg salt to 100 mg iodine/kg salt, was similarly modelled by doubling the additional iodine content of regulated breads and bread products used in intake calculations.
Dietary advice with respect to food sources of iodine( 10 ) was tested by estimating the amount of any one of the recommended foods (seafood, seameal custard, milk and eggs), or iodized salt, that an individual with low dietary iodine intake would need to eat on a daily basis to make up the estimated iodine shortfall and thus achieve an adequate daily intake of iodine. The selected foods were assumed to contain an average concentration of iodine. The intake of the 5th percentile was used to represent a low dietary iodine intake. The base case assumed manufacture of bread with salt iodized at 50 mg iodine/kg salt.
The potential impact on pregnant women of consuming the recommended iodine supplementation( 11 ) was assessed by adding 150 μg to the estimated daily intakes for each of the pregnant women identified in the NNS (n 64) and comparing this with nutrient reference values for this population group( 1 ). Intakes assumed that bread and bread products were manufactured with iodized salt. Intakes were weighted to the New Zealand population.
Risk characterization
The adequacy of iodine intakes was assessed by comparison with Australian and New Zealand reference health standards for Estimated Average Requirements (EAR) and Upper Limits of intake (UL), derived for each population group on the basis of international and New Zealand studies (Table 1)( 1 ).
Table 1 Estimates of usual iodine intake based on 24 h diet recall and impact of using salt (iodized at 50 or 100 mg/kg) in bread manufacture on the adequacy of usual iodine intakes for six population groups in New Zealand (excluding discretionary salt and iodine supplements)

n, number of respondents in 24 h diet recall survey; EAR, Estimated Average Requirement for iodine(1); UL, Upper Limit of intake.
*Based on intra- and inter-individual variabilities for non-pregnant women, excluding recommended 150 μg supplement.
†UL is 900 μg/d for 14–18-year-old females (n 1); for all females over 19 years, UL = 1100 μg/d(1).
Statistical analysis
Nutrient intakes based on single-day records of food consumption do not account for possible within-person variation in day-to-day iodine intake( Reference Carriquiry 21 , Reference Dodd, Guenther and Freedman 22 ). The software PC-SIDE version 1·0 (2003; Iowa State University, Ames, IA, USA) was used to estimate usual (long-term) iodine intakes. The software separates between- and within-person variation, using a subsample of the population with more than one day of consumption data, as in the NNS and CNS, to estimate the within-person component of the variation. The distribution of usual intakes is the between-person variation component. PC-SIDE was used to determine summary statistics (means, medians, 5th and 95th percentiles), and proportions of iodine intakes less than adequate and greater than upper nutrient reference values, for selected population groups. Intakes for each population group were weighted to the New Zealand population at the time that the survey was conducted. The variability of intakes was represented by the 5th and 95th percentile usual intakes for each population group. Where there were insufficient replicate data (for pregnant women), intra- and inter-variability data for non-pregnant females was applied to estimate usual intakes for pregnant females, as described elsewhere( Reference Jahns, Arab and Carriquiry 23 ).
Results
Concentration of iodine in foods
The mean concentration of iodine in 266 foods ranged from 0·001 mg/kg in instant coffee and fruit drink to 428 mg/kg in seaweed (Appendix). Most foods contained less than 1 mg iodine/kg, with the exception of five foods: seaweed, iodized salt, scallops, mussels and ‘other’ shellfish.
Estimated dietary iodine intake
Estimates of usual iodine intake for the six selected population groups are shown in Table 1. Selected percentile consumers, including median, low (5th percentile) and high (95th percentile), as well as mean intakes are presented to show the distribution and variability of iodine intake for each population group. Low intakes (5th percentile) ranged from 21 to 39 μg/d across the six groups, representing at best 39 % of the EAR for 19–24-year-old males and at worst 21 % of the EAR for non-pregnant females. Mean and median intakes were below the respective EAR for all population groups with the exception of the mean for ≥25-year-old males. Median iodine intakes ranged from 42 to 67 μg/d, representing at best 67 % of the EAR (9–13-year-old boys/girls, ≥25-year-old males). The median intake for pregnant women was 50 μg/d, 31 % of the EAR. For each population group, the median was less than the mean, indicative of right-skewed distributions of intake. The 95th percentile intakes were 86–148 μg/d across the population groups, representing 61 to 149 % of the EAR and well below the UL. The distribution of usual intakes is shown graphically (Fig. 1) for one population group, ≥15-year-old females (non-pregnant). The cumulative probability values to the left of the EAR represent the proportion of the population with an intake less than the EAR. When non-iodized salt is used in bread manufacture, 90 % of the non-pregnant women were estimated to have iodine intakes below the EAR. When iodized salt is used, this percentage is estimated to drop to 27 %.
Impact of iodized salt in bread
The modelled use of iodized salt in bread manufacture had a positive impact on usual iodine intake for each of the six population groups considered (Table 1, 50 mg iodine/kg salt). The median iodine intake estimate more than doubled and exceeded the EAR for all population groups except the ≥15-year-old pregnant females (Fig. 2). The proportion of consumers estimated within the recommended intake range, i.e. above the EAR and below the UL, was raised from 0–19 % when non-iodized salt is used in bread manufacture to 73–100 % when iodized salt is used, with the exception of pregnant females (Table 1). For this group, iodine intakes were predicted to remain below recommended levels, with only 37 % of this group likely to have intakes above the EAR. A very small proportion (1 %) of 5–8-year-old children were predicted to exceed the UL for iodine intake when iodized salt is used in bread manufacture (Table 1). The impact of using iodized salt in bread manufacture is illustrated for one population group, the ≥15-year-old females (non-pregnant) in Fig. 1. For this group, the percentage of the population achieving the EAR increased from 10 to 73 % of respondents.
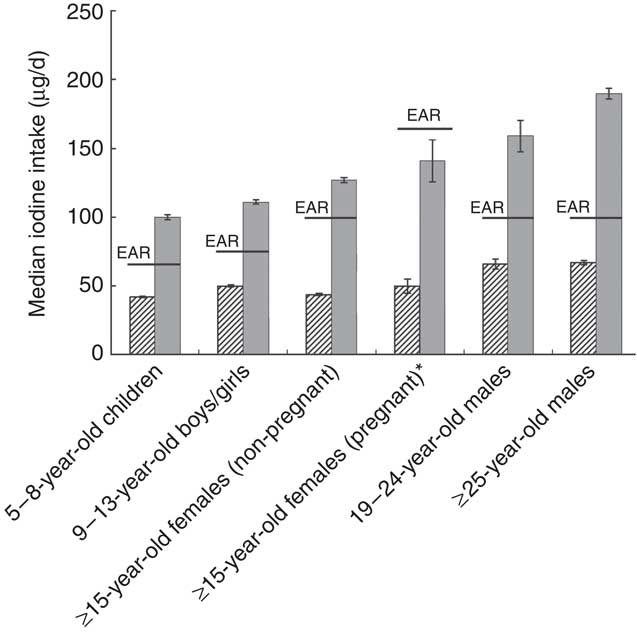
Fig. 2 Median usual iodine exposure estimates without iodized salt (![]() ) and with salt iodized at 50 mg iodine/kg salt (
) and with salt iodized at 50 mg iodine/kg salt (![]() ), compared with the Estimated Average Requirement (EAR), for various population groups in New Zealand. Usual intakes take into account both within- and between-person variation. The variability in median exposure estimates is given as standard error, represented by vertical bars. *Usual intake calculated with external variabilities for ≥15-year-old non-pregnant females
), compared with the Estimated Average Requirement (EAR), for various population groups in New Zealand. Usual intakes take into account both within- and between-person variation. The variability in median exposure estimates is given as standard error, represented by vertical bars. *Usual intake calculated with external variabilities for ≥15-year-old non-pregnant females
Food consumption to meet iodine intake shortfalls
The amount of any one of the foods recommended as a source of iodine that would need to be eaten on a daily basis to increase iodine intake to the EAR, for a low iodine intake consumer (5th percentile), is shown in Table 2. The amount of salt, iodized at 50 mg/kg, required to achieve the same iodine intake is also included.
Table 2 Amount of any one selected food needed, daily, to increase iodine intake for 5th percentile consumers to the EAR, assuming all bread is manufactured with salt iodized at 50 mg/kg
EAR, Estimated Average Requirement for iodine(1).
Shortfall is the difference between iodine intake of low consumers (5th percentile) and the EAR for various population groups.
*Excluding recommended 150 μg supplement. If low consuming pregnant women consume the recommended 150 μg iodine supplement, they would achieve an adequate iodine intake without additional food sources.
†Assuming 1 egg weighs 50 g and iodine concentration = 0·519 mg/kg.
‡Fish, assumed iodine concentration = 0·277 mg/kg.
§Shellfish, assumed iodine concentration = 2·0 mg/kg.
∥Salt, iodized, assumed iodine concentration = 50 mg/kg.
Impact of further increasing the level of iodine in salt
When the intake model was adjusted to include an iodine content in salt used for bread manufacture twice that currently used (increased from 50 to 100 mg iodine/kg salt), the proportion of population groups with adequate iodine intakes increased from 37–100 % to 93–100 % (Table 1), with the largest increase estimated for pregnant women. For this scenario, the maximum proportion of consumers that might exceed the upper limit for iodine was 5 % for 5–8-year-old children.
Impact of supplementation for pregnant women
When 150 μg was added to the estimated usual daily intakes for the pregnant women identified in the NNS (n 64), assuming bread and bread products were manufactured with salt iodized at either 50 mg or 100 mg iodine/kg salt, all respondents achieved adequate estimated iodine intakes. No respondents were predicted to exceed the UL for either scenario.
Discussion
The low mean iodine intakes estimated in the present study, when non-iodized salt is used in bread and bread products, generally confirmed those previously reported that were based on simulated diets, where population groups were matched( Reference Thomson, Vannoort and Haslemore 3 ).
While the exposure methodology described in the present study provides a realistic estimate of iodine intake for the selected population groups, and more information than deterministic modelling based on simulated diets, there are recognized limitations. First, the 266 foods included in the study were mapped to over 5000 foods described in the NNS/CNS, requiring assumptions that mapped foods have similar iodine concentrations to the analysed foods. There is a measure of uncertainty around these assumptions. Second, while each of the 266 foods has a range of iodine concentrations, only mean concentration data were applied. However, this is a valid approach if long-term usual intakes are the parameter of interest( Reference Kroes, Muller and Lambe 24 ). The accuracy of an exposure assessment is dependent on the accuracy of the concentration data used. The majority of concentration data (77 %) were sourced from analytical surveys of retail foods commissioned by the Ministry of Agriculture and Forestry( Reference Thomson, Vannoort and Haslemore 3 , Reference Thomson 17 , Reference Love and Jones 18 ). Robustness of these data was substantiated by quality assurance data for blanks, spikes, duplicates and Certified Reference samples. Quality assurance of data from the Food Composition Tables (23 % of foods)( 19 ) was not available. A further limitation relates to under-reporting of food intake. Under-reporting is a commonly recognized problem with self-reported dietary surveys such as 24 h dietary recall( Reference Black 25 ) and applies particularly to foods that may be perceived as ‘bad’, for example alcohol and fats. Although this phenomenon is usually referred to as under-reporting, in some cases it may be under-eating. Conversely, foods perceived to be socially acceptable (e.g. fruits and vegetables) may be over-reported( Reference Carriquiry 21 ). An analysis of under-reporting in the NNS concluded that 12 % of men and 21 % of women surveyed were ‘definite’ under-reporters, with ratios of energy intake to RMR of less than 0·9( Reference Pikholz, Swinburn and Metcalf 26 ). Given that bread, marine and dairy foods accounted for the majority of dietary iodine and these would be seen as neutral foods, there is no reason to expect under-reporting to be especially problematic for the iodine exposure assessments presented. There may be some under-reporting of beer, perceived as ‘bad’, but given that beer accounted for at most 6 % of iodine intake for the 19–24-year-old males when non-iodized salt was used in bread manufacture, the impact of any under-reporting is likely to be minor (less than 1 % of intake). It should be noted that the consumption information for New Zealand adults is now 13 years old and may not reflect more recent eating behaviours.
While the intervention to use iodized salt in bread is expected to raise dietary iodine intakes, modelling suggests that between 8 and 63 % of each population group are predicted to have an inadequate iodine intake, excluding any contribution from use of iodized salt in cooking or at the table. More commonly consumed good food sources of iodine are low-fat milk, yoghurt, eggs, fish and shellfish (Appendix). For a ≥15-year-old female (non-pregnant) at the 5th percentile of iodine intake to achieve a recommended intake of iodine, she would need to consume up to 354 ml low-fat milk, 410 g yoghurt, an egg, 123 g fish or 17 g shellfish every day in addition to her usual diet. Of course, a combination of foods may be consumed to the same end. With the exception of the ≥25-year-old males, the consumption amounts necessary to raise a low iodine intake to the recommended level may be challenging for some consumers. On the other hand, an adequate level of iodine intake may be achieved from the consumption of 0·1 to 1·5 g of iodized salt, equivalent to one pinch to one-third of a teaspoon of salt daily.
Predictive modelling suggests that a small proportion of 5–8-year-old children (1 %) might exceed the UL when bread is manufactured with salt iodized at 50 mg iodine/kg salt. This prediction is based on twenty-three respondents with intakes ranging from 1·1 to 13 times the UL. Intake of the two extreme consumers in this group was dominated by the consumption of 9 g seaweed and in excess of 500 ml fish soup, respectively. The fish soup was mapped to ‘shellfish, other’ and is likely to be an overestimate as a significant proportion of the soup is water that will not contribute iodine. For most of the twenty-three respondents however, the high iodine intake was from bread consumption, with or without eggs. The proportion of high exposures rises to 5 % when a higher level of iodization is applied. Thus, a small proportion of 5–8-year-old children are likely to have intakes in excess of the UL.
In recognition of the difficulty of women of childbearing age achieving sufficient iodine intake from food alone, even with the mandatory use of iodized salt in bread, the New Zealand Ministry of Health recommends that pregnant and breast-feeding women take a registered 150 μg iodine tablet( 11 ). When daily intake of such a supplement is added to the modelled baseline usual dietary iodine intakes for pregnant women, most pregnant women (99 %) are predicted to achieve adequate iodine intakes and less than 0·5 % are predicted to exceed the UL for iodine. This excludes any contribution from discretionary use of iodized salt.
Although food regulations allow a range of 25–65 mg iodine/kg salt, the average concentration of iodine in iodized retail salts available in New Zealand is 50 mg/kg( 27 ). Internationally, the iodine concentration of fortified salt is in the range 13 to 100 mg/kg. In the USA, where iodized salt constitutes approximately 50–60 % of the market, salt is iodized at 100 mg/kg( 28 ). If the level of iodization of salt used for bread manufacture in New Zealand were to be doubled, to a mean concentration of 100 mg iodine/kg salt, the proportion of selected population groups achieving an adequate iodine intake is predicted to increase from 37–100 % to 93–100 %. At the higher rate of iodization, about 5 % of 5–8-year-old children might exceed the UL for iodine, excluding any contribution from salt added at cooking or at the table.
Quantitative data on discretionary use in New Zealand is not available. Hence the intake estimates presented exclude any addition from iodized salt added at the time of cooking or at the table. Based on dietary information from the NNS and CNS, approximately 60 % of New Zealanders might be expected to add salt when cooking( Reference Russell, Parnell and Wilson 14 , 15 ). This would more likely be iodized salt than not, adding to iodine intake for these consumers. Drawing on the work of Mattes and Donnelly that salt added during cooking accounted for 5·1 % of total dietary Na (thus 511 mg salt)( Reference Mattes and Donnelly 29 ), that this salt is iodized at 50 mg iodine/kg salt, and assuming a third of salt added during cooking is ingested( Reference Sánchez-Castillo and James 30 ), the mean contribution of iodine from salt added during cooking is of the order of 5 μg/d. This represents 2–3 % of the estimated mean daily adult intakes (Table 1). A smaller percentage, approximately 50 %, might be expected to add iodized salt at the table (unpublished data from 2002 CNS). Assuming table salt accounts for 6·2 % of dietary Na (thus 621 mg salt)( Reference Mattes and Donnelly 29 ), the mean contribution of iodine, for those who add salt at the table, is approximately 30 μg/d. This represents an additional 14–21 % of iodine intake for those adults who add salt, or 7–10 % to mean population intakes. A proportion of New Zealanders would be expected to have no additional iodine from iodized salt, either from cooking (approximately 30 %) or at the table (approximately 50 %).
Data on iodine-containing supplement use in New Zealand is not readily available and the relative contribution of iodine from this source is unknown. The current estimations will be refined with quantitative data for discretionary salt and iodine supplement usage.
Acknowledgements
This work was supported with funding from the New Zealand Research Science & Technology CRI Capability Fund, 2009/2010. There are no conflicts of interest for any of the authors. The authors’ responsibilities were as follows: B.M.T. designed the research, conducted the PC-SIDE analysis and had primary responsibility for the final content; S.S. conducted the exposure assessments and contributed to writing the paper; P.J.C. contributed to the analysis and paper writing. The authors wish to acknowledge the Ministry of Health as owner of the copyright and funders of the 1997 National Nutrition Survey and the 2002 National Children's Nutrition Survey and to thank them for access to food consumption information (24 h dietary recall and qualitative FFQ) from these surveys. They also thank Beverley Horn, Richard Vannoort and Stephen On for their constructive review of the paper.
Appendix
Consolidated data of mean iodine concentration in New Zealand foods (mg/kg)

*1 = Thomson et al.(3); 2 = Thomson(17); 3 = Love and Jones(18); 4 = Crop & Food Reseach(19); 5 = Thomson(20).


