Fe deficiency is a highly prevalent public health concern, affecting more than one-third of the world’s population( Reference Stoltzfus 1 ). Functional consequences of Fe deficiency include anaemia and reductions in physical work capacity( Reference Haas and Brownlie 2 , Reference Pasricha, Low and Thompson 3 ), immune function( Reference Dao and Meydani 4 ) and cognitive performance( Reference Beard and Connor 5 , Reference Murray-Kolb 6 ), as well as increased risk of depression( Reference Beard, Hendricks and Perez 7 ). These outcomes may be long-lasting and can occur before the development of overt anaemia, defined for women as Hb < 120 g/l( Reference Lukowski, Koss and Burden 8 ).
Women of reproductive age are at heightened risk of Fe deficiency, particularly in low-income countries( Reference Black, Allen and Bhutta 9 ) where diets are low in Fe-rich foods and high in plant foods that can inhibit Fe absorption( Reference Beard, Hendricks and Perez 7 , Reference Yip 10 ). Fe supplementation is an efficacious method for ameliorating Fe deficiency, but financial and physical barriers often preclude its use in low-resource settings( 11 ). Widespread Fe supplementation also increases the risk that Fe-replete individuals will consume too much Fe, which could exacerbate morbidities from infections, notably malaria, hookworm and schistosomiasis( Reference Lynch 12 , Reference Beard 13 ).
Fortifying ubiquitous foods has resulted in large-scale decreases in other micronutrient deficiencies; folate-fortified flour and vitamin D-fortified milk are two well-known examples( Reference Holick 14 – Reference Costello 17 ). Salt iodization has reduced iodine deficiency to <11 % in the Americas, which has greater iodized salt consumption compared with Europe, where iodized salt consumption is low and >50 % prevalence of iodine deficiency has been reported( Reference Zimmermann 18 ). Sustained salt iodization is expected to reduce goitre prevalence to <5 %( Reference Zimmermann 18 ), which by WHO estimates would eliminate iodine deficiency as a significant public health problem. Salt is a potentially successful fortification vehicle for delivering additional micronutrients, in part, because it is consumed daily by most of the world, is produced in many nutritionally at-risk areas and can be fortified using low-cost technology( Reference Zimmermann 18 – Reference Zimmermann, Zeder and Chaouki 23 ).
Previous research has demonstrated the efficacy of consuming salt double-fortified with iodine and Fe (DFS) to improve both iodine and Fe status in children( Reference Andersson, Thankachan and Muthayya 19 , Reference Zimmermann, Wegmuller and Zeder 22 , Reference Zimmermann, Zeder and Chaouki 23 ) as well as Fe status in women of reproductive age( Reference Haas, Rahn and Venkatramanan 24 ). Although these well-designed randomized controlled trials provide evidence for a causal relationship between consumption of DFS and improved Fe status, little work has been done to examine the magnitude of impact and the potential effectiveness of programmes to reduce Fe deficiency with widespread DFS distribution( Reference Zimmermann, Wegmuller and Zeder 22 , Reference Zimmermann, Zeder and Chaouki 23 , Reference Habicht and Pelto 25 – Reference Habicht, Victora and Vaughan 27 ). To maximize the success of such programmes, there must first be evidence from efficacy trials of the behavioural and biological mechanisms through which the intervention results in an outcome of interest( Reference Habicht and Pelto 25 , Reference Habicht and Martorell 26 , Reference Burger, Haas and Habicht 28 , Reference Victora, Habicht and Bryce 29 ). Inherently, randomized controlled efficacy trials can provide only limited information about generalizability, but are often useful to identify predictors of potential to benefit which aid in targeting populations for future interventions( Reference Habicht and Frongillo 30 ).
The present analyses examine characteristics of those who benefited from an Fe intervention of DFS among female tea pluckers in West Bengal, India. Benefit is assessed with three methods: both as the absolute (i) and relative (ii) improvements in Fe biomarkers as well as the resolution of Fe deficiency (iii) over a 10-month intervention. The results presented here are of particular interest given the high economic and public health burdens of Fe deficiency and anaemia and the need to efficiently and effectively target DFS interventions to address these burdens.
Study population and methods
Study site and participants
Details of the study population and efficacy study are described in Haas et al.( Reference Haas, Rahn and Venkatramanan 24 ). Briefly, participants were female tea pluckers (aged 18–55 years) who lived and worked on the Panighatta Tea Estate in West Bengal, India. Women were not eligible to participate if they were pregnant, had Hb concentration <80 g/l or >150 g/l, were not residents of Panighatta or were not employed full-time on the tea estate. The population included two ethnic groups: the Nepali, whose ancestors emigrated from Nepal, and the Adivasi, an indigenous people considered to be of lower social and socio-economic status than the Nepali.
Intervention
Eligible women (n 248) were enrolled between July and September 2010, and were randomly assigned to receive salt fortified with potassium iodate 50 μg/g (IS) or salt double-fortified with potassium iodate 50 μg/g and Fe 1000 μg/g as encapsulated ferrous fumarate (DFS) for seven to ten months. All other types of commercially available salt were removed from the tea estate to promote adherence. There were no differences in loss to follow-up between groups: 108 and 104 women completed the study in the IS and DFS group, respectively. Adherence to the intervention was high and similar between treatment groups( Reference Haas, Rahn and Venkatramanan 24 ).
Follow-up procedures
Participants were given deworming medication (albendazole, 200 mg) one month before the baseline (enrolment) blood draw and after five months of follow-up (midpoint). Venous blood samples were collected at baseline and endline (after ten months of follow-up). Single casual urine samples were collected at baseline and endline to assess iodine excretion. Height (cm) and weight (kg) were measured by trained anthropometrists at baseline and endline. BMI was calculated as weight (kg)/height2 (m2). Participant age, ethnicity and socio-economic indicators were assessed via questionnaires, as detailed in Haas et al.( Reference Haas, Rahn and Venkatramanan 24 ).
Laboratory analyses
Venous blood samples were analysed for Hb, serum ferritin (sFt) and soluble transferrin receptor (TfR). Inflammation was assessed via measurement of C-reactive protein (CRP) and α1-acid glycoprotein (AGP). Hb was assessed with a Coulter Counter (Beckman). sFt and CRP were analysed by chemiluminescent immunoassay (Immulite 2000) and AGP by radial immunodiffusion (Kent Laboratories). ELISA was used to assess TfR (BioVendor, Asheville, NC, USA), and a subgroup of blood samples (n 35) were run in duplicate with an ELISA kit from Ramco Laboratories (Stafford, TX, USA) to calculate Ramco-adjusted TfR values by linear regression(
Reference Haas, Rahn and Venkatramanan
24
). The resulting prediction equation was:
![]() ${{\mathop{\rm TfR}\nolimits}_{\rm{Ramco}}} = 1 \cdot 821 \times {\mathop{\rm TfR}\nolimits}_{\rm{BioVendor}}^{0 \cdot 739}$
. Total body Fe (BI) was estimated with Cook’s equation(
Reference Cook, Flowers and Skikne
31
), which required Ramco-adjusted TfR values, as:
${{\mathop{\rm TfR}\nolimits}_{\rm{Ramco}}} = 1 \cdot 821 \times {\mathop{\rm TfR}\nolimits}_{\rm{BioVendor}}^{0 \cdot 739}$
. Total body Fe (BI) was estimated with Cook’s equation(
Reference Cook, Flowers and Skikne
31
), which required Ramco-adjusted TfR values, as:
![]() ${\mathop{\rm BI}\nolimits} = - \left[ {\log \left( {{{{\mathop{\rm TfR}\nolimits} }_{\rm{Ramco}}}/{\mathop{\rm sFt}\nolimits} } \right) - 2 \cdot 8229} \right]/0 \cdot 1207$
. Serum folate, vitamin B12 and urinary iodine were also measured at baseline and endline with the Immulite 2000. The Hb, sFt, CRP and iodine tests were completed at the Clinical Research Services of Super Religare Laboratory, Kolkata branch, India. Analyses of TfR, AGP, folate and vitamin B12 were performed at the Molecular Diagnostics Laboratory in Lucknow, India.
${\mathop{\rm BI}\nolimits} = - \left[ {\log \left( {{{{\mathop{\rm TfR}\nolimits} }_{\rm{Ramco}}}/{\mathop{\rm sFt}\nolimits} } \right) - 2 \cdot 8229} \right]/0 \cdot 1207$
. Serum folate, vitamin B12 and urinary iodine were also measured at baseline and endline with the Immulite 2000. The Hb, sFt, CRP and iodine tests were completed at the Clinical Research Services of Super Religare Laboratory, Kolkata branch, India. Analyses of TfR, AGP, folate and vitamin B12 were performed at the Molecular Diagnostics Laboratory in Lucknow, India.
Statistical analyses
Data processing and statistical analyses were performed using the statistical software package SAS version 9.4. Where applicable, non-parametric analyses were used for non-normally distributed measures. sFt and BI were examined both without adjustment and with Thurnham’s correction factor for inflammation( Reference Thurnham, McCabe and Haldar 32 ). Values for sFt, and thus for BI, were corrected only if a participant had CRP > 3·0 mg/l, AGP > 1·0 g/l, or both. The Bonferroni method( Reference Hochberg 33 ) was used to correct for multiple comparisons when necessary.
The resolution of deficiency is often used as a metric in clinical settings to determine the efficacy of nutrition interventions. While this is a useful method, it may not account for false negatives; that is, individuals who were severely deficient or who had low but technically sufficient status before the intervention and who nevertheless demonstrate large increases in status at endline. To address this, we used three different assessments of response: absolute change, relative change and resolution of deficiency. The first assessment utilized an epidemiological approach, which examined the absolute change in Fe biomarkers. For this assessment, multivariate linear regression models were developed to identify predictors of change in Hb, sFt and BI across the intervention, which replicates the results of Haas et al.( Reference Haas, Rahn and Venkatramanan 24 ). We chose these indicators to assess multiple components of Fe status: Hb for anaemia, sFt for Fe stores, and BI for a composite estimate of Fe in both tissues and stores. A negative BI value indicates Fe deficiency( Reference Cook, Flowers and Skikne 31 ). The second assessment, used in public health evaluations, measured response to the intervention as a relative change in Fe biomarkers( Reference Raiten, Namasté and Brabin 34 ). Responders were defined as those whose sFt, BI or Hb increased more than 1 sd above the mean change for the control group. We selected this cut-off for response because it is outside the known day-to-day biomarker variation( Reference Borel, Smith and Derr 35 ) and also captures sample-specific response. Finally, we studied the resolution of deficiency. Resolvers were defined as women who had Fe deficiency (defined as sFt < 12·0 μg/l), low BI (BI < 0·0 mg/kg) or anaemia at baseline and were Fe replete at endline. These are standard cut-off values for deficiency( 36 ). We also examined a less stringent definition of Fe depletion (sFt < 15·0 μg/l)( 36 , Reference Petry, Olofin and Hurrell 37 ). Non-resolvers were deficient at baseline and remained deficient at endline. For both the relative change and deficiency resolution methods, predictors of response to the intervention were identified using Hodges–Lehmann–Sen estimations( Reference Hodges and Lehmann 38 ), χ 2 tests and binomial regression models (to estimate relative risk).
The following variables were considered as covariates as well as potential predictors of benefit: age, measures of baseline Fe status (Hb, anaemia (Hb < 120 g/l; yes or no) and TfR) and anthropometry (weight, height and BMI). Baseline serum folate and vitamin B12 were evaluated because deficiencies in these nutrients can result in anaemia( Reference Gibson 39 ). Women were considered deficient in folate or vitamin B12 with folate < 5 ng/ml or vitamin B12 < 200 pg/ml( Reference Gibson 39 ). Baseline urinary iodine was included because all of the intervention salt was iodized. Ethnicity (Adivasi or Nepali) was included as a random effect.
As the study was not designed to identify predictors of Fe deficiency or low BI resolution, a less stringent requirement of significance (P < 0·1) was used for initial univariate regression analyses and interaction terms in multivariate analyses. Significant variables from the univariate models were retained in the multivariate binomial regression models to predict resolution of Fe deficiency and low BI if the P value was <0·05 or <0·1 for interactions. All tests were two-tailed.
Results
The baseline characteristics were the same in the present sub-sample as in Haas et al.( Reference Haas, Rahn and Venkatramanan 24 ) and did not differ between treatment groups (see online supplementary material, Supplemental Table S1). We first examine those who benefited from the intervention using the three methods of assessing response described above and then identify baseline characteristics that predict potential to benefit from the DFS intervention.
Absolute change in biomarkers across the intervention
We included change in sFt, BI and Hb as continuous dependent variables in multivariate linear regression models (Table 1). Both baseline log(sFt) and treatment group predicted change in log(sFt) (P < 0·001). The interaction term did not reach statistical significance (Table 1). Although lower baseline log(sFt) concentrations resulted in greater change in log(sFt), the effect was more pronounced in the DFS v. IS group (Fig. 1). Women who received DFS had greater increases in BI relative to those who received IS and baseline BI was negatively associated with change in BI (P < 0·001) when the interaction between baseline BI and treatment group was not included in the model (data not shown). The interaction between baseline BI and treatment group was significant (P = 0·08; Table 1). Ethnicity and baseline Hb predicted the change in Hb, but treatment group did not (Table 1). The interaction between ethnicity and treatment did not predict change in sFt, BI or Hb (data not shown).
Table 1 Multivariate baseline predictors of changes in serum ferritin, body iron and Hb in response to an intervention of double-fortified salt in female Indian tea pluckers

sFt, serum ferritin; BI, estimated total body Fe; DFS, double-fortified salt.
†P < 0·1; *P < 0·05; ***P < 0·001.
‡ Reference values for independent variables: treatment, iodized salt; ethnicity, Nepali.
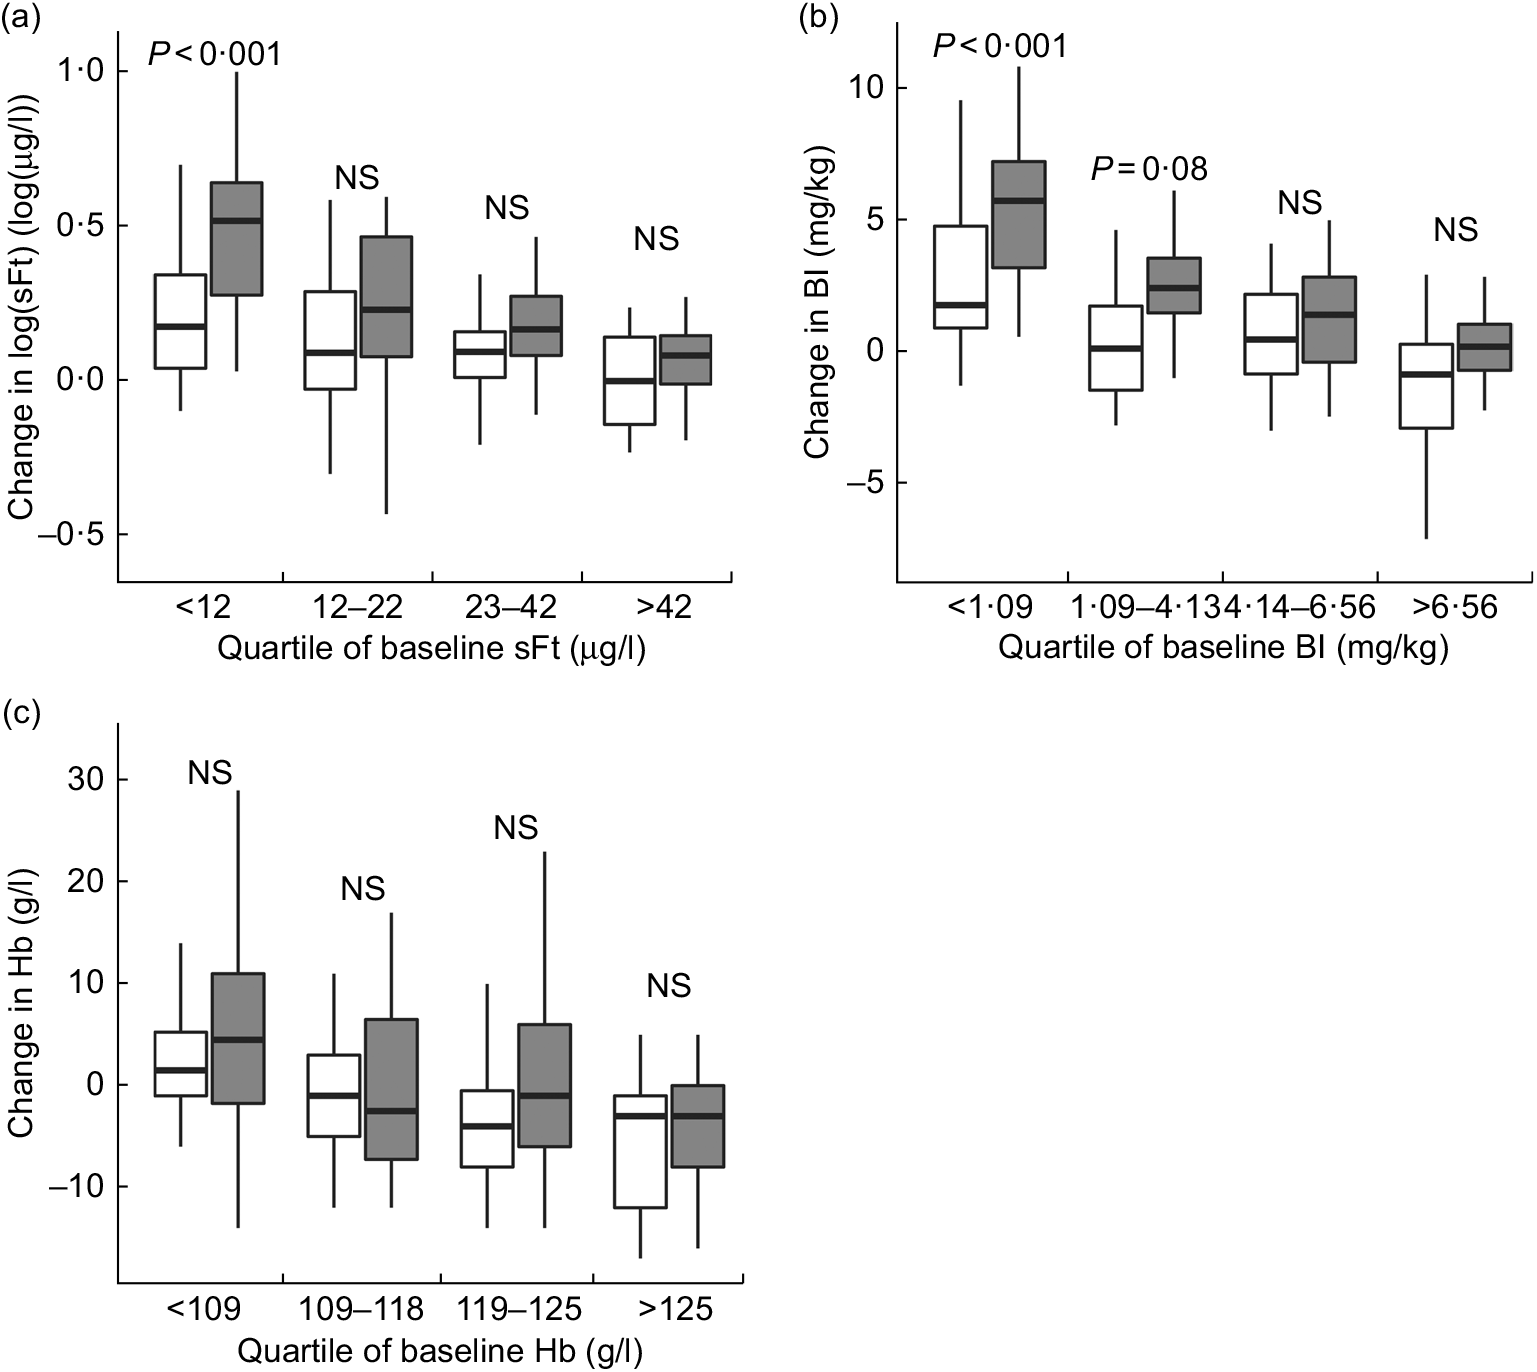
Fig. 1 Box-and-whisker plots showing the change in iron indicators in female Indian tea pluckers by treatment group (![]() , iodized salt;
, iodized salt; ![]() , double-fortified salt) and baseline quartile of iron status. Boxplots indicate the lower quartile, median and upper quartile, and whiskers indicate minimum and maximum values; P values indicate significance of differences between treatment groups (sFt, serum ferritin; BI, estimated total body iron)
, double-fortified salt) and baseline quartile of iron status. Boxplots indicate the lower quartile, median and upper quartile, and whiskers indicate minimum and maximum values; P values indicate significance of differences between treatment groups (sFt, serum ferritin; BI, estimated total body iron)
Figure 1 shows that the effect of treatment on the change in both log(sFt) and BI was statistically significant only among women in the lowest quartile of sFt and the lowest half of the BI distribution at baseline, respectively. Change in Hb did not vary by treatment group at any level of baseline Hb and therefore was not included in later regression analyses.
Relative change in biomarkers across the intervention
We next evaluated responders as those whose sFt or BI increased more than 1 sd above the mean change for the control group: >0·31 µg/l change in log(sFt) and >2·76 mg/kg change in BI, respectively. Treatment with DFS (P < 0·01) and baseline sFt < 12·0 μg/l (P < 0·001), BI < 0·0 mg/kg (P < 0·001) and TfR > 8·6 mg/l (P < 0·001) predicted response both in sFt and BI (Table 2). Every 1·0 g/l decrease in baseline Hb (P < 0·01) and 1·0 μg/l decrease in baseline sFt (P < 0·001) predicted response for both sFt and BI. Each 1·0 mg/l increase in baseline TfR (relative risk (RR) = 1·02, P < 0·05) predicted response in sFt. Models for baseline BI did not converge.
Table 2 Baseline predictors of relative response‡ in iron status to an intervention of double-fortified salt in female Indian tea pluckers: univariate analysis
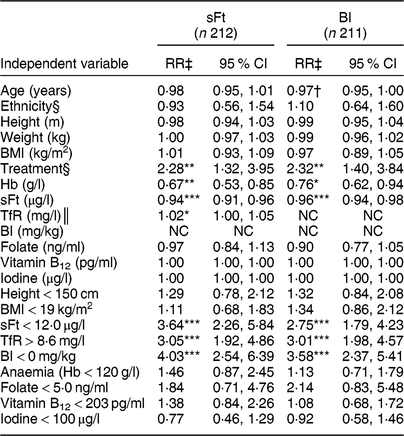
sFt, serum ferritin; BI, estimated total body Fe; RR, relative risk; TfR, soluble transferrin receptor; NC, model did not converge.
†P < 0·1; *P < 0·05; **P < 0·01; ***P < 0·001.
‡ Relative response defined as increase in Fe biomarkers more than 1 sd above the mean of the change in the control group; change in log(sFt) > 0·31 µg/l; change in BI > 2·76 mg/kg.
§ Reference values for independent variables: ethnicity, Adivasi; treatment, iodized salt.
║ Corrected by Ramco assay.
Resolution of deficiency
Resolution of deficiency is commonly used to evaluate the success of nutrition interventions, e.g.( Reference Low, Speedy and Styles 40 , Reference Wu, Liu and Li 41 ). We examined several definitions of the resolution of Fe deficiency, low BI and anaemia by treatment group with univariate binomial regression models (Table 3). Only the RR for resolution of baseline sFt < 12·0 μg/l (RR = 2·31 in DFS v. IS, P = 0·01) and BI < 0·0 mg/kg (RR = 2·78 in DFS, P = 0·01) differed significantly by treatment group, although RR for resolution of baseline anaemia approached significance (P = 0·07). Some studies use a less stringent definition of Fe deficiency; thus, we also examined the resolution of sFt < 15 μg/l( Reference Petry, Olofin and Hurrell 37 ). This cut-off had some discriminatory value; the RR for resolution approached statistical significance in this sample (P = 0·06).
Table 3 Resolution of deficiency by various measures of iron status and anaemia in female Indian tea pluckers by treatment group

IS, iodized salt; DFS, double-fortified salt; RR, relative risk; sFt, serum ferritin; BI, estimated total body Fe.
†P < 0·1; *P < 0·05.
‡ Risk of resolution, reference group: IS.
Baseline characteristics of resolution
Results were similar for sFt and BI, and thus only BI results are presented here. Baseline characteristics of participants are shown in Tables 4 and 5 by resolution group: non-deficient women with baseline BI ≥ 0·0 mg/kg and deficient women with baseline BI < 0·0 mg/kg. Women with low baseline BI were further divided into resolvers (BI > 0·0 mg/kg at endline) or non-resolvers. All baseline Fe biomarkers were lower in those with baseline low BI compared with those with normal baseline BI status, but only sFt and BI differed between resolvers and non-resolvers: 7·0 μg/l v. 4·0 μg/l for sFt and –1·6 mg/kg v. –4·8 mg/kg for BI, respectively (P < 0·05). CRP was elevated in those with normal baseline Fe status compared with resolvers (P < 0·05). Resolvers were shorter than women with normal baseline Fe status (P < 0·05; Table 4).
Table 4 Baseline median haematological characteristics of Indian female tea pluckers grouped according to resolution of low body iron after a double-fortified salt intervention
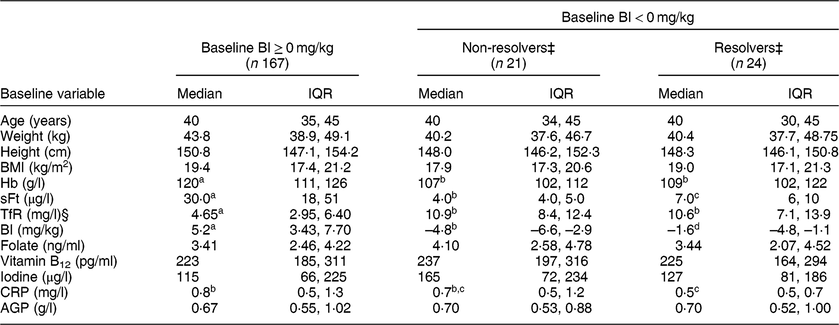
BI, estimated total body Fe; IQR, interquartile range; sFt, serum ferritin; TfR, transferrin receptor; CRP, C-reactive protein; AGP, α1-acid glycoprotein.
a,b,c,dMedian values within a row with unlike superscript letters were significantly different by the Hodges–Lehman–Sen test; P values for differences are <0·01 unless marked as b v. c (P < 0·05).
‡ Non-resolvers, BI < 0·0 mg/kg at endline; resolvers, BI ≥0·0 mg/kg at endline.
§ Corrected by Ramco assay.
Table 5 Baseline prevalence of demographic and haematological status of Indian female tea pluckers grouped according to resolution of low body iron after a double-fortified salt intervention
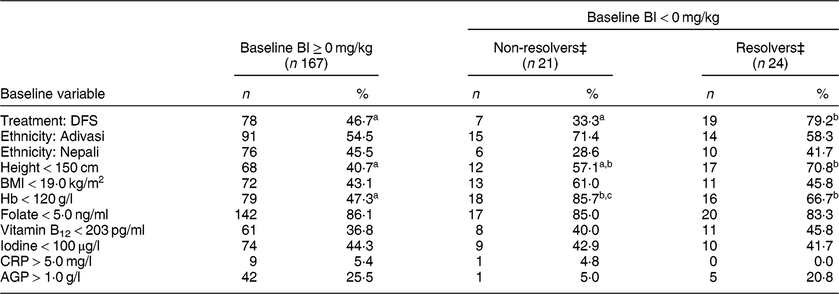
BI, estimated total body Fe; DFS, double-fortified salt; CRP, C-reactive protein; AGP, α1-acid glycoprotein.
a,b,cPercentage values within a row with unlike superscript letters were significantly different by the χ 2 test; a v. b, P < 0·05; a v. c, P < 0·01.
‡ Non-resolvers, BI < 0 mg/kg at endline; resolvers, BI ≥ 0 mg/kg at endline.
Table 5 shows that a greater proportion of resolvers were in the DFS group compared with the non-resolvers and those with normal baseline BI status. Prevalence of anaemia was also greater in the resolvers and non-resolvers compared with those with normal baseline Fe status (P < 0·05). Baseline folate, vitamin B12 and iodine did not differ between groups, and there was a high prevalence of folate (>85 %) and vitamin B12 (>34 %) deficiencies in this sample. Participants with normal baseline Fe values were somewhat more likely to have baseline AGP > 1·0 g/l compared with non-resolvers (P < 0·09) after accounting for multiple comparisons.
Change in Fe biomarkers from baseline to endline differed between resolvers and non-resolvers (Table 6). Change in sFt, TfR and BI was significantly different between BI resolution groups (P < 0·01). Change in Hb did not differ between BI resolvers and non-resolvers (P = 0·1). Urinary iodine changed similarly between resolution groups, and folate and vitamin B12 concentrations did not change from baseline to endline in either resolution group.
Table 6 Changes in Hb and multiple micronutrient status indicators in the resolvers and non-resolvers of low body iron over the 10-month intervention of double-fortified salt among Indian female tea pluckers
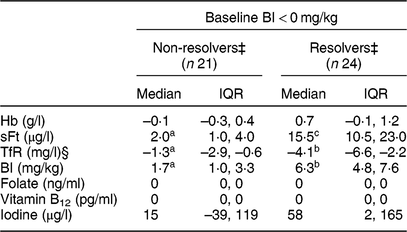
BI, estimated total body Fe; IQR, interquartile range; sFt, serum ferritin; TfR, transferrin receptor.
a,b,cMedian values within a row with unlike superscript letters were significantly different by the Hodges–Lehman–Sen test: a v. b, P < 0·01; a v. c, P < 0·001.
‡ Non-resolvers, BI < 0 mg/kg at endline; resolvers, BI ≥ 0 mg/kg at endline.
§ Corrected by Ramco assay.
Univariate binomial regression models revealed DFS treatment and baseline BI predicted resolution of BI < 0·0 mg/kg (P = 0·01, Table 7). No multivariate models significantly predicted resolution of sFt < 12·0 μg/l or BI < 0·0 mg/kg (data not shown).
Table 7 Baseline univariate predictors of low body iron resolution to an intervention of double-fortified salt in female Indian tea pluckers
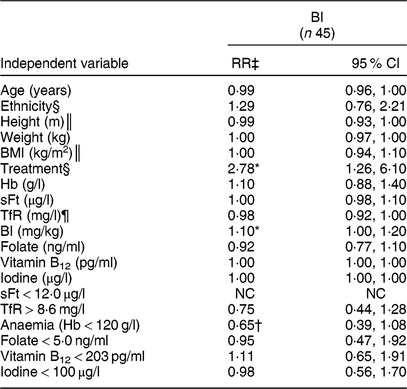
BI, estimated total body Fe; RR, relative risk; sFt, serum ferritin; TfR, transferrin receptor; NC, model did not converge.
†P < 0·1; *P < 0·05.
‡ BI < 0 mg/kg at baseline and BI ≥ 0 mg/kg at endline.
§ Reference values for independent variables: ethnicity, Adivasi; treatment, iodized salt.
║ Height < 150 cm and BMI < 19 kg/m2 were also tested; results were not different from continuous variables.
¶ Corrected by Ramco assay.
Discussion
In order to respond to DFS, one must have a potential to benefit from the intervention. Fe status is controlled by absorption rather than excretion mechanisms. Thus, women with low Fe status at baseline are expected to absorb more Fe, resulting in a greater increase in Fe concentration than in women with higher baseline Fe status( Reference Fairchild, Haas and Habicht 42 ).
Using as a foundation the biological plausibility analyses presented in Haas et al.( Reference Haas, Rahn and Venkatramanan 24 ), which reported greater increases in the change in BI with lower baseline Fe status, we aimed to identify distinguishing characteristics of individuals whose Fe status improved after the intervention v. individuals with no change – either absolute or relative – in Fe status. We replicated the findings of Haas et al. that consuming DFS predicted a greater increase in BI. We also observed a significant change in sFt in response to DFS consumption( Reference Haas, Rahn and Venkatramanan 24 ).
Unexpectedly, we found only a marginal increase in Hb among women consuming DFS v. IS who were anaemic at baseline. Although anaemia is often used as an inexpensive measure of low Fe status( Reference Asibey-Berko, Zlotkin and Yeung 43 , Reference Rajagopalan and Vinodkumar 44 ), Hb does not decrease to anaemic status until Fe stores are nearly completely depleted( 11 ) and a recent meta-analysis found that, worldwide, less than 40 % of anaemia in women of reproductive age is due to Fe deficiency( Reference Petry, Olofin and Hurrell 37 ). Anaemia can also be caused by a variety of nutrient deficiencies, including folate and vitamin B12 ( Reference Gibson 39 ), which were not affected by this Fe intervention. Consequently, Hb may not be an appropriate measure for predicting responsiveness to DFS in populations with a similarly high prevalence of folate and vitamin B12 deficiencies.
In addition to the analyses of continuous change, we studied predictors of relative change in Fe biomarkers. This technique identified similar predictors of response as in the absolute change analyses and may be useful for targeting interventions using baseline Hb, as this was the only analysis in which baseline Hb predicted response in sFt or BI (see Table 2). As with any method that relies on a cut-off, this approach has the limitation of potentially misclassifying true responders as non-responders because women with marginally low to normal Fe status at baseline would be expected to have only small increases post-intervention.
To examine the greater public health and clinical implications of DFS, we also analysed predictors of resolution of Fe deficiency and low BI. By definition, baseline Fe biomarkers were higher in those with normal baseline Fe status. Thus, those individuals had less potential to benefit from the intervention v. those with low baseline Fe concentrations. We expected those with lower Fe status to have the greatest response to the intervention. However, women with very low sFt and BI at baseline may not have been able to absorb sufficient Fe from DFS over ten months to resolve Fe deficiency, and thus the non-resolvers had lower baseline sFt than the resolvers in the univariate analyses (Table 4).
The body responds to inflammation by sequestering Fe in ferritin, resulting in elevated sFt concentrations that may mask Fe deficiency( Reference Thurnham, McCabe and Haldar 32 ) and affect prevalence estimation of deficiency( Reference Suchdev, Williams and Mei 45 ). This phenomenon may explain why the group with normal sFt and BI at baseline had elevated baseline CRP values relative to those with Fe deficiency or low BI at baseline. If true, inflammation explains a similar relationship in BI resolution because the calculation of BI requires both TfR and sFt( Reference Cook, Flowers and Skikne 31 ).
There were no significant multivariate models of the resolution of Fe deficiency or low BI. However, the study was designed to identify a significant difference in the mean change in sFt concentrations between DFS and IS, and may not be sufficiently powered to detect differences in currently measured predictors of resolution. While resolution analyses are useful for identifying predictors of response and can be used to target future interventions in similar populations, they are limited because they do not account for the positive change in Fe biomarkers in those with an increased potential to benefit unless the change causes Fe concentration to cross a threshold marked by a given cut-off of deficiency. Further, such analyses do not account for increases in Fe status among women who had low but technically sufficient Fe status at baseline. Future interventions and programmes should consider the limitations of relying solely on resolution of deficiency as a benchmark for success and may benefit from using other or additional models of response, including the absolute and relative change models we present here.
Our goal was to understand the multiple underlying predictors of response to dietary Fe interventions. BI provides a composite measure of Fe status from severe deficiency to repletion, but is limited in some settings because it requires assessment of both sFt and TfR. Large public health interventions with limited resources and may require a smaller number of indicators. Although BI serves as a gold standard by permitting assessment across the range of resolution, our results show that measuring sFt, perhaps in combination with Hb, is a reasonable alternative to BI which will still adequately predict response to DFS interventions.
The present study was a randomized controlled trial, with successful randomization at baseline, appropriate sample size to test efficacy and reasonable compliance. The strong study design supports the robust secondary analyses presented here. Although the randomized controlled trial design provides strong internal validity, the generalizability of the results is limited to other similar populations( Reference Habicht and Pelto 25 , Reference Habicht, Victora and Vaughan 27 , Reference Victora, Habicht and Bryce 29 , Reference Fairchild, Haas and Habicht 42 ). Thus, our findings can be applied to other populations of South Asian women of reproductive age, with high prevalence of Fe deficiency and of non-Fe deficiency anaemia, consuming DFS.
The results presented here are secondary analyses and cannot be interpreted with the same assumptions of causality as an intention-to-treat analysis. However, the results were confirmed with multiple types of analyses that defined response to the intervention by different criteria. The study may not have been adequately powered to identify all covariates which predict response to a DFS intervention. For example, although height at baseline differed slightly between the responders and those with no potential to benefit, height did not significantly predict response in the regression analyses.
Conclusion
DFS is increasing in popularity as a vehicle to resolve and prevent Fe deficiency, particularly among rural populations in low- and middle-income countries with limited access to dietary supplements or Fe-rich foods, and among populations with low adherence to dietary supplements( Reference Andersson, Thankachan and Muthayya 19 , Reference Wegmuller, Camara and Zimmermann 21 – Reference Zimmermann, Zeder and Chaouki 23 , Reference Latunde-Dada 46 ). The present analyses demonstrate that salt double-fortified with microencapsulated ferrous fumarate and potassium iodate is a viable method for resolving Fe deficiency and low BI in this population. Importantly, we demonstrate that low concentrations of BI and sFt at baseline are the best predictors of response to a DFS intervention, regardless of whether individuals are clinically deficient at baseline. Further, measuring Hb alone may not be a sufficient marker of response, nor of potential to benefit from an intervention. Future studies evaluating DFS and programmes targeting similar interventions should: (i) replicate these findings in other populations; (ii) examine changes in sFt and BI, in addition to Hb, to better target Fe interventions, especially if there is a high prevalence of non-Fe deficiency anaemia in the population; and (iii) use these methods to evaluate the impact of DFS interventions on functional outcomes. Additionally, effectiveness studies are needed to test the ability of DFS to increase resolution of Fe deficiency in community settings v. an experimental field setting.
Acknowledgements
Acknowledgements: The authors thank Françoise Vermeylen for assistance in the early stages of data preparation and analysis, as well as Kim Harding from the Micronutrient Initiative (now Nutrition International) and Gregory Reinhart formerly from Mathile Institute for the Advancement of Human Nutrition for their helpful comments on the manuscript. Financial support: This study was supported by the Micronutrient Initiative (now Nutrition International), Ottawa, Canada; and the Mathile Institute for the Advancement of Human Nutrition, Dayton, OH, USA. Funders had no role in the design, analysis or writing of this article. Conflict of interest: J.D.H. was a paid consultant for and J.E.H.N. was supported by a stipend from the Micronutrient Initiative during this project. S.M. is an unpaid board member for a diagnostic start-up focused on measurement of nutritional biomarkers at the point of care utilizing the results from his research. Authorship: J.E.H.N. conducted the data analysis and contributed to writing the manuscript; S.V. supervised data collection and contributed to the data analysis and manuscript preparation; S.M. contributed to the data analysis and manuscript preparation; and J.D.H. developed the proposal, supervised data collection and analysis, contributed to writing the manuscript, and had primary responsibility for the final content. All authors read and approved the final manuscript. Ethics of human subject participation: This study was conducted according to the guidelines laid down in the Declaration of Helsinki and all procedures involving human subjects were approved by the institutional review boards at Cornell University, McGill University and the Child In Need Institute (Kolkata, India). Verbal informed consent was obtained from all subjects, and was witnessed and formally recorded. Clinical trial registry: This trial was registered at clinicaltrials.gov as NCT01032005.
Supplementary material
To view supplementary material for this article, please visit https://doi.org/10.1017/S1368980019001800


