


Paediatric obesity is recognised as a national epidemic associated with various comorbidities that threaten the future health and quality of life of many young children as they progress into adulthood(Reference Styne, Arslanian and Connor1–Reference Freedman, Dietz and Srinivasan3). The 2015–2016 National Health and Nutrition Examination Survey reported an obesity prevalence of 18·5 % among the paediatric population of the USA(Reference Hales, Carroll and Fryar4). Of those surveyed, the lowest prevalence of obesity (11 %) was found in the Asian American paediatric population compared with that of the other racial groups (22, 25 and 14·1 % for the non-Hispanic black, Hispanic and non-Hispanic white paediatric populations, respectively)(Reference Hales, Carroll and Fryar4). The growth reference developed by the Centers for Disease Control and Prevention (CDC) has been recommended for clinical use throughout the USA to assess weight status based on BMI as a percentile compared with a reference population in children and adolescents. In the development of the CDC growth reference, only 2 % of the reference population was Asian/Pacific Islander(Reference Kuczmarski, Ogden and Guo5,6) .
Since overweight and obesity of children are determined by comparison with the growth patterns of a reference population, the lack of ethnic representation in the CDC growth reference may lead to inaccurate assessment of weight status, especially given the diversity of Asian American populations.
It has been generally accepted that all children have the same genetic potential for growth and follow the same growth patterns given the same environmental conditions(Reference Butte, Garza and de Onis7). In well-nourished young children, the WHO found that growth patterns were similar in diverse populations; however, differences in height and weight were seen in South and East Asian populations compared with other populations. Special attention was made to include Asian populations in the development of the WHO growth standard for young children under 5 years(Reference Victora, de Onis and Garza8,9) . In children aged 5 years and over, there is not enough evidence to attribute differences between different populations to solely environmental conditions and the inclusion of multi-ethnic populations in developing growth references was strongly recommended by the WHO(Reference Butte, Garza and de Onis7).
Asian adults have been shown to have a higher body fat percentage and greater cardiovascular risks compared with their non-Asian counterparts with the same BMI due to variations in muscularity and body frame(Reference Deurenberg, Deurenberg-Yap and Guricci10–Reference Hsu, Araneta and Kanaya12). Recognising that the BMI cut-offs of 25 kg/m2 for overweight and 30 kg/m2 for obesity may underestimate the associated health risks of excess body fat in many Asian populations, the WHO expert consultation report recommended additional public health action points in Asian adults at BMI of 23 and 27·5 kg/m2 to indicate points of increased risk for clinical action(13). Based on this report and other supporting evidence, the American Diabetes Association has recommended diabetes screening in Asians starting at the BMI of 23 kg/m2(Reference Hsu, Araneta and Kanaya12). This ethnic difference in BMI to body fat relationship among Asian adults raises the issue of whether overweight/obesity cut-offs for Asian children should be lowered and whether international or ethnic-specific growth references with more Asian representation are more appropriate in assessing weight status for Asian children(Reference Au, Lau and Chao14,Reference Wang and Hui15) .
There were concerns regarding the appropriateness of using the CDC or international growth references for the measurement of overweight and obesity in various paediatric populations(Reference Butte, Garza and de Onis7,Reference Fu, Lee and Ng16–Reference Mushtaq, Gull and Mushtaq18) . Comparison studies have been conducted in various countries to determine the prevalence of overweight and obesity of their children and youth based on different reference populations and cut-off criteria(Reference Ko, Ozaki and Wong19–Reference Zong and Li22). Studies with Hong Kong Chinese youth found a higher prevalence of obesity using the ethnic-specific growth reference developed with the 1993 Hong Kong Growth Survey compared with other growth references such as the ones developed by the International Obesity Task Force (IOTF) and the CDC(Reference Wang and Hui15,Reference Ko, Ozaki and Wong19) . Other studies based on BMI references in Canada and Portugal reported higher percentages of obesity using WHO diagnostic cut-points in comparison with those of IOTF or CDC(Reference Shields and Tremblay21,Reference de Sousa Lopes23) .
Despite the increasing literature on the comparison of various growth references, similar studies have yet to be conducted in the USA in its Chinese American paediatric population, a unique population with Chinese ancestry and raised in a mixture of Asian and American culture. Given the underrepresentation of Asian Americans in the CDC growth reference and the difference in fat distribution found in Asian Americans adults(6), the aim of this study is to determine the disparity between the overweight and obesity prevalence of the Chinese American children and adolescents as measured by the CDC growth reference and the prevalence as measured by international and ethnic-specific-growth references.
Methods
Study design and participants
This is a cross-sectional study that was conducted at the Charles B. Wang Community Health Center (CBWCHC), a Federally Qualified Health Center in New York City that serves a predominantly Chinese American population. The criteria for study participants include children who were aged 6–17 years during their routine health maintenance visit at CBWCHC during the year 2017 and are of Chinese ethnicity. All patients who met the inclusion criteria were included in the study.
Growth references
Overweight and obesity prevalence in the paediatric population was determined by using BMI percentiles based on four different growth references including the CDC growth reference, international growth references (IOTF and WHO) and an ethnic-specific growth reference developed by China(Reference Kuczmarski, Ogden and Guo5,Reference Zong and Li22,Reference Cole, Bellizzi and Flegal24,Reference de Onis, Onyango and Borghi25) . Growth references are developed to monitor the growth of children compared with a reference population. The population used in the development of each growth reference is described in Table 1. All age ranges presented in the table are inclusive.
Table 1 Reference population of national, ethnic Chinese and international growth references
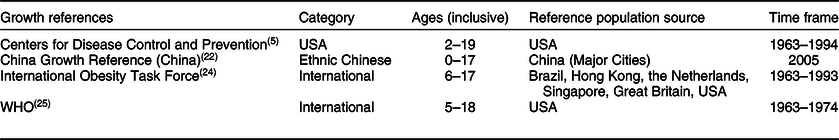
The CDC growth reference for the USA was developed based on data from five national surveys (National Health Examination Survey and National Health and Nutrition Examination Survey) collected between 1963 and 1994 for the paediatric population aged 2–19 years(Reference Kuczmarski, Ogden and Guo5). Overweight and obesity cut-offs were defined as a BMI-for-age greater than or equal to 85th and 95th percentiles, respectively.
An international growth reference was developed by the IOTF for children aged 2–17 years based on the merged BMI curves from Hong Kong, Brazil, USA, Great Britain, Singapore and the Netherlands(Reference Cole, Bellizzi and Flegal24). Weight status cut-points were created for children that correspond to the adult BMI cut-points at age 18 where overweight and obesity were defined as a BMI-for-age greater than or equal to 25 and 30, respectively.
The WHO growth reference for children aged 5–18 years was based on the National Health Examination Survey, cycles II and III, and National Health and Nutrition Examination Survey, cycle I, from the years 1963 to 1974(Reference de Onis, Onyango and Borghi25). The data for children aged 5–18 years were combined with the growth standards for children under 5 years, which was developed from a multinational population, and then smoothed to generate a growth curve. Based on the WHO, overweight is defined as a BMI-for-age +1 sd above the mean, whereas obesity is a BMI-for-age +2 sd above the mean.
The Chinese growth reference was constructed using national data for urban Chinese children aged 0–17 years from the National Survey on the Physical Growth and Development of Children and the Chinese National Survey on Student’s Constitution and Health between 1975 and 2005(Reference Zong and Li22). Definitions of overweight and obesity are the same as those of the WHO in which overweight is +1 sd above the mean and obesity is defined as +2 sd above the mean for the child’s sex and age.
Data
At each annual health visit at CBWCHC, height and weight were measured by clinically trained nursing staff to determine the patient’s BMI, measured by weight in kilograms over the height in meters squared. BMI percentile curves were programmed into the Centricity Practice Solution v12.0 electronic medical records system (Virence Health Technologies) for each reference population. The LMS tables containing the skewness (L), median (M) and the CV (S) for each reference population by sex and age were entered into the electronic medical records system(Reference Kuczmarski, Ogden and Guo5,Reference Zong and Li22,Reference Cole, Bellizzi and Flegal24,Reference Cole26–Reference Flegal and Cole28) . A smoothing formula was applied to generate growth curves(Reference Cole and Green29). BMI percentile specific to each growth reference was automatically displayed on the screen and stored into the electronic medical records upon entering height and weight at each medical visit.
A de-identified data set was extracted from the electronic medical records with participants’ age, sex, place of birth, BMI and BMI percentiles based on the four different reference populations. To be consistent with the age cut-offs of CDC reports, age was categorised into school-age (6–11 years) and adolescence (12–17 years)(Reference Hales, Carroll and Fryar4). We applied cut-off points developed specifically for each growth reference to determine overweight and obesity.
Statistical analysis
The Cochran’s Q test was used to test differences in the overweight and obesity prevalence as determined by the four growth references. Alpha for Cochran’s Q tests was set to 0·05. Where significance was found in the Cochran’s Q test, post hoc group comparisons were done using the McNemar test to compare overweight and obesity prevalence based on using the CDC reference population to the proportions based on the IOTF, WHO and China populations. The Bonferroni correction was used to limit type I errors caused by multiple comparisons within the same data set. Since three comparisons were made, alpha was adjusted to 0·017 for the McNemar’s analyses. We estimated that a sample size of at least 425 is needed to obtain over 90 % power to detect a difference of 2 % with an alpha of 0·05. All statistical analyses were performed using SPSS version 23.0 (IBM Corp.).
Results
In 2017, 10 429 patients aged 6–17 years received an annual health maintenance visit at CBWCHC. Based on the eligibility criteria of Chinese ethnicity, 9160 patients were included in the study. There were 4825 (52·7 %) boys and 4335 (47·3 %) girls. There were 4896 (53·4 %) in the school-age range and 4264 (46·6 %) in the adolescent age range. Of the 99·3 % of children who reported their birthplace, 74·1 % were born in the USA (see Table 2).
Table 2 Demographic characteristics of Chinese American children by age group, 2017 (N 9160)
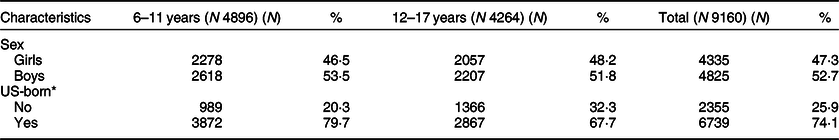
* Missing data consists of less than 1 % of total and was excluded from table and analysis.
Overweight
The overweight prevalence estimated by the four growth references, stratified by age and sex, is presented in Table 3. Overall, CDC reference measured the overweight prevalence at 23·9 %, the internationally used growth references, IOTF and WHO measured the prevalence at 23·2 and 29·8 %, respectively, and the China growth reference measured the highest overweight prevalence at 31·1 %. Overweight prevalence was not equivalent across the four references for all sex and age groups (P < 0·001). Overweight prevalence as determined by the national, international and ethnic-specific growth references was graphed by age group and sex in Fig. 1. The prevalence determined from each growth reference was individually compared with the prevalence based on the CDC growth reference.
Table 3 Prevalence of overweight among the Charles B. Wang Community Health Center (CBWCHC’s) Chinese American youth by sex and age determined by various growth references, N 9160
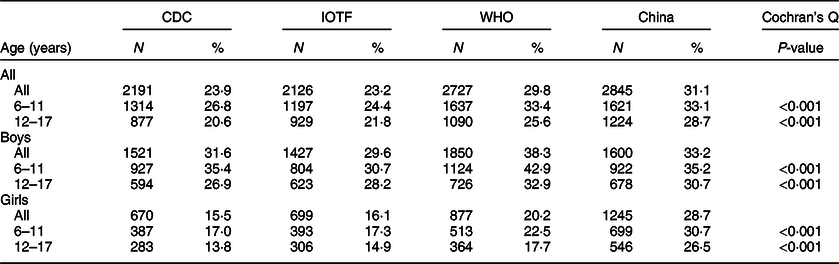
CDC, Centers for Disease Control and Prevention; IOTF, International Obesity Task Force.
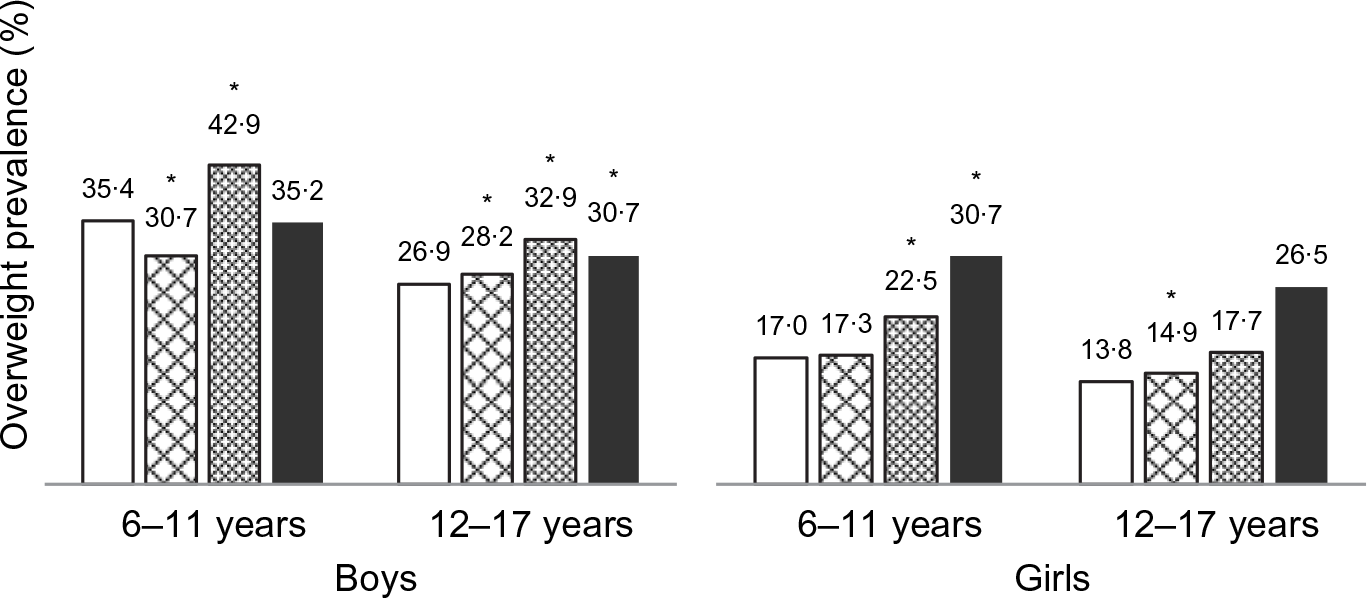
Fig. 1 Prevalence of overweight in Chinese American boys and girls as measured by the Centers for Disease Control and Prevention (CDC), International Obesity Task Force (IOTF), WHO and China growth references (China) (N 9160). *<0·001 compared with CDC. ![]() , CDC;
, CDC; ![]() , IOTF;
, IOTF; ![]() , WHO;
, WHO; ![]() , China
, China
In school-aged boys, the CDC measured 35·4 % overweight prevalence. The IOTF measured lower overweight prevalence at 30·7 % (P < 0·001), and the WHO measured higher overweight prevalence at 42·9 % (P < 0·001). The China prevalence for overweight was similar to CDC at 35·2 %. In adolescent boys, both international references and the China reference measured higher overweight prevalence (28·2 % in IOTF, 32·9 % in WHO and 30·7 % in China v. 26·9 % in CDC, P < 0·001 for each comparison).
In school-aged girls, the China reference measured 30·7 % overweight prevalence and the WHO measured 22·5 % compared with the CDC estimate of 17·0 %, P < 0·001 for each comparison. IOTF measured similar prevalence at 17·3 %. In adolescent girls, 26·5 % were estimated to be overweight using the China reference, 14·9 % using IOTF and 17·7 % using WHO compared with 13·8 % using CDC, P < 0·001 for each comparison.
Obesity
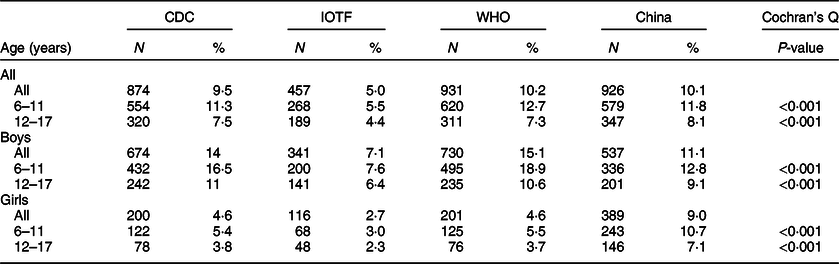
The same analyses were done to assess the prevalence of obesity among this paediatric population and are shown in Fig. 2. Based on the four growth references, the overall obesity prevalence in this Chinese American paediatric population ranged from 5·0 to 10·2 % (Table 4). Obesity prevalence as measured by the four growth references was not equivalent for all sex and age groups, P < 0·001.

Fig. 2 Prevalence of obesity in Chinese American boys and girls as measured by the Centers for Disease Control and Prevention (CDC), International Obesity Task Force (IOTF), WHO and China growth references (China) (N 9160). *<0·001 compared with CDC. ![]() , CDC;
, CDC; ![]() , IOTF;
, IOTF; ![]() , WHO;
, WHO; ![]() , China
, China
Table 4 Prevalence of obesity among the Charles B. Wang Community Health Center (CBWCHC’s) Chinese American youth by sex and age determined by various growth references, N 9160
CDC, Centers for Disease Control and Prevention; IOTF, International Obesity Task Force.
In school-aged boys, IOTF (7·6 %) and China (12·8 %) estimated lower obesity prevalence and WHO estimated higher obesity at 18·9 % compared with the CDC (16·5 %), P < 0·001 for each comparison. In adolescents, IOTF (6·4 %) and China (9·1 %) estimated lower obesity prevalence compared with CDC (11·0 %), P < 0·001 for each comparison, while the WHO measured similar obesity prevalence at 10·6 %.
In school-aged girls, compared with the CDC’s measurement of 5·4 % obesity, IOTF measured lower prevalence at 3·0 %, P < 0·001, WHO measured similar prevalence at 5·5 %, and China measured higher prevalence at 10·7 %, P < 0·001. In adolescent girls, CDC measured the obesity prevalence to be 3·8 %, while China estimated the higher obesity at 7·1 %, P < 0·001, IOTF estimated lower prevalence at 2·3 %, P < 0·001, and WHO measured similar prevalence at 3·7 %.
Discussion
This study found discrepancies in overweight and obesity prevalence as measured by CDC, WHO, IOTF and a China growth reference. While over-reporting overweight and obesity leads to the follow-up of all at-risk children, under-reporting leads to missed opportunities for corrective measures. Overall, 7 % of the paediatric Chinese American population at CBWCHC may be misclassified as normal weight under the CDC growth reference and will not be identified for further follow-up. The largest discrepancy was found in girls using the Chinese reference compared with CDC; CDC identified about half as many overweight and half as many obese Chinese American girls compared with using the ethnic-specific reference.
These findings are in line with the current literature. Studies found that BMI-based classification from CDC, WHO and IOTF has low sensitivity in determining excess body fat in children of East Asian descent(Reference Wang and Hui15,Reference Duncan, Duncan and Schofield30,Reference Liu, Byrne and Kagawa31) . Asian children were found to have higher body fat at a fixed BMI compared with Caucasian children and that the Chinese reference had the highest sensitivity to detect excess body fat compared with non-ethnic specific growth references(Reference Liu, Byrne and Kagawa31). Using the WHO criteria missed nearly one-third of obese Asian children and using the IOTF reference missed nearly half of obese Asian children(Reference Liu, Byrne and Kagawa31). Studies done in Hong Kong also found the ethnic-specific Hong Kong reference measured the highest overweight and obesity compared with using WHO, CDC or IOTF(Reference Wang and Hui15,Reference Ko, Ozaki and Wong19) . A multi-ethnic study that only looked at girls in New Zealand found that more than a third of East Asian girls were not correctly identified as overweight using the WHO and IOTF criteria(Reference Duncan, Duncan and Schofield30).
The disparity between measured prevalence was more prominent in girls than boys in this study. This could due to the physiological differences between boys and girls of different ethnicities. Studies that disaggregated the sexes found that Asian girls have more body fat than Caucasian girls at a fixed BMI(Reference Freedman, Wang and Thornton32). The few studies on Asian boys found mixed results; one study found no difference between boys of different ethnicities(Reference Rush, Puniani and Valencia33), while another found Asian boys had higher body fat compared with Caucasian boys at the same BMI(Reference Deurenberg, Deurenberg-Yap and Foo34). More studies are needed to examine physiological differences between boys of different ethnicities.
To adjust for ethnic differences in multi-ethnic populations, researchers have suggested implementing ethnic-specific cut-off points(Reference Liu, Byrne and Kagawa31,Reference Duncan, Duncan and Schofield35–Reference de Wilde, Zandbergen-Harlaar and van Buuren37) . Duncan et al. developed ethnic-specific thresholds with lower thresholds for East Asian girls to better assess obesity in the diverse population in New Zealand(Reference Duncan, Duncan and Schofield35). Another set of ethnic-specific cut-off points for IOTF was developed for South Korean girls aged 8–18 years based on the recommended cut-offs for adults at BMI of 23 and 25 kg/m2 for overweight and obesity, respectively(Reference Jih, Mukherjea and Vittinghoff11,Reference Kim, Hwang and Woo36) . A study of South Asians in the Netherlands suggested developing ethnic-specific cut-offs to assess weight in different ethnicities(Reference de Wilde, Zandbergen-Harlaar and van Buuren37).
Similar to other studies, our study shows ethnic Chinese boys were more overweight and obese than ethnic Chinese girls in all age categories(Reference Freedman, Mei and Srinivasan38–Reference Wang, Gao and Lau40). In our study, the disparity between the sexes based on the China growth reference was much less than that measured by the CDC, WHO and IOTF growth references. When using the CDC growth reference, the overweight prevalence in Chinese boys doubles that of girls and obesity prevalence in boys triples that of girls. The prevalence in girls found by the ethnic-specific China reference was much closer to the prevalence found in boys using the same reference. Obesity disparities between boys and girls were not found in the general US population(Reference Hales, Carroll and Fryar4).
The magnitude of the difference in prevalence between CDC and the other growth references raises concerns and points to possible under-diagnosis of overweight and obesity, especially in the Chinese girls. The use of ethnic-specific growth references may be a more accurate measurement of the weight status of the Chinese American population. Continuing to use the CDC growth reference may be a missed opportunity for early intervention to provide guidance for weight management, which may be important given the mounting evidence that childhood obesity is a risk factor for adult obesity and cardiovascular disorders(Reference Freedman, Dietz and Srinivasan3,Reference Freedman, Mei and Srinivasan38) . There is substantial literature showing Asian adults with increased risks of obesity-related conditions found at a lower BMI compared with other racial groups(Reference Deurenberg, Deurenberg-Yap and Guricci10,Reference Jih, Mukherjea and Vittinghoff11,13) . Longitudinal studies in various populations have linked childhood weight status to obesity-related morbidity in adulthood. Identifying and treating the at-risk population at a younger age has greater chances of preventing adult-onset morbidity and mortality.
There are several limitations to this retrospective, cross-sectional study. Since this study does not measure patient adiposity in conjunction with BMI, the most appropriate growth reference to accurately diagnose and assess risk for overweight within the Chinese American paediatric population cannot be definitively determined. However, BMI is a quick and non-invasive method of estimating body fat and is effective in its use of monitoring overall obesity trends in a population. In addition, participants for this study were recruited from one urban community health center in New York City. This might limit the study’s ability to generalise to other Chinese communities within the USA and other settings. Despite these disadvantages, this study has a large sample of the ethnically Chinese paediatric population in the USA and raises important questions of how well we are identifying childhood obesity in ethnic-specific populations with the CDC growth reference.
Conclusion
This study found that the CDC missed almost half of the overweight and half of the obese Chinese American girls compared with an ethnic-specific growth reference. Using the CDC growth reference and its current cut-off points to determine weight status in Chinese American children may underdiagnose overweight and obesity and delay appropriate monitoring, evaluation and intervention for possible weight-related comorbid conditions. Practitioners may want to consider consulting an international or ethnic-specific growth reference to assess for overweight or obesity if suspected in Chinese American children with increased growth parameters.
Acknowledgements
Acknowledgements: We gratefully acknowledge Cindy Huang for her assistance in cleaning a preliminary data set and Naumi Feldman, Kenneth Shieh and Perry Pong for the review of an earlier version of the manuscript. Financial support: This research received no specific grant from any funding agency, commercial or not-for-profit sectors. Conflict of interest: None. Authorship: J.D.L. designed the study, analysed the data and wrote the manuscript, L.E. analysed the data and reviewed the manuscript, E.C. designed the study and reviewed the manuscript, O.Z. analysed the data and wrote the manuscript, C.Y. cleaned the data and reviewed the manuscript, R.T. reviewed the manuscript, L.A. designed the study and contributed to writing and editing the manuscript. Ethics of human subject participation: This study was conducted according to the guidelines laid down in the Declaration of Helsinki, and all procedures involving study participants were approved by the Association of Asian Pacific Community Health Organizations Institutional Review Board. Written informed consent was waived because the data used were de-identified.


