


Analyses of marketing trends, in France and the USA, show that low-cost foods and beverages are growing in popularity. One reason why the food supply is being segmented in this way is to meet the demands of a more budget-conscious consumer for lower-cost foods. The same product or product category can broaden its appeal across social strata when offered at different price points. Offering the same product at a lower price is an effective way to compete with the more costly brand name products.
In France, the introduction of food discount stores during the 1980s further intensified the competition between food distributors, contributed to the diversification of brands and reduced the dominance of brand name products. The repercussions of such price wars on consumer nutritional status and health are not clear. In particular, it is not clear whether low-cost foods are of the same nutritional quality as their more costly equivalents. In France, 36 % of consumers think that ‘low-cost’ products are of poorer quality than the equivalent brand name products and 15 % think the same about the distributors’ own brands(Reference Moati and Ranvier1).
In general, the nutritional quality of diets tends to be inversely linked to their energy cost, i.e. their cost per 10 MJ(Reference Andrieu, Darmon and Drewnowski2, Reference Maillot, Darmon, Vieux and Drewnowski3). This relationship has been attributed to the existence of a ‘nutritional quality/price’ hierarchy across main food groups: the recommended fruit and vegetables, lean meat and fish have a high nutritional value but are expensive sources of dietary energy; in contrast, foods for which restricted consumption is advised, notably those high in added fat, added sugar and salt, tend have low nutritional value but are cheap sources of energy(Reference Maillot, Darmon, Darmon, Lafay and Drewnowski4). These results, however, were obtained by using an average price for the foods, so they do not allow examination of the possible link between nutritional quality and price within a particular food category.
The present study examined a possible link between the nutritional quality and the price of different products within a particular food category. Unfortunately, French tables of food composition do not usually distinguish between products of the same name but of different brands and/or prices. Furthermore, according to the current European legislation, nutrition labelling is optional whereas the list of ingredients should always be indicated on the label (in descending order of weight)(5). A score based on ingredient lists was therefore developed to explore the relationship between the nutrient quality of low-cost and brand names products and their price.
Materials and methods
Sample of foods studied
Choice of categories
The choice of categories of foods to study was guided by the desire to respond to the most frequent questions regarding the quality of foods sold at discount stores or at low cost. These questions are mainly about ready meals. The most popular ready meals bought by the French population were selected, using household purchases data from the TNS SECODIP 2003 survey. Cassoulet (4·30 % of the total number of canned ready meals bought by the panellists), ravioli (4·14 %), couscous (1·53 %) and sausages with lentils (1·48 %) were chosen for this reason. Other foods such as pizzas or quiche were also included in the study because they are frequently consumed and are often the subject of specific questions about nutritional quality (Table 1). In the present paper, the term ‘category’ denotes the grouping of a given type of food (for example, the vegetable soup category or the cassoulet (meat/bean casserole) category).
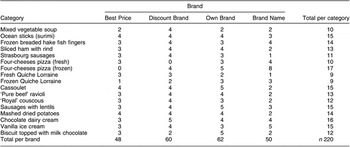
Table 1 Food categories considered in the present study

As the objective was to study the relationship between quality (particularly nutritional) and price ‘within a given food category’, comparisons were made only between foods which had strictly the same sale name. Also, to limit the errors, comparisons were made only between items prepared using the same technological processes that had the same weight (since the size of the pack influences the price per kilogram). For example, deep frozen pizzas and fresh pizzas were regarded as two distinct categories.
Choice of brands
In order to have a wide range of prices for a given category of foods, foods of different brands were selected in each category. In the present paper, the term ‘brand’ describes essentially the type of distribution of the product. Four brands were defined. First, Best Price foods were those sold by a supermarket and labelled as best price by this distributor (this includes, for example, Carrefour’s ‘N°1’ products). Second, Discount Brand foods were those sold by a discount store and carrying the store’s own brand label (this includes, for instance, ‘Dia’ products distributed only by Ed). Third, Own Brand foods were store brand foods of a large distributor (this includes, for example, Carrefour’s brand). Finally, Brand Name foods were well-known national brand foods, sold by several distributors.
The following discount stores were the most important in terms of percentage of the market share in 2005(6): Lidl (4·0 %), Leader Price (3·3 %), Ed (2·2 %) and Aldi (2·1 %). They were therefore chosen as the sources of Discount Brand products in the present study. Supermarkets with the largest market share were Leclerc (17·1 %), Carrefour (14·0 %) and Auchan (9·7 %)(7). They were thus chosen as the sources of Own Brand and Best Price foods.
Recording of prices and nutrition information
The selling prices of the products were recorded only in the Parisian region and over a period of not more than a month (February 2006), to limit errors due to variations over time and space. The list and the order of ingredients, for which labelling is obligatory(5), were recorded for each of the selected foods. According to the European legislation, when nutrition labelling is available it should include at least the energy value and the amount of protein, carbohydrate and fat per 100 g(8). These values were therefore recorded when they were available. This information was partly gathered from the Internet sites of the Auchan and Carrefour chains, which put nutrition information about certain of their own brand products and branded products on their websites. For the other products, the recording was done in the shop with a camera or a Dictaphone.
The ingredient quality score
In order to synthesise the information provided by the list of ingredients and to be able to compare, within a given food category, the quality of the ingredients used, a score called the ‘ingredient quality score’ was developed. Although all the ingredients shown on the labels are perfectly permissible, the presence of some of them might be regarded as problematic from the nutritional and/or toxicological point of view. Since no method has yet been tested out to establish such a score, we have opted for one which seems to us the most intuitive and simple, first by avoiding weighting. This method consisted of drawing up a list of criteria for each food category, and to attribute +1 point to the criteria judged to improve the quality and −1 point for the converse.
Table 1 indicates, for each food category, the criteria taken into account to calculate the ingredient quality score. The list of criteria adopted was different from one category to another, because it depended directly on the list of ingredients specific to each food category. Each time that an ingredient, judged positive or negative, was observed for at least one food in a category, it was selected to be added to the list of criteria contributing to the calculation of the score in this category. On the other hand, when an ingredient was always present in the same position (or in the same quantity where this was indicated) in the list of ingredients for all the foods of a given category, this information was not used when calculating the score, since it did not help to distinguish between the foods in this category. This score was therefore devised simply to compare foods within a given category (it is of no value when comparing foods from one category to another). The presence of palm oil, vegetable oil without specifying its origin (unspecified vegetable oil), hydrogenated vegetable fat (rich in SFA) or partially hydrogenated (potentially rich in trans fatty acids) were regarded as negative criteria, as was the presence of added salt, polyphosphates or sugars, notably sugar syrups enriched with fructose, which may play a role in the epidemic of obesity and diabetes(Reference Bray, Nielsen and Popkin9). The presence of certain food additives was also regarded as a negative criterion, notably monosodium glutamate which may induce over-eating since it is thought to increase the sensation of hunger(Reference Hermanussen, Garcia, Sunder, Voigt, Salazar and Tresguerres10), and certain colorants, such as cochineal and tartrazine, which can produce allergic reactions in certain subjects(Reference Taylor and Hefle11).
An intermediate score was calculated by summing the positive and negative points, after which, within each category, the foods were sorted according to this intermediate score. Finally, within each category, foods were grouped together into four classes: class 1 corresponded to foods with the lowest score and class 4 to the foods with the best score.
Statistical analysis
Multiple linear regression analysis was used to test the correlations between two quantitative variables (for example, price and energy value), including the variable category (transformed into binary indicators) as an adjustment variable. This allowed the correlation to be tested for any food category. The General Linear Model was used to compare means (of price, macronutrient content, etc.) between different brands, after adjustment for the category. The association between two qualitative variables (for example, brand and quality class) was studied using the χ 2 test of independence. The statistical tests were made using the Statistical Package for the Social Sciences statistical software package (SPSS Inc., Chicago, IL, USA) at a 5 % risk level.
Results
Label information
Table 2 shows the distribution, by brand and by category, of the 220 products studied. The number of foods varied from nine to seventeen according to the category, and from zero to eight for a given category and a given brand. The nutritional values were obtained for 196 of the 220 foods. In five of the 196 cases, this information was not directly available on the label, but was obtained from the distributor’s website or by consulting the customer service department. In 11 % of the cases (twenty-four foods out of 220), the nutritional values could not be obtained, even after repeated approaches to the customer service department. Finally, the information on energy, protein, fat and carbohydrate contents were collected in 71 %, 82 %, 97 % and 94 % of cases for the Best Price, Discount Brand, Own Brand and Brand Name foods, respectively. These differences among brands were significant overall (P < 0·05), Best Price and Discount Brand products being those which least often provided nutrition information on their label.
Table 2 Distribution of all food categories within each brand
Price, energy value and macronutrients
The sample used for the statistical analysis was made up of the 196 foods for which nutrition information was available.
Average prices for the brands
Figure 1 shows the mean prices for each category of products. The prices generally follow the following sequence: Best Price < Discount Brand < Own Brand < Brand Name. This was confirmed by calculating the adjusted means (Table 4). The price difference was especially striking between Brand Name products and the others: one needed to add on average 0·57 €/kg when going from a Best Price product to a Discount Brand product and 1·00 €/kg when going from a Discount Brand product to an Own Brand product, but the average difference between Own Brand and Brand Name products was 1·87 €/kg.

Fig. 1 Mean price of each food category according to brand (␣, Best Price; ░, Discount Brand; ▒, Own Brand; █, Brand Name)
Association of energy value and macronutrients with price
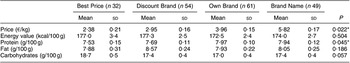
No significant correlation was found between energy value (in kcal/100 g) and price (in €/kg), after adjustment for category (P = 0·147). Similarly, fat (P = 0·288) and carbohydrate (P = 0·267) contents were also not correlated with price, within each food category. On the other hand, a significant positive relationship was found between protein content and price (P = 0·045). The coefficient β of the relationship was 0·31, indicating an increase of 1 g of protein per 100 g of food for a price increase of 0·31 €/kg on average for all the products. Also, the linear correlation was tested on two sub-samples: one for products containing meat or fish and the other for products not containing them. The protein–price relationship persisted in the first sub-sample (P = 0·038) but not in the second (P = 0·447), suggesting that the relationship between protein and price was mainly due to animal protein.
Energy values and mean macronutrient contents by brand
As Table 3 shows, there was no difference between brands regarding energy values and fat and carbohydrate contents, after adjusting for product category. The Best Price and Discount Brand foods, however, had significantly lower protein contents than the Own Brand and Brand Name foods, for which adjusted means were identical. In the Best Price products, the lowest protein content was associated with a higher carbohydrate content (an almost significant test for carbohydrates, P = 0·057).
Table 3 Price, energy value, and contents of protein, fat and carbohydrates per brand (after adjusting for product category)
*Significant difference.
Ingredient quality score
As shown in Table 4, the distribution of foods according to the value of the score (from 1 to 4) was significantly different for the brands (P = 0·001). The majority (62 %) of the Best Price foods had a low quality score (1 or 2) whereas the majority (72 %) of the branded foods had a high score (3 or 4). Similar results were obtained when the sample was restricted to the 196 foods for which nutritional results could be obtained.
Table 4 Distribution of products (%) according to ingredient quality score for each brand

Analysis done on the whole sample (n 220): Pearson’s χ 2 = 29·4; P < 0·001.
Figure 2 indicates, for each brand, the average values of price, energy value and ingredient quality score, this time considered as a quantitative variable (linear), after adjustment for food category. The Brand Name products had an ingredient quality score 1·3 times higher than that of the Best Price ones, for a price 2·5 times as high and an equivalent energy value.

Fig. 2 Price, energy value and ingredient quality score (after adjustment for product category) according to brand (␣, Best Price; ░, Discount Brand; ▒, Own Brand; █, Brand Name). Values are means with 95 % CI represented by vertical bars. The differences were significant for price (P = 0·001) and score (P = 0·007) between brands, but not for energy value (P = 0·504).
Discussion
In agreement with a previous study, our results showed that, for a group of processed foods, low-cost foods cost almost two-and-a-half times less than their brand name equivalents(Reference Cooper and Nelson12). However, contrary to an assertion often made by the media, in the present study the cheapest products were not richer in energy or fattier than the others. This could be explained by the similarity of food production processes for a given food item. Behind different brands there is often one and the same manufacturer. The recipe may vary, but this does not seem to affect the total contents of energy and fats. On the other hand, a positive association was observed between protein content and price, particularly regarding animal protein. The more meat or fish there was in industrially prepared meals, the higher was the price. This is not surprising since it is known that meat and fish are the most expensive sources of energy in food(Reference Maillot, Darmon, Darmon, Lafay and Drewnowski4).
Minimal nutrition information (energy and macronutrients) was given on the label for 87 % of the foods in our sample. This was of the same order of magnitude as the percentage observed (80 %) in the UK for packaged foods(Reference Cowburn and Stockley13). The percentage was lower for the Best Price (71 %) or Discount Brand (82 %) products than for the Own Brand ones (97 %) and the Brand Name ones (94 %). However, the conclusions of the analyses made from the ingredient quality scores were similar whether they were made on the entire sample or just on the foods for which nutrition information was available (data not shown). This suggests that the absence of labelling with nutrition information is more due to these sectors’ disinterest concerning nutrition, or the desire to reduce the costs associated with this labelling, than a wish to mask an inferior nutritional quality.
The present results do not imply, however, that the food quality is similar within a given food category regardless of brand. In particular, the positive relationship observed between protein and price may be accompanied by an association, also positive, between price and micronutrient content because proteins, particularly animal proteins, are usually the source of numerous micronutrients in food. In addition, the results do not exclude the possibility that the macronutrient quality may differ according to price. In fact, similar quantities of fats can mask important differences in the fatty acid composition, with varying proportions of SFA and very variable ratios of n-6 and n-3 fatty acids. Likewise, similar total carbohydrate contents can mask large differences in the contents of simple carbohydrates.
The almost complete absence of rigorous studies on the comparative quality of low-cost foods and branded foods contrasts strikingly with frequent media coverage of this question. The rare studies available seem to indicate the absence of a relationship between the nutritional quality of a food and its price or brand within a given food category. Thus, a French study found a greater uniformity of quality (considered in terms of nutrient contents, food security and taste indicators) with branded products than with low-cost ones, but the former were not always better(Reference Michels14). Nevertheless, that study is from 1995 and the conclusions would perhaps be different now, since food products change rapidly. A more recent study, conducted in Great Britain in 2003, analysed and compared the contents of energy, fat, minerals and vitamins in branded and low-cost products, and observed similar nutrient contents whereas prices could differ fourfold(Reference Cooper and Nelson12). That study dealt with relatively simple foods (canned tomatoes, orange juice, sliced bread, fresh potatoes and sausages), but the question of the relationship between price and quality arises equally and perhaps especially for more industrially processed foods such as ready meals. In this case, a lower price could be due to the use of poorer-quality, cheaper ingredients such as sugar, fat, refined starch, texturising agents or cheap cuts of meat rather than high-quality expensive ingredients (meat, fish, fruit and vegetables)(Reference Gingembre15). However the price breakdown of industrially processed food products shows that the ingredients play a relatively minor part. Agricultural products represent about 20 % of the final price of processed foods(Reference Lipchitz16). These proportions vary according to the sector considered. They appear to be particularly low for charcuterie, for which the processing and marketing costs are greater, or in sectors in which the costs of research, development and advertising are high. Because of this, the reduction of the price to the consumer is primarily achieved by reducing the marketing costs and by controlling the production networks. The low prices offered, notably by the discount stores, are mainly due to minimal logistics, low advertising and transport costs, and lower wages and margins. For packaged products, the container is sometimes worth more than the contents.
Consumers are buying more and more low-cost and discount store foods (in France, 60 % of consumers shop at discount stores at least once monthly(Reference Moati and Ranvier1)). Therefore, if there is a positive link between nutritional quality and price within a given category of foods, this could have important implications for public health. However in the absence of available data on the nutritional composition of individual foods within a given category, it is difficult to examine this question. In the present work, we have tried to compare foods with one another, based simply on the information available on the label. This is a limitation because the information given on the label may not always be reliable. However, it seems that differences between declared and observed values exist for both low-cost foods and their corresponding brand name foods(Reference Michels14). Another limitation lies in the relatively restricted number of products studied and the selection made compared with the overall food supply, which includes several thousand items. Bigger quality differences might have been found with less traditional ready meals than cassoulet and sausage with lentils, for which the producer has less room for manoeuvre by departing from the usual recipe because the ingredients are well known to consumers. Finally, the contents of vitamins and minerals were not known. We have tried to compensate for this lack of information by developing an ingredient quality score based on the list of ingredients, but this may lack objectivity. In spite of these limitations, the present results suggest that by buying a branded product, the chances are greater of obtaining a product with a better quality of ingredients, but one has to pay quite a lot more to obtain a small difference in the final score (Fig. 2). This underlines the necessity, and the relative urgency, of carrying out a large independent and rigorous study based on reliable indicators. Only such a study would be in a position to compare unambiguously the nutritional quality of foods according to brand and price over different marketing chains, and provide a guide to the least well-off consumers who care about their health.
The current lack of precise nutrition information on food labels(8) makes difficult the objective estimation of the nutritional quality of each food. In order to facilitate access to nutrition information by consumers, especially purchasers of low-cost or discount store products, it would be desirable for nutrition labelling to apply to all products. The European Commission has recently adopted a draft regulation ensuring that a product’s essential nutrition information will be provided on its packaging in a legible and comprehensible manner(17), because nutrition labelling is viewed as a potentially important element in the overall strategy for combating obesity(18). Nutritional educational programmes will not have any impact if consumers cannot find the necessary information on the products sold. Also, an effort should be made to improve the information to make it understandable by as many as possible. In fact studies show that, on the one hand, most people who claim to read labels do not really know how to interpret them, and on the other hand, that it is people of low socio-economic status who read labels the least(Reference Cowburn and Stockley13).
Several strategies are employed by the poorest households to reduce their expenditure on food. One is to reduce consumption of the food groups which are the most expensive sources of energy, such as fruit, vegetables and fish, while preferring to eat foods which are a cheap source of energy, such as refined cereals, cheap cuts of meat, and fatty and sugary products(Reference Darmon and Drewnowski19). Another strategy is to choose low-cost foods within a given product category(Reference Leibtag and Kaufman20) and/or to shop at discount stores(Reference Moati and Ranvier1). Furthermore, the discount store seems to be the only non-stigmatising, and thus socially acceptable, source of supply for people with an insecure food supply(Reference Bellin-Lestienne, Deschamps, Noukpoapé, Darmon, Hercberg and Castetbon21). In view of our results, it does not yet seem to be justified to divert consumers, especially the poorest, from low-cost or discount store foods. Such an approach may even have an adverse effect on the nutritional quality of their diet, notably by reducing further the fraction of their food budget spent on fresh fruit and vegetables. If more thorough studies demonstrate that the nutritional quality of low-cost foods is effectively inferior to that of branded foods, then it would be necessary to quickly evaluate the nutritional risks possibly associated with consumption of these products. If, on the other hand, these studies fail to show any difference in nutritional quality between low-cost and brand name products, then the strategy of buying low-cost foods should be encouraged within disadvantaged communities, insofar as it would allow them to obtain a cheaper balanced diet(Reference Cooper and Nelson12). In addition, one can hope that the nutrient profiling approaches that are currently developed to provide reliable and synthetic indicators of the nutritional quality of each food considered individually will help consumers to identify which foods offer the best nutrient value for money(Reference Maillot, Ferguson, Drewnowski and Darmon22). In an international context where food prices are so rapidly rising, tackling the issue of the nutritional quality to price ratio of individual foods is crucial to facilitate the economic access of disadvantaged communities to a balanced diet.
Acknowledgements
N.D., A.D. and F.C. conceived the study; N.D. and F.C. coordinated the study; C.J. and M.M. conducted the analysis. All authors participated in the interpretation of the findings and the writing of the paper. None of the authors had a personal or financial conflict of interest. All authors have read and approved the manuscript in its final form. This work was carried out as part of the project ‘POLNUTRITION’ 2006–2008 (ANR-05-PNRA, 012), with the support of the National Research Agency.


