


Dietary and other modifiable lifestyle habits including cigarette smoking, alcohol consumption, physical inactivity, snacking, skipping breakfast and higher body weight have been causally linked to long-term adverse health outcomes including morbidity and mortality(Reference Schoenborn1). There is little known about the extent to which dietary patterns are a more general component of lifestyle during young adulthood. Young adulthood is characterised by extensive lifestyle changes and explorations(Reference Arnett2). While the underlying contributing factors to the development and clustering of unhealthy lifestyles are the subject of a body of research, socio-cultural and environmental factors are believed to play important roles in these processes(Reference Schüz3,Reference Brug, Kremers and Lenthe4) . Unhealthy lifestyles including poor dietary habits, smoking, alcohol consumption and physical inactivity as well as screen-based/sedentary activity can be observed during young adulthood(Reference Arnett, Žukauskienė and Sugimura5–Reference Hobbs, Duncan and Collins8). These lifestyles, particularly poor dietary habits, sedentary activity and smoking, develop early in the life course and are likely to track through adolescence and into young adulthood(Reference Plaza-Díaz, Molina-Montes and Soto-Méndez9–Reference Fergusson, Lynskey and Horwood12). The multifaceted lifestyles observed during young adulthood may be interrelated and may be associated with poor food choices(Reference Scholz, Navarrete-Muñoz and Garcia de la Hera13–Reference Thomson, Spence and Raine17) and bad eating habits: skipping meals; eating away from home; and include a reliance on fast foods and energy dense snacks(Reference Allman-Farinelli, Partridge and Roy6,Reference Laska, Hearst and Lust7) . It is plausible that dietary habit is part of a broader aspect of lifestyle and that lifestyle interventions may be necessary to facilitate better food choices and better eating habits. In this study, we report findings from the Mater University of Queensland Study of Pregnancy (MUSP) birth cohort to examine the associations between the dietary patterns of respondents and four key lifestyle factors, specifically smoking, alcohol consumption, physical activity and screen-based/sedentary activity in young adult offspring at the 21-year follow-up.
A few studies have specifically focused on lifestyle behaviours and their associations with dietary patterns among young adults(Reference Mueller, Blondin and Korn18). There are some studies which examine sociodemographic and lifestyle variables influencing dietary pattern of young adults. We identified seven such studies conducted in the USA, Brazil, Denmark, UK and Canada including men and women aged between 18 and 39 years(Reference Deshmukh-Taskar, O’Neil and Nicklas19–Reference Brenner, Boucher and Kreiger25). These studies have largely focused on smoking(Reference Mueller, Blondin and Korn18–Reference Olinto, Willett and Gigante20,Reference Sprake, Russell and Cecil23) and physical activity(Reference Deshmukh-Taskar, O’Neil and Nicklas19,Reference Sprake, Russell and Cecil23,Reference Borland, Robinson and Crozier24) as lifestyle variables, with conflicting results. For example, in some studies less healthy eating patterns have been associated with lower level of physical activity(Reference Deshmukh-Taskar, O’Neil and Nicklas19,Reference Sprake, Russell and Cecil23) and smoking(Reference Deshmukh-Taskar, O’Neil and Nicklas19,Reference Olinto, Willett and Gigante20,Reference Sprake, Russell and Cecil23) in young adults. A high level of physical activity has been associated with increases in prudent dietary pattern scores over time among young women in the UK(Reference Borland, Robinson and Crozier24). By contrast, smoking has shown no association with any of the identified dietary patterns in this later study of young women in the UK(Reference Borland, Robinson and Crozier24) and in another study of men and women in the USA(Reference Mueller, Blondin and Korn18). A few studies that have considered alcohol consumption(Reference Deshmukh-Taskar, O’Neil and Nicklas19) and sedentary activity(Reference Mueller, Blondin and Korn18,Reference Borland, Robinson and Crozier24) have not observed association with the dietary patterns they examined.
There is also limited evidence regarding BMI as a possible lifestyle correlate of dietary patterns, particularly during the period of emerging adulthood when weight gain is likely high(Reference VanKim, Larson and Laska26,Reference Nelson, Story and Larson27) . While BMI appears unrelated to changes in dietary patterns over 2 years among young women in the UK(Reference Borland, Robinson and Crozier24), other studies that have adjusted for a confounding effect of BMI in predicting dietary patterns have not reported estimates for BMI(Reference Olinto, Willett and Gigante20,Reference Hare-Bruun, Togo and Andersen22,Reference Sprake, Russell and Cecil23) .
In general, previous studies have focused largely on physical activity and smoking and overlooked other lifestyle factors such as alcohol consumption, sedentary activity and body weight in relation to patterns of eating among young adults. Moreover, there is a mounting body of evidence showing sociodemographic characteristics including older age, female gender and both higher income and education are positively associated with the healthier food choices(Reference Wardle, Haase and Steptoe28,Reference Munt, Partridge and Allman-Farinelli29) as well as healthier dietary patterns(Reference Olinto, Willett and Gigante20–Reference Sprake, Russell and Cecil23) in young adults. We hypothesise that both lifestyles and dietary patterns are, in part, a consequence of the social contexts in which a person is reared. In this study, we examine whether dietary patterns are correlated with a range of lifestyles in young adults adjusting for potentially confounding effects of such social contexts including levels of income and education. Specifically, we examine physical activity, sedentary activity, cigarette smoking, alcohol consumption and BMI and their associations with dietary patterns in young Australian women and men at a mean age of 21 years using a large population-based data set.
Methods
Participants and design
The present study uses offspring data from the MUSP, a prospective birth cohort study of mother-offspring pairs in Brisbane, Australia. Between 1981 and 1983, all women (n 8556) who presented for their first antenatal visit at the Mater Hospital in Brisbane were asked to participate in the study; 98 % of those attending the booking in clinic were enrolled in the study and 6753 women who gave birth to 7223 children that were not adopted out before leaving the hospital, constitute the MUSP birth cohort. At the 14- and 21-years follow-ups, the offspring completed health, social and lifestyle questionnaires. Details of the MUSP birth cohort including recruitment of participants and measurements taken at each follow-up visit have been previously published(Reference Najman, Alati and Bor30).
This current study examines data from the 21-year follow-up (2001–2003) of the offspring. A total of 3805 (52·7 %) offspring, young adults from this point forward, responded to a core questionnaire and 3654 (1731 men; 1923 women) completed a food frequency questionnaire (FFQ)(Reference Najman, Alati and Bor30,Reference Lahmann, Williams and Najman31) . A core questionnaire addressed the following topics: sociodemographic characteristics; lifestyles; general health and well-being; and other topics such as psychosocial and mental health of respondents. Exclusions (total n 894) were based on prior work with this cohort(Reference Lahmann, Williams and Najman31). We excluded 429 young adults with incomplete FFQ information, such as a missing or blank FFQ page or whole section, or which had a lack of information on alcohol consumption. Another 465 young adults were excluded because of implausible energy intake reports that are defined as <500 or ≥3500 kcal/d for female participants and <800 or ≥ 4000 kcal/d for male participants(Reference Lahmann, Williams and Najman31). We only included participants with <40 % missing FFQ items (blanks), leaving an analytical cohort of 2760 young adults with useable dietary data, out of which 2665 (1135 men, 1530 women) had complete data for each variable included in the current analyses (see online Supplemental Fig. 1).
Assessment of lifestyles
In this study, we consider five measures of lifestyle, namely smoking status, alcohol consumption, physical activity and sedentary/screen-based activity as well as BMI based on availability of the data and previous literature evaluating possible associations of some of these variables with dietary patterns among young adults(Reference Mueller, Blondin and Korn18–Reference Brenner, Boucher and Kreiger25). Information on each lifestyle measure comprised a self-report provided by young adults.
Smoking status was measured as the number of cigarettes per day in three categories; non-smoker, 1–19 cigarettes (light smokers) or ≥ 20 cigarettes (heavy smokers). Alcohol consumption was measured based on estimates of the mean number of standard drinks consumed/d; abstainer (0), light consumer (0·1–0·5), moderate consumer (0·51–1), heavy consumer (1·01–3·4) or very heavy consumer (≥ 3·5). This latter variable was aggregated into four categories as abstainers, and light, moderate and heavy consumers, for further analysis.
Further, participants were asked about their physical activity using questions from the Active and Inactive Australians Questionnaire (AIAQ)(Reference Booth, Owen and Banman32). The AIAQ questionnaire includes questions about vigorous exercise, less vigorous exercise and walking along with average weekly sessions (‘never’, ‘1–2 times’ and ‘3 or more times’) of engagement in each type of activity during the past 6 months(Reference Booth, Owen and Banman32). Exercise was considered vigorous when it made a participant breath harder or puff and pant including such activities as swimming, tennis, netball, athletics and running and less vigorous when it was for recreation purpose including such activities as bike riding and dancing. We quantified categories of sessions and summed up these values to obtain a weekly average number of sessions that a participant was engaged in any type of physical activity(Reference Berlin, Longnecker and Greenland33). Participants were then grouped as physically inactive (0 sessions), insufficient (1–5 sessions) and sufficient (≥ 5 sessions) physical activity for health based on Active Australia Survey guideline(34).
In addition, participants were assessed for sedentary/screen-based activity, defined by time spent watching television (TV), using daily number of hours they spent watching TV (weekend days and weekdays) separately with the following response options: ‘never watched’ and watched for ‘<1 h’, ‘1–3 h’, ‘3–5 h’, ‘5–7 h’ and ‘7 h or more’. We quantified categories of each response to estimate the average daily time spent watching TV(Reference Berlin, Longnecker and Greenland33). First, we calculated the average values of time spent on weekdays and on weekend days and multiplied by five and two, respectively. We summed up these values and divided them by seven to obtain daily average time spent watching TV for each participant. Participants were then grouped into three categories as <2 h/d (bottom 25 %), 2–4 h/d (middle 50 %) or > 4 h/d (top 25 %) duration of time spent watching TV based on the relative distribution of daily average time spent for this purpose.
BMI (kg/m2) was calculated separately from measured (n 1967) and self-reported (n 2681) weight (kg) and height (m) of participants and categorised into three groups based on WHO criteria; normal weight (<25 kg/m2), overweight (25–30 kg/m2) or obese (>30 kg/m2)(35). We found a strong correlation (r = 0·98; P < 0·0001) between BMI calculated from measured and self-reported data. This finding is similar to a report from a nationally representative sample of adult Australians(Reference Waters36). Hence, we used BMI calculated from self-reported data to maintain a larger cohort (Table 1). Arguably, people may choose to consume healthy foods to maintain their normal body weight or they may modify their food choices when they become obese in order to reduce their body weight. Thus, we considered BMI as one of the modifiable lifestyle variables that could influence dietary intakes of persons(Reference Mishra, McNaughton and Ball37,Reference Sanchez-Villegas, Delgado-Rodriguez and Martinez-Gonzalez38) .
Table 1 General characteristics among 2665 young adults (18–23 years) in Australia (2001–2004)

E % is percent energy.
* Values are in % or mean ± sd.
† Not married includes never married and widowed, divorced and separated.
Assessment of covariates
A number of sociodemographic characteristics including living arrangements have been associated with dietary patterns(Reference Olinto, Willett and Gigante20–Reference Sprake, Russell and Cecil23,Reference Lahmann, Williams and Najman31,Reference Elstgeest, Mishra and Dobson39) , whereas dietary supplement use has been associated with the adoption of other healthy habits such as a healthier diet, better physical activity, avoiding smoking and alcohol consumption and healthy body weight(Reference Dickinson and MacKay40). We used self-reports of young adults to obtain information on sociodemographic measures. These measures include age (in years), gender, level of education (incomplete secondary school, secondary school, College-Tafe and University), youth income (weekly) in AU$ (no income, 1–39, 40–79, 80–119, 120–159, 160–199, 200–299, 300–399, 400–499, 500–599, 600–699, 700–799, 800–999, 1000–1499 or ≥ 1500), marital status (never married, live together, married, separated-divorced-widowed) and living arrangements (living with v. not with family). Income was regrouped into three categories: low income (bottom 25 %); middle income (middle 50 %) and high income (top 25 %) based on relative distribution of average income(Reference Berlin, Longnecker and Greenland33). Marital status and levels of education were aggregated into two and three categories, respectively. Also, information on vitamin supplement use (yes/no) was obtained by self-reports of young adults (Table 1).
Assessment of dietary intake
Usual dietary intake was assessed using the Cancer Council of Victoria’s semiquantitaive and validated 101-food items FFQ(Reference Ireland, Jolley and Giles41,Reference Hodge, Patterson and Brown42) . Relative validity of nutrient intake for this FFQ has been documented, and the FFQ was found to be useful in the assessment of habitual intake in the Australian adult population(Reference Hodge, Patterson and Brown42). Correlation coefficients for energy-adjusted nutrient intake between 7-d weighed food records and the FFQ ranged from 0·28 (vitamin A) to 0·78 (carbohydrate)(Reference Hodge, Patterson and Brown42). Study participants were asked to report on how often they usually consumed a specified food item (on a 10-point scale from ‘never’ to ‘3 or more times a day’) over the previous 12 months, including six items on the consumption of alcoholic beverages. These were converted to daily equivalents for statistical analysis. The FFQ also included 10 short questions on the consumption of fruit, vegetables, sugar, eggs, and the quantity and type of milk, cheese, bread and fat spreads. Photographs of different portion sizes of selected food items and dishes were included in the FFQ to assist in the calculation of daily energy and nutrient intake. These were estimated with the use of software developed by the Cancer Council of Victoria on the basis of Australian food composition table as contained in the Nutrient Data Table for Use in Australia (NUTTAB95), the national government food composition database of Australian foods(Reference Lewis, Milligan and Hunt43).
Derivation of dietary patterns
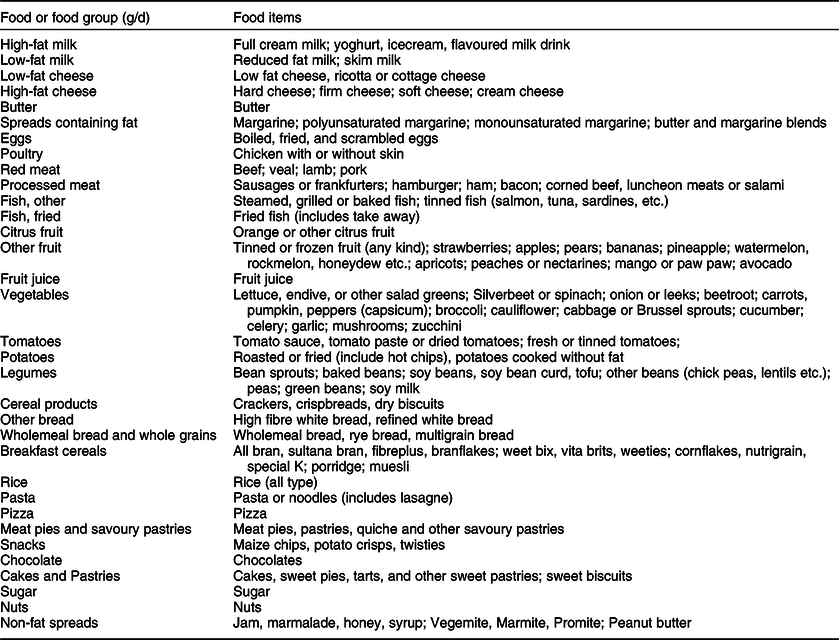
To derive dietary patterns, first the 95 food items (excluding six items on alcohol intake) were grouped into 33 food groups on the basis of the similarity of food type, nutrient composition or culinary usage to reduce within person variation in dietary intake. Individual food items that constituted a distinct item (e.g. eggs, butter, pizza) or those thought to represent a particular eating pattern (e.g. potato, fruit juice, sugar) on their own were preserved (Table 2). We computed the average intake (in grams) of each participant’s food group by summing the intake of the individual foods that made up each food group.
Table 2 Food groupings used in dietary pattern analysis among 2665 young adults (18–23 years) in Australia (2001–2004)
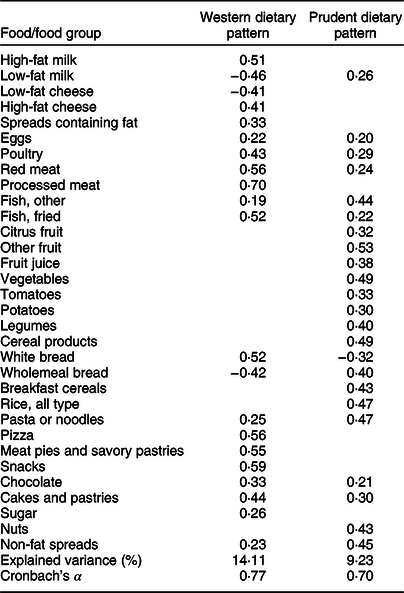
Dietary patterns were derived applying factor analysis with principal component extraction (PROC FACTOR in SAS) based on the consumption of 33 predefined food groups. The factor scores obtained were rotated by orthogonal transformation to achieve uncorrelated and more interpretable structures(Reference O’Rourke and Hatcher44). We considered solutions containing 2–4 factors. After examining factor solutions with eigenvalues > 1·25, we chose a two-factor solution based on the break point of scree plot and interpretability of the factors(Reference O’Rourke and Hatcher44). We identified two main dietary patterns and named them based on food groups with high loadings(Reference Hu45). Food groups with absolute value of factor loadings ≥ 0·3 were considered as meaningfully contributing to each dietary pattern(Reference Kline46). Inter-item reliability for foods groups with high loadings in each dietary pattern was assessed by Cronbach’s α coefficients. Factor scores for each dietary pattern were calculated by summing the products of intakes of food groups weighted by loading coefficients(Reference Kline46) as have been presented in Table 3.
Initially, we conducted dietary pattern analysis for men and women separately. The gender-specific dietary patterns identified were similar in relation to the number of factors identified and the foods that loaded highly. Therefore, the combined cohort of men and women was used for the present analysis. Because alcohol intake was included in the analyses as a lifestyle correlate of dietary patterns, we excluded items measuring alcohol intake as these contribute to derive dietary patterns.
Statistical analyses
Normality of the continuous variables including standardised scores for each dietary pattern and computed food groups values (g/d) used to drive dietary patterns and age (in years) was checked visually using Q–Q plots of residuals against the predicted values, histograms and observing the skewness and kurtosis measures of their respective standard errors. Each of the dietary pattern scores and age were approximately normally distributed. However, computed food groups had positively skewed distributions; hence, their values were log-transformed before deriving dietary patterns. The standardised values of the two derived dietary pattern scores were considered as separate outcomes, and multivariable linear regression analysis was used for the main analyses. Differences in continuous and categorical variables between males and females were compared using the independent sample t-test and chi-square, respectively.
We first performed bivariate analyses to identify candidate variables for multivariable models using significance level of <0·20. All explanatory variables had P-values <0·20 for the Western dietary pattern and hence, all of them were entered into a series of multivariable model. Despite having P-values > 0·20 in bivariate analyses for a prudent dietary pattern, living arrangements and gender of participants were maintained in multivariable model based on previous findings(Reference Wardle, Haase and Steptoe28,Reference Lahmann, Williams and Najman31,Reference Elstgeest, Mishra and Dobson39) . Before fitting multivariable models for each dietary pattern, we examined multicollinearity among the explanatory lifestyle variables with the use of the variance inflation factor and Pearson correlation coefficients. Further, we examined evidence of interaction terms between gender and each lifestyle correlate examined. There was no evidence of collinearity or interaction observed in the current analysis. Thus, all analyses were based on the entire cohort of men and women.
To identify lifestyle variables significantly correlated with dietary patterns of young adults, a series of multivariable linear regression models were fitted separately for each dietary pattern adjusting for covariates including sociodemographic variables and energy intakes. The first two models were presented in Supplemental Table 1. In the first model, we run a model containing explanatory lifestyle variables including levels of smoking, alcohol consumption, physical activity, watching TV and BMI category. In the second model, we adjusted for covariates including age in years, gender, income, education, marital status, living arrangements and vitamin supplement use. In the fully adjusted model, we additionally adjusted for total energy intake of respondents (Table 4). All tests were two-sided and P-value <0·05 was considered statistically significant. The results are mean differences in dietary patterns scores across levels of examined lifestyle correlates and reported as standardised and unstandardised beta coefficients (βs) with their 95 % CIs presented in Table 4 and Supplemental Table 2, respectively. Also, standardised βs are presented in Supplemental Table 2. All analyses were performed using SAS for window (version 9.4; SAS Institute).
Table 3 Factor loadings of the principal dietary patterns identified among 2665 young adults (18–23 years) in Australia (2001–2004)*

* Absolute values <0·20 for each factor loadings were not shown for simplicity.
As a sensitivity analysis, we fitted separate models to test if total effect of a lifestyle variable of interest out of four of these variables, namely physical activity, watching TV, smoking and alcohol consumption included in this study changes after successively leaving three or fewer others out of a fully adjusted model (Table 4) to have estimates for each from models with different covariate subsets. These sensitivity analyses did not substantially alter the estimates. Thus, we interpret total effects from a fully adjusted model above containing all lifestyle variables adjusted for covariates(Reference Westreich and Greenland47).
Results
Characteristics of the study participants
Data from a total of 2665 young adults was used for this analysis. Sociodemographic and lifestyle characteristics are presented in Table 1. Mean ± sd age of participants was 20 ± 0·8 years (range 18–23 years). A majority of the participants were females (n 1530; 57·3 %) and not married (72·9 %). A higher proportion of participants completed secondary school (55·1 %) and were in the middle-income (41·7 %) group. Two-thirds of participants were non-smokers, while the majority of smokers smoked fewer than 20 cigarettes a day. A majority of the participants were light (39·9 %) and heavy (35·3 %) consumers of alcohol. A majority of the participants had insufficient (1–5 sessions a week) physical activity and viewed TV for 2–4 h/d, respectively. Nearly two-thirds of participants were living with their parents and reported using no vitamin supplements, while nearly one-third were overweight or obese (BMI ≥ 25 kg/m2).
Differences in sociodemographic and lifestyle characteristics are also presented by sex. Compared to males, female participants are more likely to be poor, not married, not living with parents, obese, non-users of vitamin supplements and less likely to be overweight and heavy smokers and alcohol consumers. Regarding macronutrient intakes, males had a higher total energy intake and higher percent energy from fat, while females had a higher percent energy from carbohydrate; there was no significant difference in energy intake from protein between males and females (Table 1).
Characterising dietary patterns
Using a total cohort of men and women, we identified two major dietary patterns, the Western and prudent patterns that collectively explained 21·6 % (13·0 % and 8·6 %, respectively) of variation in dietary intakes in young adults. The Western pattern was characterised by high consumption of red meats, processed meat, poultry, fried fish, pizza, meat pies and savoury pastries, high-fat dairy products, fat containing spreads, white bread, pasta, snacks, chocolate and cakes and pastries and low consumption of low-fat dairy products and wholemeal bread. The prudent pattern was characterised by high consumption of vegetables, fruit, fish, potatoes, legumes, cereals, wholemeal bread, rice, pasta, nuts and non-fat containing spreads and low consumption of white bread. Inter-item reliability in each dietary pattern was assessed by Cronbach’s α coefficients and these were 0·74 for each pattern. Factor loadings for each dietary pattern are presented in Table 3. The standardised factor scores for the Western dietary pattern ranged from −3·46 to 2·56 and was from −3·21 to 3·11 for a prudent pattern. The lower and higher dietary pattern scores suggest lesser and greater adherence to a particular dietary pattern.
Table 4 Standardised regression coefficients (95 % CI) in fully adjusted models according lifestyle factors among 2665 young adults (18–23 years) in Australia (2001–2004)*

* Models for each dietary pattern were run with the following lifestyle variables included: smoking, alcohol consumption, physical activity, time spent watching TV and BMI category.
All results are adjusted for age in years, gender, income, education, marital status, living arrangement, vitamin supplement use and total energy intake.
Lifestyle correlates of dietary patterns
Table 4 presents lifestyle correlates of each dietary pattern fully adjusted for age, gender, income, education, marital status, living arrangements, vitamin supplement and total energy intakes. The strongest lifestyle correlates of both a prudent and the Western dietary patterns are measures of physical activity, time spent watching TV and smoking in each fully adjusted model. Participants with a greater adherence to a prudent dietary pattern are less likely to engage in lower levels of physical activity, are less likely to watch TV for extended periods of time and are less likely to be light and heavy smokers. There was also a weaker but significant positive association of a prudent dietary pattern with BMI of young adults; those with a greater adherence to this pattern are more likely to be overweight and obese. Alcohol consumption was not associated with a prudent dietary pattern.
For each lifestyle variable correlated with a prudent dietary pattern, a similar strength but opposite direction of association with the Western dietary pattern is observed. Young adults who adhere more to the Western dietary pattern are more likely to engage in lower levels of physical activity, are more likely to watch TV for extended periods of time and are more likely to be light and heavy smokers. Alcohol consumption and BMI were weakly associated with the Western dietary pattern. Those with a greater adherence to the Western pattern are more likely to be heavy consumers of alcohol and are less likely to be overweight and obese (Table 4).
We also evaluated the associations between dietary pattern scores and energy and energy adjusted nutrient intakes of participants. The two dietary patterns differ with the Western pattern being positively and a prudent pattern being negatively associated with percent energy from fat and intakes of total fat, saturated fat, monounsaturated fat, total cholesterol and sodium. By contrast, the Western pattern is negatively and a prudent pattern is positively associated with percent energy from carbohydrate and protein and intakes of protein, carbohydrate, dietary fibre, sugar, starch, total beta-carotene and selected vitamins and minerals (see online Supplemental Table 3).
Discussion
We have identified two main dietary patterns, the Western and prudent patterns in this large study of young adults aged 18–23 years. The Western pattern is correlated with higher consumption of processed and red meat, poultry, high-fat dairy products, refined grains, takeaway foods, fried fish, fat and non-fat spreads and snacks and sweets, whereas a prudent pattern is correlated with higher consumption of fruit, vegetables, potatoes, legumes, nuts, whole grains, fish, cereals and non-fat spreads. The two dietary patterns explained 21·6 % of the variance in dietary intake in this study. This is consistent with findings from studies involving young adults from Brazil and the UK(Reference Arruda, da Silva and Kac21,Reference Sprake, Russell and Cecil23) . Studies of young adults in the USA and in Canada have reported higher (31 %) and lower (15·6 %) total variance in food intakes explained in the dietary patterns that they have identified(Reference Deshmukh-Taskar, O’Neil and Nicklas19,Reference Brenner, Boucher and Kreiger25) .
We labeled the dietary patterns identified in this study based on previous literature(Reference Hu45). However, these dietary patterns are slightly different from those reported in other studies because food group ‘cakes and pastries’ is correlated with both patterns in this study. Multiple loadings of food items have been observed in previous studies(Reference Hare-Bruun, Togo and Andersen22).
Different studies report varying numbers and types of dietary patterns in nutritional epidemiology. Consistent with our results, three studies of young adults have identified similar types of dietary patterns to those reported in the current study(Reference Deshmukh-Taskar, O’Neil and Nicklas19,Reference Hare-Bruun, Togo and Andersen22,Reference Borland, Robinson and Crozier24) . One study among US young adults has identified Western and prudent dietary patterns(Reference Deshmukh-Taskar, O’Neil and Nicklas19). A study from Denmark has identified traditional Western and green dietary patterns in young adults(Reference Hare-Bruun, Togo and Andersen22), with comparable food composition to the Western pattern and prudent pattern in this study. Finally, a study of young women in the UK has identified the prudent and high-energy dietary patterns, the latter pattern having similar characteristics to the Western pattern observed in this study(Reference Borland, Robinson and Crozier24). Moreover, studies involving adult women from the “Mamma & Bambino” cohort in Italy have identified the Western and prudent dietary patterns with similar food composition to those observed in this study(Reference Maugeri, Barchitta and Favara48,Reference Barchitta, Maugeri and Magnano San Lio49) . However, studies in young adult populations in Brazil and UK have identified up to five dietary patterns with varying food compositions(Reference Olinto, Willett and Gigante20,Reference Arruda, da Silva and Kac21,Reference Sprake, Russell and Cecil23) . A study involving young (25–30 years) and middle-aged (50–55 years) women in Australia has identified up to six dietary patterns composed in various ways(Reference Mishra, McNaughton and Ball37). The variations in types of dietary patterns identified using data-driven methods (e.g. principal components analysis) may reflect variations of foods included in the specific studies, the distribution of these foods in the data set and inconsistencies among the studies in defining and interpreting dietary patterns(Reference Schulze, Martínez-González and Fung50,Reference Slattery, Boucher and Caan51) . The variations in dietary patterns among studies using data-driven methods to define dietary patterns could arise from differences in methods used to assess dietary intake as well as differences in food grouping and the number of food items and food groups used in the statistical analysis(Reference Newby, Muller and Tucker52). To address these inconsistencies, researchers have suggested looking at the results of individual studies to ascertain which foods have substantially contributed to the dietary patterns of interest(Reference Schulze, Martínez-González and Fung50,Reference Slattery, Boucher and Caan51) .
The current study suggests that dietary patterns are associated with the broader lifestyles of young adults. Lower levels of physical activity, extended duration of watching TV and smoking were the strongest correlates of each dietary pattern. In this study, participants with lower levels of physical activity had less adherence to a prudent dietary pattern, while they had greater adherence to the Western pattern. Other studies have also reported that more active participants had higher scores for healthier dietary patterns and lower scores for less healthy dietary patterns in young men and women in Brazil and the USA, as well as in a study of young and middle-aged women in Australia(Reference Deshmukh-Taskar, O’Neil and Nicklas19,Reference Olinto, Willett and Gigante20,Reference Mishra, McNaughton and Ball37) . However, the study in the USA found no association between physical activity and a prudent dietary pattern with this latter null finding in the USA study possibly explained by a relatively larger sample size in this study(Reference Deshmukh-Taskar, O’Neil and Nicklas19). We have found that participants with longer duration of watching TV had lower adherence to a prudent dietary pattern and a higher adherence to the Western pattern. A few studies involving young women in the UK and university students in the USA have reported no association between duration of watching TV and any of the identified dietary patterns(Reference Mueller, Blondin and Korn18,Reference Borland, Robinson and Crozier24) . This could be explained by the fact that both studies had relatively small samples and may have been underpowered to detect a difference. However, a study in Brazilian adolescents found a positive association between eating while watching TV and an unhealthy dietary pattern, partly supporting the findings observed in the current study(Reference Maia, Silva and Santos53). Results of this study suggest young adults with lower levels of physical activity and longer duration of watching TV are less likely to consume healthy foods rich in micronutrients and fiber, and they are more likely to consume unhealthy foods rich in fat and dietary cholesterol as has been reported in other studies(Reference Laska, Hearst and Lust7,Reference Gillman, Pinto and Tennstedt16,Reference Thomson, Spence and Raine17) .
In this study, smokers were less likely to adhere to a prudent dietary pattern and more likely to adhere to the Western pattern. Our findings are consistent with previous studies of young adults in Brazil and in the USA, as well as with a study of young and middle-aged women in Australia(Reference Deshmukh-Taskar, O’Neil and Nicklas19,Reference Olinto, Willett and Gigante20,Reference Mishra, McNaughton and Ball37) . Evidence from previous studies of young adults shows that smoking has been associated with reduced intakes of fruits, essential fatty acids, fiber and micronutrients and higher intakes of energy, total fat, saturated fat and dietary cholesterol(Reference Steptoe, Wardle and Cui14,Reference Dallongeville, Marécaux and Fruchart15) .
In this study, heavy consumption of alcohol was positively associated with the Western dietary pattern, whereas it showed no association with a prudent pattern. Our findings in part are consistent with findings of a study involving a pooled cohort of young and middle-aged women in Australia(Reference Mishra, McNaughton and Ball37). Higher consumption of alcohol has been associated with lower consumption of healthy foods and higher consumption of unhealthy foods among Spanish university students(Reference Scholz, Navarrete-Muñoz and Garcia de la Hera13). A study in the US young adults found no association between alcohol consumption, and the Western and prudent dietary patterns(Reference Deshmukh-Taskar, O’Neil and Nicklas19), partly supporting our findings. The observed different results between the US study and the current study might reflect the relatively lower study power in the US study.
Unexpectedly, we observed that obese and overweight participants had respective higher and lower scores for the prudent and the Western dietary patterns. Studies of young women and university students in the UK observed no association between BMI and any of the identified dietary patterns(Reference Sprake, Russell and Cecil23,Reference Borland, Robinson and Crozier24) . These studies in the UK had small samples, possibly explaining the observed differences(Reference Sprake, Russell and Cecil23,Reference Borland, Robinson and Crozier24) . Our findings are consistent with a study involving young and middle-aged women in Australia(Reference Mishra, McNaughton and Ball37). The results of this study could suggest that people may select healthy foods when they become obese or overweight(Reference Sanchez-Villegas, Delgado-Rodriguez and Martinez-Gonzalez38). Also, underreporting and omitting snacks are common problems in accurately assessing dietary intakes of general population, and more so in obese and overweight people, partly explaining the current findings(Reference Heitmann, Lissner and Osler54,Reference Heitmann and Lissner55) .
Notably, a number of lifestyle variables in the fully adjusted model are correlated and it is arguable which of these effects precedes the other in this cross-sectional study. For example, physical activity could arguably reduce time spent watching TV or watching TV could, arguably, reduce the time available for physical activity. It could be suggested that some lifestyle variables in the fully adjusted model could be treated as moderators in assessing their associations with dietary patterns. These considerations while most relevant in longitudinal study designs are not central to our argument. Our aim has been to establish whether dietary patterns are associated with and hence, part of the more general aspect of the lifestyles of respondents. Furthermore, in sensitivity analyses, removing lifestyle variables which are arguably moderators from fully adjusted models (e.g. physical activity in the association between time spent watching TV and dietary patterns or vice versa) has no observable impact on the broader associations we have observed.
Strengths and limitations of the study
Our study has several strengths. We used data from a community-based MUSP birth cohort and we had a relatively large sample size included in the analyses. Also, we used dietary data from a validated FFQ that has been designed for use in adult population in Australia(Reference Hodge, Patterson and Brown42). Observing the clustering of dietary and other habits of lifestyle in young adults is another strength of our study, given young adulthood is arguably a period in the life course during which a range of lifestyle may develop including habits of dietary intake, physical activity, sedentary activity, cigarrete smoking and alcohol consumption. Furthermore, this study, to our knowledge, is the first to use data-driven method to assess dietary patterns of both young men and women in Australia.
Some limitations of this study are acknowledged. First, our study used a cross-sectional data from the MUSP cohort during the 21-year follow-up (2001–2004) and hence, causality in the observed associations cannot be ascertained. The narrow age range (18–23 years) of respondents in our sample is acknowledged. We have noted that some data was excluded due to some missing food items in the FFQ and implausible energy intake which might have affected some estimates in our study.
We have used data that have been collected during 2001–2004 and our findings might not reflect dietary pattern of the current generation. There have been declines in the availability and intake of added or refined sugars in adult men (such change in women was NS) and sugar-sweetened beverages in men and women adults over the period of 1980/1995–2011 in Australia(Reference Brand-Miller and Barclay56,Reference Ridoutt, Baird and Bastiaans57) . Also, there has been improved consumption of healthy foods such as fruit, vegetables, nuts and whole grain cereals during 1995–2011 in Australian adults(Reference Ridoutt, Baird and Bastiaans57). However, more recent data indicate the majority of adult Australians, particularly in the younger age group, are failing to meet national dietary guidelines. Only 24 % of women and 15 % of men have dietary intakes of both the fruit and vegetable consistent with national guidelines(Reference Hendrie and Noakes58).
There has been substantial loss to follow-up in the MUSP cohort, a long-term follow-up study of mothers and their offspring for more than 30 years. Those disproportionately lost to follow-up are more likely to involve respondents who are young and socially disadvantaged, of separated or divorced marital status and have higher rates of unhealthy lifestyles(Reference Najman, Alati and Bor30,Reference Lahmann, Williams and Najman31) . Loss to follow-up affects sample means, but they rarely affect estimates of association(Reference Howe, Tilling and Galobardes59,Reference Saiepour, Najman and Ware60) . Similar estimates of association in the groups retained in the study and those lost to follow-up are reported in a study that has evaluated the impact of biased loss to follow-up using the MUSP birth cohort data(Reference Saiepour, Najman and Ware60). The MUSP birth cohort is not representative of the entire Australian population, but the cohort comprises a broad cross-section of the population(Reference Lahmann, Williams and Najman31).
Conclusion
Our study has identified two main dietary patterns among young adults, namely the Western and prudent patterns. The lifestyles of young adults including physical activity, watching TV, smoking and alcohol consumption are associated with these dietary patterns. These findings suggest that there is clustering of lifestyle features associated with the main patterns of food consumption observed in a developed economy like Australia. This clustering involves a number of lifestyle features such as physical activity, sedentary activity, cigarette smoking and alcohol consumption. This clustering of factors raises three important issues. Firstly, from a research perspective any association between patterns of food consumption and health outcomes needs to take account of this clustering. Secondly, from a clinical or therapeutic perspective, efforts to modify diet in young adults need to include a focus on the multiple lifestyles of those whose patterns of food consumption predisposes them to a range of adverse health outcomes. Thirdly, from policy perspective, because a range of lifestyles are partly formed during young adulthood, nutrition and health policies should target emerging adults to promote healthy lifestyle and subsequently reduce the risk of unhealthy lifestyle related adverse health outcomes at later ages. Finally, evaluating the contributing factors to the development of unhealthy lifestyles and their clustering over time needs to be determined using prospective cohort studies.
Acknowledgements
Acknowledgements: The authors would like to acknowledge Greg Shuttlewood, a MUSP data manager, for his assistance with providing important variables in the MUSP data to create analytical cohort for the current study. Financial support: Funding for the MUSP study was received from National and Medical Research Council (NHMRC) (grant number NHMRC Grant number 210298). None of the authors have received commercial or private funding for any component to this particular study. The funder, NHMRC, had no role in the design, analysis or writing of this article.
Conflict of interest:
The authors declare that they have no competing interests.
Authorship:
T.W.U. is supported by the UQ Research Training Scholarship. T.W.U.: conceptualised the study and performed the statistical analysis, drafted the paper mainly under J.M.N. supervision, and had primary responsibility for the final content; all authors critically reviewed drafts of the paper and provided advice for the final version; P.H.L.: specifically provided important intellectual content on measures of dietary patterns and the whole manuscript.
Ethics of human subject participation:
MUSP birth cohort was conducted according to the guidelines laid down in the Declaration of Helsinki. In this cohort, written informed consent from the mothers was obtained during all data collection phases of the study, and at 21 years, informed consent was obtained from the offspring. Ethics committees at the Mater Hospital and the University of Queensland approved each phase of the study.
Supplementary material
For supplementary material accompanying this paper visit https://doi.org/10.1017/S1368980021003864


 Open access