Excess Na or salt consumption is linked to 17–30 % of hypertension globally and hypertension is one of the top ten risk factors of mortality and CVD( Reference Brown, Tzoulaki and Candeias 1 , Reference Subasinghe, Arabshahi and Busingye 2 ). In India, hypertension contributes to 10 % of all deaths and is directly responsible for 57 and 24 % of stroke and CHD deaths, respectively( Reference Gupta 3 ). Conservative estimates suggest that one in four adults in urban India and one in five adults in rural India have hypertension( Reference Anchala, Kannuri and Pant 4 ).
Excess dietary Na or salt intake is an important modifiable risk factor for hypertension( Reference Brown, Tzoulaki and Candeias 1 ). Compared with those consuming ≥2 g Na/d, adults consuming <2 g Na/d had a 3·5 mmHg lower mean systolic blood pressure (SBP) and 1·8 mmHg lower mean diastolic blood pressure (DBP)( Reference Aburto, Ziolkovska and Hooper 5 ). However, salt intake around the world ranges from 6·0 to 11·8 g/d, which is far in excess of the recommended levels( Reference Brown, Tzoulaki and Candeias 1 , Reference Kotchen 6 ). The WHO recommends a daily Na intake of <2 g, or 5 g salt/d, for adults( 7 ). The current salt intake among Indian adults is far higher than the recommended level( Reference Johnson, Mohan and Rogers 8 – Reference Ravi, Bermudez and Harivanzan 10 ), ranging between 9 and 12 g/d, or 3·6 and 4·8 g Na/d( Reference Johnson, Mohan and Rogers 8 , Reference Dhemla and Varma 11 , Reference Johnson, Praveen and Pope 12 ).
Key elements of successful dietary salt reduction strategies include public education, people-friendly food labelling, reformulation of processed foods and taxation( Reference Trieu, Neal and Hawkes 13 , Reference He, Li and Macgregor 14 ). For example, Finland has witnessed a one-third decrease in the average salt intake in the past three decades after implementing strategies such as warning labels on high-salt foods, public education, food procurement policies with Na standards and voluntary guidelines for limiting Na in foods. These efforts along with other risk reduction measures have led to a more than 10 mmHg fall in mean population SBP and DBP, as well as a 75–80 % decrease in both stroke and CHD mortality( Reference Trieu, Neal and Hawkes 13 – Reference Cobb, Appel and Anderson 15 ). Further, salt reduction interventions are low cost. For instance, estimates indicate that the cost of implementing a salt reduction programme in South-East Asian countries like India, focused on a 15 % reduction in salt intake by voluntary reduction in processed foods and condiments by the food industry and through consumer education to encourage dietary change using mass media, is between $US 0·04 and 0·06 per person per year( Reference Mohan and Prabhakaran 16 , 17 ).
WHO’s SHAKE technical package for salt reduction suggests that current understanding on the salt consumption patterns among the population, their knowledge, attitudes and practices related to salt use, and the sources of salt in their diet are important components for the development of effective consumer education and awareness programmes( 18 ). In South Asian countries such as India, the majority of the dietary salt consumed is added during cooking at home or at the table( Reference Subasinghe, Arabshahi and Busingye 2 , Reference Tripathy, Thakur and Jeet 9 , Reference Dhemla and Varma 11 , Reference Sarmugam and Worsley 19 ). However, limited information is available about population knowledge, attitudes and practices related to the use of salt. In the present paper, we describe knowledge, attitudes and practices regarding salt consumption using data from a representative sample of adults living in rural and urban North India.
Methods
Participant recruitment
We did a population survey during March to October 2012 by recruiting a sub-sample of participants from the Centre for Cardiometabolic Risk Reduction in South Asia (CARRS) cohort study in urban Delhi and the Indian Council of Medical Research (ICMR)-funded CVD repeat survey in rural Haryana. The methods, participant recruitment and data collection of the CARRS cohort study and ICMR-funded CVD repeat survey are published in detail elsewhere( Reference Nair, Ali and Ajay 20 , Reference Prabhakaran, Roy and Praveen 21 ). In Delhi, CARRS used a multistage cluster random sampling to recruit participants. Twenty wards or large municipal divisions were selected randomly; five census enumeration blocks (CEB; smaller municipal divisions) per ward, twenty households per CEB and two adults aged ≥20 years per household were selected randomly. For the current salt sub-study, we randomly chose ten wards and two to three CEB per ward (total twenty-five CEB) from the CARRS sample. All the CARRS participants from these CEB were invited to participate. Of the total of 984 invited, 940 consented, 934 were interviewed and 689 provided 24h urine samples. In rural Ballabhgarh (Faridabad, Haryana), for the CVD repeat survey, 1250 households were selected from twenty-four villages by simple random sampling and from these households, all adults aged ≥30 years were recruited. For the current salt sub-study, we randomly chose ten villages (from the twenty-four villages) and invited all participants recruited for the CVD repeat survey for the salt sub-study. In addition, individuals (100 participants) aged 20–29 years were recruited from the same households to match with the age group of the urban CARRS study. Of the total 980 participants, 758 consented to participate. Of the 758, 701 were interviewed and 756 provided 24h urine samples. In the present study we used the data of those with complete interview information, comprising 934 and 701 participants, respectively, in the urban and rural areas. The study was approved by the institutional ethics committee and written informed consent was obtained from all participants.
Sample size
Sample size calculation was based on the primary objective of the study, which was to measure population level of dietary salt intake using 24h urine samples. Assuming a mean urinary Na excretion of 3·9 g/d and an sd of 1·15 g/d( Reference Jan, Shah and Saleem 22 ), to detect a 0·2 g/d or more difference in 24h urinary Na excretion between the four strata (rural men; rural women; urban men; urban women) with 90 % power and α of 0·05, a sample of 263 was needed in each stratum. Taking into consideration a non-response rate (refusal to provide 24h urine sample) of 30 %, the sample size in each of the stratum was 342, which we rounded off to 350. We invited all the participants selected for the survey. Assuming that 50 % of the participants had correct knowledge, attitudes and practices related to salt consumption, the available samples of 934 and 701 in urban and rural areas would have a power of 86 and 76 %, respectively, at an α of 0·05 and an acceptable difference in proportions of 5 %.
Data collection
A standardised questionnaire was administered to each participant for obtaining information on demographic characteristics, medical history, tobacco and alcohol use, use of medication and physical activity. The questions about knowledge, attitudes and practices were adapted from the WHO/Pan American Health Organization protocol for population-level Na determination( 23 ). The questionnaire consisted of questions on: (i) knowledge of the health effects of high salt consumption, i.e. whether participants knew that high salt consumption could cause health problem/s, the specific health problem/s and the maximum limit of daily salt consumption (whether they knew there is a limit for daily salt consumption and if so, what the limit is); (ii) attitudes, i.e. perceived level of daily salt consumption and attitude towards reducing the daily salt consumption; and (iii) practices, i.e. timing of addition of salt during cooking (at the beginning of cooking; halfway through cooking; towards the end of cooking; after cooking), addition of salt in rice/dough, addition of salt to food/salad at the table or while eating, regular actions taken to reduce daily salt consumption and what actions they actually do to reduce their daily salt consumption (avoid/minimise consumption of snacks/namkeens/pickles/papads/processed foods; look at the salt labels on food; do not add salt at the table; buy low-salt alternatives; do not add salt when cooking; use spices other than salt when cooking; avoid eating out). We defined participants’ perception to reduce daily salt consumption as positive if they responded that it was ‘somewhat’ or ‘very important’ to reduce dietary salt when asked, ‘How important to you is lowering the salt in your diet?’ We also stratified participants as taking action to reduce salt if they responded ‘yes’ to the question, ‘Do you do anything on a regular basis to control dietary salt intake?’
Weight and height were measured using a portable bioimpedance-measuring device (TANITA-BC601) and a portable stadiometer (SECA-214) to the nearest 0·1 kg and 0·1 cm, respectively. BMI was calculated as weight divided by the square of height: [weight (kg)]/[height (m2)]. BMI <25·0 kg/m2 was categorised as normal weight and BMI ≥25·0 kg/m2 as overweight or obesity( Reference Chittaranjan and Yajnik 24 ).
Blood pressure was measured twice after 5 min of resting in a seated position, using a validated automated digital oscillometric sphygmomanometer (OMRON-HEM7080). The readings were repeated at 1 min interval. A third reading was taken if the difference between the first and second readings was ≥10 mmHg or ≥6 mmHg for SBP or DBP, respectively. The mean of the last two readings was taken for defining blood pressure. Blood pressure was stratified as ‘known hypertension’ if self-reported hypertension (irrespective of treatment); ‘new hypertension’ if measured SBP/DBP was ≥140/90 mmHg; ‘pre-hypertension’ if measured SBP/DBP was 120–139/80–89mmHg; and ‘normal’ if measured SBP/DBP was <120/80 mmHg( Reference James, Oparil and Carter 25 ).
A single 24h urine sample was obtained from the participants. They were asked to collect all urine passed during a 24h period starting from the second urination on the morning of the collection day and ending with the first urine passed the following morning. Participants were asked to note, on a paper record sheet, the start and finish times of their urine collection as well any missed urine collection/s. If the participant reported duration of collection of <24h, more than one void missed or more than one episode of substantial spillage of a void, the collection was deemed incomplete and the participant was offered the option to redo the 24h collection. The quantity of collected urine was measured and four aliquots of 1 ml each were prepared for analysis and storage at a central laboratory. Urinary Na and K from 24h urine samples were determined using direct measurement by ion-selective electrode on an electrolyte analyser (XI-921) and with reagents from Caretium, Shenzhen, China. Unassayed urinary control from RANDOX was used as internal quality control. We excluded samples with urinary creatinine <4·0 mmol/d for women, or <6·0 mmol/d for men, or a 24h urine collection of <500 ml for either sex. For each participant, the 24h Na excretion value (g/d) was calculated as the concentration of Na in the urine (g/l) multiplied by the urinary volume (l/d).
Statistical analysis
For urban samples from CARRS, sampling weights were generated accounting for the multistage cluster random design( Reference Nair, Ali and Ajay 20 ). Since rural households were selected by simple random sampling, we used sampling weight of 1 for all rural participants. The demographic characteristics and knowledge, attitudes and practices about dietary salt intake were summarised as proportions or means, both with 95 % CI, adjusted for the sampling weights. We further assessed the association of sociodemographic characteristics (age, gender, residence (rural/urban) and education), BMI, blood pressure status and participants’ knowledge (of hypertension, daily salt limits and the relationship between salt and hypertension) with their perception to reduce daily salt intake (yes/no) using a multivariate logistic regression model adjusted for clustering effect at the household level. We repeated a similar model with action to reduce daily consumption of salt (yes/no) as the outcome. The adjusted OR and 95 % CI of the association were estimated. All statistical analyses were performed using the statistical software package Stata version 12.0.
Results
Complete data on knowledge, attitudes and practices were available for 934/940 (99·4 %) and 701/757 (92·6 %) of participants in urban Delhi and rural Haryana, respectively. The sociodemographic characteristics of the participants by residence are presented in Table 1. The mean age of the participants was 45·9 years in the rural areas and 41·8 years in the urban areas. Women constituted 59·6 and 50·2 % in rural and urban samples, respectively. Mean years of education was 5·1 and 8·4 years in the rural and urban samples, respectively. Tobacco and alcohol use were higher among rural compared with urban participants. Fifty-three per cent of urban and 23 % of rural participants were consuming ≤5 g salt/d. The prevalence of hypertension, known and newly diagnosed, was 10·4 and 19·9 % in the rural and 12·0 and 22·3 % in the urban areas, respectively, whereas overweight and obesity (BMI≥25·0 kg/m2) prevalence was 28·1 and 49·3 % in rural and urban areas, respectively.
Table 1 Sociodemographic characteristics, by residence, of adults aged ≥20 years in rural Haryana and urban Delhi, North India

SBP, systolic blood pressure; DBP, diastolic blood pressure.
Data are presented as means for continuous variables or proportions for categorical variables, both with 95 % CI.
† Estimated from 24h urinary Na excretion.
‡ Known hypertension defined as self-reported hypertension (irrespective of treatment); new hypertension defined as measured SBP/DBP≥140/90 mmHg; pre-hypertension defined as measured SBP/DBP=120–139/80–89 mmHg; and normal defined as measured SBP/DBP<120/80 mmHg.
Participants’ knowledge, attitudes and practices towards dietary salt intake are presented in Table 2. Half of the urban participants (47·9 %) compared with a quarter of the rural participants (22·7 %) knew one or more adverse health effects of high salt consumption. However, only 17·5 and 20·8 % of rural and urban participants, respectively, knew that there should be a limit for daily salt consumption. Most participants who knew there should be a limit to daily salt consumption, also knew the correct amount of daily consumption (≤1 teaspoon of salt; 1 teaspoon ≈ 5 g of salt). Most participants (75·6 % of rural and 66·5 % of urban) thought that they were eating the right amount of salt. Nearly 46 % of both rural and urban participants reported that it was very or somewhat important to lower salt content in their diet. However, more than 70 % of both rural and participants reported always adding salt to dough, rice or food and to salad at the table. Only 3·7 % of rural and 10·2 % of urban participants were taking any action to control their dietary salt intake. Some of the measures taken to reduce to reduce salt intake were avoiding eating out, or not adding salt while cooking, or using low-salt alternatives.
Table 2 Knowledge, attitudes and practices regarding dietary salt consumption, by residence, of adults aged ≥20 years in rural Haryana and urban Delhi, North India

† Correct amount: ≤1 teaspoon of salt (1 teaspoon ≈ 5 g of salt).
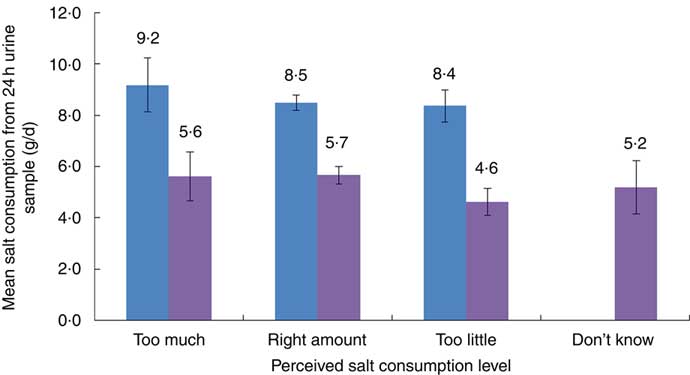
The mean salt intake, from 24h urinary Na excretion, among those who reported their own salt consumption as ‘too much’, ‘just right’ and ‘too little’ in both rural and urban areas is presented in Fig. 1. More than 80 % of both rural and urban participants perceived their level of salt consumption as ‘just right’ or ‘too little’, while nearly 10 % of participants said that they consume excess amount of salt.
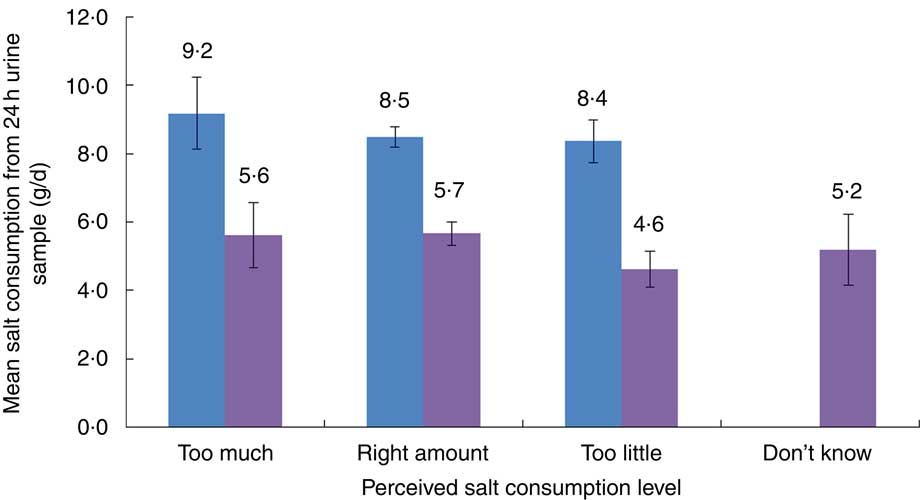
Fig. 1 (colour online) Comparison of mean salt consumption, estimated from 24h urinary sodium excretion, according to perceived salt consumption level among adults aged ≥20 years in rural Haryana (![]() ) and urban Delhi (
) and urban Delhi (![]() ), North India. Measured mean salt consumption reported as g/d, with 95 % CI represented by vertical bars, and perceived salt consumption level as percentages: 9·1 % of rural and 11·8 % of urban participants reported too high salt intake; 75·6 % of rural and 66·5 % of urban participants reported right amount of salt intake; and 15·3 % of rural and 17·4 % of urban participants reported too little salt intake
), North India. Measured mean salt consumption reported as g/d, with 95 % CI represented by vertical bars, and perceived salt consumption level as percentages: 9·1 % of rural and 11·8 % of urban participants reported too high salt intake; 75·6 % of rural and 66·5 % of urban participants reported right amount of salt intake; and 15·3 % of rural and 17·4 % of urban participants reported too little salt intake
The adjusted odds of perceived importance and self-reported actions to reduce dietary salt consumption are presented in Table 3. Compared with urban participants, more rural participants perceived it is important to reduce dietary salt consumption (OR = 1·39; 95 % CI 1·08, 1·79); however, they were less likely to take any action (OR = 0·35; 95 % CI 0·19, 0·65). There was no significant difference between age groups in the perception and actions to reduce dietary salt in their diet. Participants with known hypertension were more likely (OR = 3·91; 95 % CI 1·74, 8·77) to take some action to reduce their daily salt consumption compared with others. Those who knew that excess consumption of dietary salt increases blood pressure had higher odds of perceived importance of reducing salt compared with those with no knowledge (OR = 5·57; 95 % CI 3·29, 9·43) and they were also more likely to take actions to reduce salt consumption (OR = 8·37; 95 % CI 2·68, 26·2). Correct knowledge about the daily salt consumption limit was also significantly associated with the importance of reducing salt consumption (OR = 1·83; 95 % CI 1·32, 2·53) and action to reduce salt consumption (OR = 2·63; 95 % CI 1·52, 4·57), compared with those without knowledge.
Table 3 Factors associated with perceived importance and self-reported actions to reduce dietary salt consumption, using multivariate logistic regression models, among adults (n 1437) aged ≥20 years in rural Haryana and urban Delhi, North India

Ref., reference category.
*P < 0·05, **P < 0·01, ***P < 0·001.
† Adjusted for sociodemographic characteristics (age, gender, residence (rural/urban) and education), BMI, blood pressure status and participants’ knowledge (of hypertension, salt limits and the relationship between salt and hypertension).
Discussion and conclusion
Our study assessed the knowledge, attitudes and practices regarding use of salt in the diet of a representative sample of adults living in rural and urban areas of North India. We found low levels of knowledge regarding the adverse health effects of excess salt consumption and recommended daily intake of salt for a person, especially among rural participants. The majority of both rural and urban participants reported that their salt consumption level was ‘just right’, whereas only a small proportion actually met the recommended consumption level of ≤5 g salt/d. Overall, the knowledge, attitudes and practices towards daily salt intake were worse in rural areas than in urban areas.
The knowledge about the adverse effects of excess salt consumption on health was poorer among rural participants compared with urban participants. Those who had knowledge of the recommended daily allowance of salt and of excess salt’s effect on blood pressure were more likely to express interest to reduce dietary salt intake and reported taking one or more actions to reduce dietary salt. Similar to findings reported from other studies( Reference Subasinghe, Arabshahi and Busingye 2 , Reference Johnson, Mohan and Rogers 8 , Reference Sanchez, Pena and Varea 26 , Reference Land, Webster and Christoforou 27 ), the majority of the participants in our study also reported that the most important actions to be adopted to control dietary salt intake were avoiding eating out of home, not adding salt during cooking and using low-salt alternatives. Notably, a small proportion suggested the avoidance or reduction in consumption of pickles/papads/namkeens, reading labels on packaged food and not adding salt at the table. These observations are consistent with the results of another cross-sectional study conducted by Johnson et al. in the same region during 2015–16( Reference Johnson, Mohan and Rogers 8 ). Studies from other countries have reported similarly low levels of knowledge on adverse effects of excess salt consumption. For instance, a 2012 population-based study conducted among adults in eleven regions in Xuzhou Province of China also reported that less than third of the population had knowledge of the national recommendations for salt intake and that excessive intake causes high blood pressure( Reference Li, Qin and Lou 28 ).
The majority of the participants, specifically from rural areas, perceived that they consumed an adequate amount of salt. The tendency of individuals to perceive their diet quality as good has been reported in other studies as well( Reference Subasinghe, Arabshahi and Busingye 2 , Reference Tripathy, Thakur and Jeet 9 ). This perception might be a barrier for initiating action to lower salt consumption( Reference Johnson, Mohan and Rogers 8 , Reference Dhemla and Varma 11 , Reference Sarmugam and Worsley 19 , Reference Kamran, Azadbakht and Sharifirad 29 , Reference Parmar, Rathod and Rathod 30 ), and needs to be factored in while developing public educational programmes for salt reduction.
Lack of understanding/awareness of the main sources of salt in their diet and of strategies to reduce salt may have resulted in the estimated high salt consumption (7·3 g/d) in the study population. To reduce dietary salt consumption, it is crucial to identify the major sources of salt from the diet. In the Indian context, where most salt is added during cooking or at the table( Reference Dhemla and Varma 11 ), changes at household level in the use of salt could be one of the strategies to reduce high salt intake.
Most of the rural participants in our study followed dietary practices (e.g. adding salt to dough, rice and salads and at the table while eating) that may result in high salt consumption. A similar finding was also reported from a household survey of 5127 individuals in Punjab, India, where more rural respondents (15·6 %) reported always/often adding salt before cooking/when eating rice/chapattis/vegetables/salads compared with urban respondents (9·1 %)( Reference Tripathy, Thakur and Jeet 9 ). Both chapattis (Indian bread) and rice are staple foods and constitute the largest portion of a typical Indian diet. The use of salt in these staple foods (chapattis and rice) as well as at the table is not required as they are generally consumed with cooked vegetables or lentils, which already have some amount of salt. Tailored behavioural change communication focusing on these aspects may result in a reduction of salt consumption.
Previous studies done in India have focused mainly on the knowledge of salt intake among hypertensives( Reference Kamran, Azadbakht and Sharifirad 29 – Reference Kodali, Kodavanti and Tripuraribhatla 32 ) and few studies have reported knowledge of salt intake among the general population( Reference Johnson, Mohan and Rogers 8 , Reference Sarmugam and Worsley 19 ). Patients with hypertension may provide ‘teachable moments’ for disseminating salt reduction messages to modify their diet, and this may likely contribute to better blood pressure control. Not surprisingly, in our study, participants with known hypertension were more likely to take actions to reduce salt consumption than others. Forty per cent (−3·3, 83·3 %) of rural and 93·1 % (83·7, 102·5 %) of urban participants who reported having hypertension and were on treatment for hypertension were also taking some action to reduce daily salt consumption as compared with pre-hypertensive or normotensive individuals.
The findings of the present study have important implications for formulating appropriate strategies to reduce salt consumption in India, where CVD are the most common cause of premature mortality and hypertension is the topmost risk factor for them. Modest reduction in population dietary salt consumption could substantially reduce cardiovascular events and medical costs and therefore should be a public health priority( Reference Trieu, Neal and Hawkes 13 , Reference Frisoli, Schmieder and Grodzicki 33 – Reference Alderman 37 ). Enhancing the public’s awareness is a necessary first step in any salt reduction effort. This calls for tailored, culturally sensitive awareness campaigns with messages targeting rural populations and populations with low education levels( Reference Johnson, Mohan and Rogers 8 , Reference Dhemla and Varma 11 ).
The study had some limitations. First, the knowledge, attitudes and practices towards daily salt consumption were self-reported and therefore are susceptible to information bias. Nevertheless, in-person interviews are one of among the most common methods to collect such data and we used a standard questionnaire and trained the interviewers for standardised non-judgemental data collection. Second, the cross-sectional data collection precludes understanding of temporality of associations. Third, the sample for the sub-study was drawn from two different studies with varied sampling designs. CARRS used multistage cluster random sampling to recruit households, while the ICMR CVD repeat survey used simple random sampling. However, to account for this, we used sampling weights for urban participants in analyses and for both studies we also accounted for household-level clustering in the model. The study did have several strengths. Data were collected from a large representative population. We also assessed discretionary salt use (i.e. during cooking or at the table), which is an important element to determine the main sources of salt consumed by our participants. In addition, the salt consumption was estimated using the gold standard method of 24h urine sample collection.
Overall, the present study findings indicate low levels of awareness of the adverse effects of excess salt consumption and possible strategies to reduce salt consumption, specifically in rural areas, where hypertension is rising. Tailored public education for salt reduction is imperative, with a particular focus on rural residents. This should be supplemented with ongoing surveillance of salt consumption and population knowledge, attitudes and practices, to monitor and maintain the effectiveness of such educational efforts.
Acknowledgements
Acknowledgements: The authors thank the funding agencies for support, the participants of the CARRS and ICMR CVD studies (within which this study was nested) and the dedicated field research team. Financial support: This work was supported by a sub-grant from the Wellcome Trust Capacity Strengthening Strategic Award to the Public Health Foundation of India and a consortium of UK universities to S.M. The CARRS study was funded by the National Institutes of Health/National Heart, Lung, and Blood Institute (contract number HHSN2682009900026C). R.S. was supported by a Wellcome Trust Capacity Strengthening Strategic Award Extension Phase to the Public Health Foundation of India and a consortium of UK universities (grant number WT084754/Z/08/A). The funders had no role in the design, analysis or writing of this article. Conflict of interest: There are no conflicts of interest to report. Authorship: V.G., R.S. and S.M. conceived the research study. All authors contributed to developing the research study. D.K. and S.G. conducted the analysis for the paper. V.G. drafted the paper with support from R.S. and S.M. All authors reviewed, provided feedback and approved the final version of the paper. Ethics of human subject participation: This study was conducted according to the guidelines laid down in the Declaration of Helsinki and all procedures involving human subjects were approved by the Institutional Review Board of the Public Health Foundation of India, Gurugram, Haryana, India. Written informed consent was obtained from all participants.