


BMI is determined by individual dietary decisions and physical activity, family characteristics and eating habits, characteristics of one’s surroundings and culture, and, to a lesser degree, by genetic and metabolic factors( 1 , Reference Xiao, Zhao and Wang 2 ). These factors can be considered either endogenous – that is, they depend on a person’s decisions – or external – those that an individual cannot change.
In the last 30 years, the world has seen a significant increase in the consumption of fat, sugar and carbohydrates, as part of a nutritional transition, as well as a parallel decrease in physical activity( Reference Popkin 3 , Reference Popkin, Duffey and Gordon-Larsen 4 ). This phenomenon has resulted from a combination of environmental and social changes associated with economic development, the scarcity of recreational areas (parks, gardens and gyms), a broader access to transport, as well as changes in the processing, distribution and marketing of high-energy foods (high in sugar, fat and salt) that have increased their availability and reduced their prices( Reference Galindo Gómez, Juárez Martínez and Shamah Levy 5 , Reference Gómez-Cabello, Vicente Rodríguez and Vila-Maldonado 6 ). These changes in the environment have generated an imbalance in the consumption and expenditure of energy, which has been translated into an increase in the prevalence of obesity in the global population. In this sense, Popkin and Salois highlight the importance of studying the link between body mass and the social and dietary environment to which individuals are exposed( Reference Popkin, Duffey and Gordon-Larsen 4 , Reference Salois 7 ).
A specific factor in the environment that can influence an individual’s consumption decisions is the availability of stores, restaurants and other types of establishment that offer foods and beverages( Reference Jeffery, Baxter and McGuire 8 , Reference Rose, Bodor and Hutchinson 9 ). According to Lucan and Mitra, if people perceive that access to establishments which sell fruits and vegetables is low (e.g. they have to travel further to buy fruits and vegetables), they tend to consume foods that are high in energy( Reference Lucan and Mitra 10 ). These results are similar to those shown by Franco et al. in a study conducted in Baltimore, USA, where scarcity of fruit and vegetable stores was linked to a low-quality diet( Reference Franco, Diez-Roux and Nettleton 11 ). In another US study, Rose and Richards showed that access to supermarkets was linked to higher consumption of fruits and vegetables at home( Reference Rose and Richards 12 ). The assumption behind these studies is that the type of foods offered in commercial establishments, the way in which these products are presented (shelves) and the distance to obtain them will influence a consumer’s consumption decisions( Reference Rose, Bodor and Hutchinson 9 , Reference Farley, Rice and Bodor 13 , Reference Gibson 14 ) (see Fig. 1).
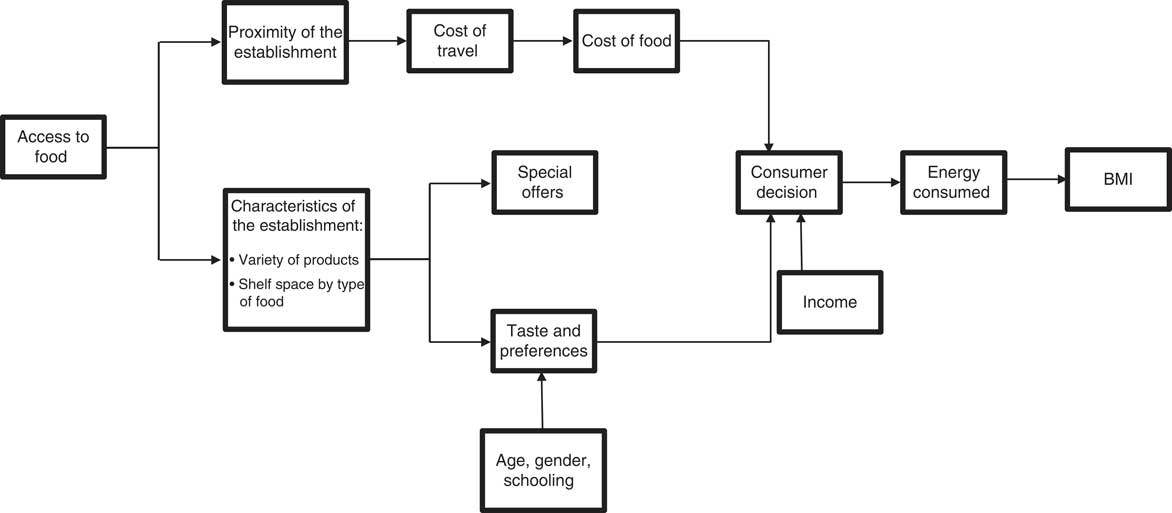
Fig. 1 Link between the availability of foods and beverages and consumption
Several studies have focused on the link between availability of food and beverage establishments and population BMI. For example, Jilcott et al. studied how the presence of agricultural markets, fast-food restaurants and convenience stores influenced teenagers’ consumption, and found that the greater the number of restaurants, the higher the weight of the individuals( Reference Jilcott, Wade and McGuirt 15 ). Through a longitudinal analysis, Gibson found that a higher density of small grocery stores was linked to an increase in a person’s weight, but showed no relationship with the density of supermarkets. The author suggested that the lack of association happens because most families must travel to go to a supermarket, which might point to the fact that having one nearby might not change the probability of buying food in a supermarket( Reference Gibson 14 ). Authors like Morland, Rundle, Hutchinson, Bodor and co-authors showed a negative association between proximity of supermarkets and BMI in the USA. They argued that this is a result of a higher availability of healthy foods inside those establishments( Reference Morland and Evenson 16 – Reference Bodor, Rice and Farley 19 ).
Mexico has the second highest obesity rate within the OECD (Organisation for Economic Co-operation and Development) countries( 20 ). In 2000, the prevalence of overweight and obesity (defined as the proportion of people with BMI≥25 kg/m2) was 62 %( Reference Olaiz, Rojas and Barquera 21 ), a figure which went up to 70 % in 2006( Reference Olaiz, Rivera-Dommarco and Shamah-Levy 22 ) and to 71 % in 2012( Reference Guitiérrez, Rivera-Dommarco and Shamah-Levy 23 ). Even so, there is only one study that has analysed the link between food availability and BMI in children who live on the Mexico–US border. The study found that a high availability of high-energy foods was related to obesity( Reference López-Barrón, Jiménez-Cruz and Bacardí-Gascón 24 ). There are no additional studies that analyse the association of availability of stores and supermarkets with BMI among adults.
An important element is that high-energy foods have become more available and attractive worldwide: their relative prices have gone down (compared with healthier and doctor-recommended products), they are highly palatable( Reference Drewnowski and Popkin 25 ) and there is high exposure to their advertising( Reference Kelly, Halford and Boyland 26 ). In Latin America, the annual per capita sales of ultra-processed products have grown by 26·7 % from 2000 to 2013; Mexico’s per capita sales of these products ranks fourth( 27 ). Therefore, in the context of an increase in the availability, palatability and persuasion of these products, a greater access to establishments that offer them may increase their demand and, eventually, affect the population’s BMI. Additionally, based on previous evidence, it might be that the availability of establishments that sell only fruits and vegetables, as well as supermarkets that sell a wide variety of foods and beverages, is not associated with BMI.
The present paper aims to study the link between the BMI of Mexicans aged ≥20 years and the density of food and beverage establishments in 2012, using information from the National Health and Nutrition Survey (Spanish acronym: ENSANUT)( Reference Guitiérrez, Rivera-Dommarco and Shamah-Levy 23 ) and the National Statistics Directory of Economic Units( 28 ). The available information allows the analysis between BMI and the density of establishments (measured as the number per square kilometre) in a particular municipality, distinguishing between three different types of businesses: (i) food and beverage stores; (ii) stores that sell fruits and vegetables only; and (iii) supermarkets.
Methods
Study design and data source
We used a cross-sectional analysis of data from the 2012 Mexican National Health and Nutrition Survey, a population-based household survey (based on a national population of 115 170 278), with sampling representative at the state level (Mexico has thirty-two states) and by rural/urban strata. The survey was designed to estimate the prevalence of health and nutrition conditions, access to services and health determinants. The ENSANUT also includes anthropometric measurements (weight and size), as well as sociodemographic variables( Reference Romero-Martínez, Shamah-Levy and Franco-Núñez 29 ).
We used data from the survey’s anthropometric, socio-economic and demographic modules, which had been applied to a sample of 38 208 (representative of 69 245 519 Mexicans) adults aged ≥20 years. From these, we excluded those who had incomplete information on the variables included in the model. A comparison of the sociodemographic and health-related characteristics of people who were included or not included in the analytical sample was performed.
The outcome variable is BMI, which is a measurement of body fat based on weight in relation to height, which makes it easier to compare the weights of individuals of different sizes( Reference Habicht 30 ). Weight and height were measured by qualified personnel during the interview. The measurement was taken under standard procedures, twice under sunlight, with the individual wearing light clothes, without shoes and standing up. Each weight had a precision of ±200 g( Reference Shamah-Levy, Villalpando-Hernández and Rivera-Dommarco 31 ). At least one member of each gender and age group (20–49, 50–65 and ≥66 years) from each home was measured.
The exposure variable was the density of establishments within a geographic area. Following McKinnon et al.( Reference McKinnon, Reedy and Morrissette 32 ), we calculated density as the number of establishments per square kilometre in the given municipality, which ranged in area from 100 to 3140 km2 with a population size from 800 to 1 000 000( 33 ). The information about the urban supply of food and beverage stores, fruit and vegetable stores and supermarkets for 2012 was obtained from the National Statistics Directory of Economic Units, which contains information on the principal activity and location of 5 million non-itinerant economic units that carry out activities related to manufacturing (11 %), commerce (47 %) and services (39 %). The information from the National Statistics Directory of Economic Units was collected by the National Institute of Geography and Statistics, based on the Economic Census( 28 ); while territorial extension (km2) was obtained from the State and Municipal Data Base System( 33 ). We distinguished three types of establishments, based on the North American industrial classification( 34 ): (i) food and beverage stores (codes 46111, 461213 and 462112); (ii) stores that only sell fruits and vegetables (code 461130); and (iii) supermarkets (code 462111). We constructed an interaction between the different densities to observe if the association was modified.
The ENSANUT does not have information on the address or geographical coordinates of households (for ethical reasons); therefore, we were not able to examine areas close to the participant’s home, only the municipality where they live.
Covariates
We adjusted the model for the following variables that may be linked to both BMI and availability of establishments. At the individual level, we included gender (either male or female), age as count of years (linear and quadratic), level of education (four categories: no education or elementary, middle school, high school, bachelor degree or more) and a variable that indicates if the adult reported to have diabetes, hypertension or both( Reference Huang, Willett and Manson 35 , Reference Logue, Walket and Leese 36 ). At the household level, a variable of home assets was created( Reference Popkin, Duffey and Gordon-Larsen 4 , Reference Jeffery and French 37 , Reference Monteiro, Conde and Lu 38 ) as a proxy for socio-economic status by an analysis of principal polychoric components to create an index of assets that included: television, own car, refrigerator, Internet, water tank, blender, microwave, cable television, stove, washer and dryer. Based on the index of assets created, the sample was divided into three to explore the non-linear connections with BMI.
The models also were fitted with the marginality index calculated by the National Population Council with information from the 2010 Population and Living Census (collected by the National Institute of Geography and Statistics) for each municipality( 39 ). The marginality index is created with variables added on a municipality-wide scale that indicate the level of access to public services (homes without potable water, electricity and/or a drainage system), level of schooling (adults and people ≥12 years old without an elementary education), and economic and employment conditions (overcrowded houses, without a refrigerator, or that subsist on less than two minimum wages). We stratified the index in five levels, from the less marginal municipals to the most( 40 ). We did not adjust by type of municipality (urban or rural) because the correlation with the marginality index is high and significant (0·758).
Analysis
A descriptive analysis was undertaken of the variables used in the model, accounting for the complex survey design to permit population-level estimates. Next, a weighted least-squares model was estimated to test the association between density of establishments and the BMI of adults. The standard errors were fitted at the municipality level with the Taylor series linearization method. The general specification model was as follows:
 $${\bf y} _{{ij}} {\equals}{\bf d\prime} _{\!\!j} \alpha {\plus}{\bf I\prime} _{\!\!i} \beta {\plus}{\bf M\prime} _{\!\!j} \gamma {\plus}{\epsilon}_{{ij}} ,$$
where
 $${\bf y}_{{ij}} $$
represents the outcome variable (BMI) of individual i living in municipality j;
$${\bf y}_{{ij}} $$
represents the outcome variable (BMI) of individual i living in municipality j; ${\bf d\prime}_{\!\!j} $
is a vector that represents variables for the density of stores by type of establishment in municipality j and their interactions;
${\bf d\prime}_{\!\!j} $
is a vector that represents variables for the density of stores by type of establishment in municipality j and their interactions; ${\bf I\prime}_{\!\!i} $
represents a vector of covariables at the individual and household level (gender, age, level of schooling, the presence of chronic disease and socio-economic status); and
${\bf I\prime}_{\!\!i} $
represents a vector of covariables at the individual and household level (gender, age, level of schooling, the presence of chronic disease and socio-economic status); and
 $${\bf M\prime}_{\!\!j} $$
is the level of marginality. α are the parameters of the variables for the density stores, β the parameters for the covariates, γ is the parameter for the marginality variables and ε is the error term. We centred and standardized the variables of density by subtracting the mean from each observation and dividing by the standard deviation, with the idea of a better interpretation of the results. The dependent variable was log transformed. We added three interaction terms to test whether higher densities of different stores in municipalities combined influenced BMI. The interactions were as follows: one between density of food and beverage stores and density of supermarkets; a second between density of stores selling fruits and vegetables and density of supermarkets; and a third between density of stores selling foods and beverages and density of stores selling fruits and vegetables.
$${\bf M\prime}_{\!\!j} $$
is the level of marginality. α are the parameters of the variables for the density stores, β the parameters for the covariates, γ is the parameter for the marginality variables and ε is the error term. We centred and standardized the variables of density by subtracting the mean from each observation and dividing by the standard deviation, with the idea of a better interpretation of the results. The dependent variable was log transformed. We added three interaction terms to test whether higher densities of different stores in municipalities combined influenced BMI. The interactions were as follows: one between density of food and beverage stores and density of supermarkets; a second between density of stores selling fruits and vegetables and density of supermarkets; and a third between density of stores selling foods and beverages and density of stores selling fruits and vegetables.
Results
For the final analytic sample, only adults with complete weight and height information and all covariables were considered. We found that the adults excluded from the final sample, on average, presented a higher level of schooling and they were mostly male. However, there were no differences in the rest of the variables. The final analytic sample comprised 37 174 adults, representing 68 251 509 Mexican adults. The mean BMI was 28·3 kg/m2, 53 % of the sample were women, adults had a mean age of 42 years, 22 % of adults had hypertension, diabetes or both, and 7·5 % had no schooling (Table 1). On average, there were 1·2 food and beverage stores, 2·4 fruit and vegetable stores, and 0·2 supermarkets per square kilometre. Of the individuals in the sample, 7 % lived in a municipality with a high or very high level of marginality, while 59 % lived in municipalities with very low marginality.
Table 1 General characteristics of 37 174 Mexican adults aged ≥20 years, 2012 National Health and Nutrition Survey
Sample is representative of 68 251 509 Mexicans. Weighted by the survey’s design.
Table 2 shows results of the weighted least-squares regression model that estimates the association between BMI and the density of establishments. The interaction terms allow us to analyse whether the association with BMI for each density changes for different values of the other two densities. The coefficients of main terms for the density variables show the association for each density separately while keeping the remaining densities at the mean (each density variable was centred at the mean). An additional 1 sd in the density of fruit and vegetable stores was associated with a reduction of 0·24 kg/m2 in BMI when the densities of the other stores were at their mean values. For food and beverage store density, a difference of 1 sd was associated with an increase of 0·50 kg/m2 in BMI, while for supermarkets the corresponding association was a reduction of 0·48 kg/m2 in BMI. Interaction terms showed that as the density of food and beverage stores increased, the negative relationship between density of fruit and vegetable stores and BMI decreased in magnitude (the slope coefficient became less negative). Slope coefficients for each density at selected levels of the other two densities are shown in Table 3.
Table 2 Link between the density of establishments and BMI in 37 174 Mexican adults aged ≥20 years, 2012 National Health and Nutrition Survey
(*) P<0·1, *P<0·05, **P<0·01. The design of the sample was taken into account.
Table 3 Slopes between each density and BMI at selected levels of the other two densities in 37 174 Mexican adults aged ≥20 years, 2012 National Health and Nutrition Survey
(*) P<0·1, *P<0·05, **P<0·01.
We also found a positive association between age and BMI, and a negative association for the age-squared term, which indicates that BMI increases with age but decreases at an older age. On average, women had higher BMI than men. Adults with higher levels of education had on average lower BMI compared with adults without any schooling, and the relationship was stronger for those with a bachelor degree or more. In contrast, adults in households with medium and high socio-economic level had higher BMI on average than adults with low socio-economic level. Low, medium and highest marginalization index showed a positive association with BMI compared with the lowest, but high index compared with the lowest did not show significant difference in the association with adults’ BMI. Adults with higher levels of education on average had lower BMI, contrary to adults in households with higher socio-economic level who had higher BMI. Having a chronic disease was positively associated with BMI.
Discussion
The results of the regression model show that higher density of stores selling foods and beverages is associated with higher BMI in Mexican adults. This association can not only be explained by a higher availability of food but also by the fact that these types of establishments offer a greater supply of unhealthy, rather than healthy, foods( Reference Gibson 14 ), which concurs with previous findings( Reference Gibson 14 – Reference Morland and Evenson 16 ). The model also shows that higher exposure to supermarkets is associated with lower BMI in Mexican adults. However, the relationship is not significant and this can be linked to the fact that, in a supermarket, high-energy foods and sweetened beverages are available alongside fruits and vegetables. We also found that density of fruit and vegetable stores was negatively associated with BMI, similar to Ahern et al.’s findings( Reference Ahern, Brown and Dukas 41 ). With the standardized coefficients, we can observe that the density of food and beverage stores has a higher association with the BMI of adults than the density of stores that sell fruits and vegetables and the density of supermarkets. Finally, with the interaction of the variables, the model shows that municipalities with higher density of both fruit and vegetable stores and food and beverage stores have on average adults with higher BMI, contrary to those municipalities where the density of food and beverage stores and supermarkets is high, in which the adults on average have lower BMI. This relationship could be explained because those with large numbers of supermarkets and food and beverage stores could be more developed municipalities, with a population with higher income and more opportunities for exercise( Reference Fernald 42 ).
Results of the association between socio-economic status (measured by household assets index) and BMI are consistent with some results of studies in developing countries( Reference Jeffery and French 37 , Reference Monteiro, Conde and Lu 38 ). The negative association observed between level of schooling and adults’ BMI could be associated with better knowledge and skills to make better decisions related to health and prevention of diseases( Reference Kawachi, Adler and Dow 43 ).
The relationship between the highest marginalization index and adults’ BMI compared with the lowest could be explained by the elevated level of social inequality and material deprivation in the former municipalities that may restrict individual choices about physical activity and quality of diet( Reference Berkman and Kawachi 44 , Reference Ramos-Peña, Valdés-Lozano and Cantú-Martínez 45 ). These are consistent with the results shown by Do et al.( Reference Do, Dubowitz and Bird 46 ) for Latin-American communities; however, in-depth research is needed to analyse the relationship between obesity and marginalization in Mexico.
Some limitations should be noted. The first one is the potential endogeneity between the availability of stores and an individual’s BMI. It is not possible to know if an individual’s decision to move from the place where he/she lives and/or works was based on preferences or lifestyle, or if the environment itself was modified over the time when the individual already lived and/or worked there. That is to say, we cannot know if the individual made the decision to live in an unhealthy environment or if the environment underwent changes through time that may have affected the consumer choices. However, only 3·2 % of families’ report mobility in the country, which is why we assume that it is unlikely that the decision to move is based on the availability of food and beverage stores( 47 ).
Second, we are not able to determine whether the adults buy food close to their home or eat at restaurants instead of eating at home; according to the National Institute of Geography and Statistics, 46 % of households report buying prepared foods, but the weekly expenditure on this kind of food represents only 13·7 % of the total expenditure on food. Also, only 18·5 % of adults work in a different municipality from where they live( 48 ). Third, we have no information to analyse whether individuals move to another municipality to buy foods and beverages but we think that is unlikely; given that municipalities are large areas, in most cases they represent an entire city. Additionally, the informal food market is not taken into consideration because there is no information available about the supply of such establishments; moreover, the source used does not consider establishments in communities with fewer than 2500 inhabitants.
Another limitation is that the study assumes that the link observed between density of food and beverage stores and BMI results from an increase in consumption that we do not show. As consumption would act as a mediator variable (because it is related to both density of stores and BMI), it is correct to exclude it from the analysis. Neither is the physical activity of adults taken into account for the same reason. Although physical activity is reported in the survey, it is self-reported and some studies have documented potential misreporting( Reference Prince, Adamo and Hamel 49 , Reference Sallis and Saelens 50 ). Additionally, physical activity was answered only by a sub-sample of individuals (11 027 adults) with significant differences in age (younger people) and sex (greater proportion of woman) compared the whole sample( Reference Prince, Adamo and Hamel 49 ).
Finally, the association between having a chronic disease and BMI could be endogenous; however, it is not the variable of interest in the model and the results without the variable do not change drastically (results not shown).
The present study suggests that there is wide scope for the elaboration of new research work that can help prove the hypotheses this investigation puts forth, thereby promoting the creation of public policies that compel the establishment of healthy environments and lifestyles, like the creation of consumption barriers for high-energy foods and the implementation of taxes, as well as orientation programmes, that would allow consumers to make well-informed decisions.
Acknowledgements
Financial support: This research received no specific grant from any funding agency in the public, commercial or not-for-profit sectors. Conflict of interest: None. Authorship: M.M., M.A.C., E.S.-M. and A.D.Q. conceived and designed the study. M.M. and M.A.C. analysed the data and wrote the first draft of the manuscript. All authors reviewed and contributed to the manuscript writing and approving the final version of the manuscript. Ethics of human subject participation: The 2012 National Health and Nutrition Survey is available at http://ensanut.insp.mx.


