


Since 1946, the US National School Lunch Program (NSLP) has provided federal funding to states for school lunches and specified the general nutrition content of those lunches( 1 ). At least 94 % of schools now participate and over 200 billion NSLP lunches have been served( 2 , Reference Ralston, Newman and Clauson 3 ).
Any child at a participating school can purchase an NSLP lunch, although the programme also plays a critical role in delivering food assistance to low-income children by providing means-tested reduced- and no-cost lunches. Unfortunately, US Department of Agriculture (USDA) assessments have indicated persistently high average sodium, fat, saturated fat and energy content in NSLP lunches( Reference Dwyer 4 – Reference Gordon, Crepinsek and Nogles 6 ). In 2004–5, a nationwide assessment commissioned by the USDA estimated that just 4–7 % of schools complied with all NSLP nutrition standards( Reference Gordon, Crepinsek and Nogles 6 ). In 2009–10, a subsequent assessment indicated overall nutrition improvements; however, under half of elementary schools and less than one-quarter of secondary schools at the time of the evaluation were serving lunches that would meet new energy ceilings (implemented in 2012)( 7 ).
Such evidence has motivated extensive research into a link between school-based child nutrition programmes and child overweight and obesity, which has yielded mixed conclusions( Reference Jones, Jahns and Laraia 8 – Reference Millimet, Tchernis and Hussain 14 ). Notably, two recent studies (using the same data set, the Early Childhood Longitudinal Study) applied advanced econometric techniques to longitudinal, individual-level observational data and both concluded that school lunches contributed to increased student weight between kindergarten and grade 5( Reference Schanzenbach 13 , Reference Millimet, Tchernis and Hussain 14 ). A third study examined only low-income children in the same data set and reported significantly greater BMI rate of change among girls, but not boys, participating in the NSLP compared with non-participants from kindergarten to 8th grade, although no significant difference in girls’ mean BMI( Reference Hernandez, Francis and Doyle 15 ). Just one study appears to have investigated the NSLP's long-term health impact at the population level; that study examined adult BMI from 1976 to 1980 and reported no discernible impact based on estimated NSLP participation( Reference Hinrichs 16 ).
Additional investigation of the NSLP's historic long-term population health impact may be merited. The NSLP's history spans a full reversal of public health efforts with respect to food consumption, from an emphasis on reducing malnutrition in the post-World War II era to a modern emphasis on reducing overweight and obesity( Reference Levine 17 ). In addition to its aim to alleviate hunger and malnutrition, the NSLP also aims to ‘encourage the domestic consumption of nutritious agricultural commodities and other food’( 1 ). Some official statements from the programme's early years suggest an expectation that the NSLP could increase population food consumption. For example, in 1948, the USDA Administrator testified that given the higher food content of an NSLP lunch compared with the typical packed lunch, the programme ‘is a significant contribution to the “floor under consumption” which is so important to the stability of our agricultural economy’( 18 ). Nutrition guidelines for NSLP lunches that dictated minimum food content were not changed substantially until 1995, when school meals were required to comply with the USDA's Dietary Guidelines for Americans (first issued in 1980)( Reference Dwyer 4 ). Attention to the NSLP's nutrition performance has increased substantially in recent years and as of the 2012–13 school year, new NSLP rules include maximum energy content, as well as more fruits, vegetables, low-fat milk and whole grains( 19 ).
The present research aimed to investigate whether there was a historic association between participation in the NSLP during childhood and subsequent prevalence of overweight and obesity among adults at the population level, among adult-age cohorts, by US state. The research used publicly available data and involved no human subjects.
Methods
The analytic data set consisted of information compiled from a number of sources: the Behavioural Risk Factor Surveillance System (BRFSS) survey (www.cdc.gov/BRFSS), US Congressional Record, US Census and the USDA. Regression models examined state-based adult-age cohorts’ BMI from 1984 to 2008 compared with the cohorts’ estimated NSLP participation during schooling.
Health data
BRFSS self-reported data on age, weight and height from 1984 to 2008 were used to estimate the prevalence of overweight and obesity (indicated by BMI ≥25 kg/m2( 20 )) among adult-age cohorts by state (see Appendix). Not all US states participated in the BRFSS annually over the observation period; however, each state contributed at least 15 years of data to this analysis, and just ten states contributed less than 20 years of data. After excluding outliers (weight >500 lb (>226·8 kg) and height >8 ft (>2·44 m)), the average number of adults aged 18–64 years contributing data for the estimates of overweight and obesity prevalence derived for the present analysis ranged from 675 (range: 382–1245) adults per state in 1984 to 5596 (range: 2288–15 843) in 2008, with >3 million observations in total from 1984 to 2008. The research examined aggregated adult-age cohorts of 18–34 years, 35–49 years, 50–64 years and 18–64 years by US state and included a total of 1064 state-cohort observations from 1984 to 2008. Table 1 reports summary statistics.
Table 1 Summary statistics, all US states (1984–2008)
NSLP, National School Lunch Program.
All parameters represent percentages (i.e. state poverty=percentage of people in poverty by state).
n 1064 state-cohort observations; excludes Hawaii, Alaska and Washington, DC.
†Not an age-specific measure.
National School Lunch Program participation data
The number of students participating in the NSLP annually in each state from 1946 to 2007 was obtained from the US Congressional Record (1946–1988)( 18 ) and the USDA Food and Nutrition Service (1989–2007)( 21 ). For example, in 1947, 1948 and 1949 in Montana the Congressional Record reported that 19 395 children, 20 063 children and 22 707 children ate NSLP lunches, respectively, based on monthly average participation data. Annual participation data for all states were missing for five years (1952, 1959, 1966, 1967 and 1976) from the US Congressional Record. Participation for those years was interpolated linearly from adjacent years for each state.
Population estimates data
US Census data from 1920 to 2008 provided population estimates by age and state, which were used in combination with NSLP participation data to estimate the percentage of the school-aged (5–17 years) population that participated in the NSLP in each state from 1946 to 2007( 22 ) (see Appendix). Due to incomplete data on Alaska, Hawaii and Washington, DC in historic US Census sources, these areas were not included in the analysis. US Census data were used to estimate the racial/ethnic composition of the state-based adult cohorts under analysis and the percentage of people in poverty by state.
Cohort framework
Adult cohorts of different ages and in different states participated in the NSLP at different rates during childhood. For example, in one state 30 % of children may have participated in the NSLP in a given year, while in another state the rate may have been 55 %. The analysis assigned a state- and age-specific NSLP participation rate to each adult state-cohort in 1984–2008 based the assumption that those adults attended school from age 5 to 17 years in the same state in which they resided as adults. A similar approach was used in a previous study( Reference Hinrichs 16 ), although this assumption is a limitation. No relevant data were available to compare state of adult residence with state of schooling. US Census estimates of geographic mobility revealed a relatively high proportion of the adult population living in the state of birth for each Census from 1920 (67 %) to 2000 (60 %)( 23 ).
The analysis examined fixed age cohorts over time (18–64-year-olds in 1984, 1985, etc.) as opposed to a longitudinal analysis (18–64-year-olds in 1984, 19–65-year-olds in 1985, etc.), owing to available historic data. Adults in the oldest age cohort observed in the present analysis (age 50–64 years) were in school from 1925 to 1975, while adults in the youngest age cohort (age 18–34 years) were in school from 1955 to 2007. Therefore, the cohort structure captured variation not only in adult ages, but also different periods in school (i.e. exposed to the NSLP).
An example of the cohort framework is as follows. Individuals aged 64 years in 1984 were assumed to have been born in 1920 and enrolled in school from 1925 to 1937, and therefore were assigned ‘0 %’ NSLP participation (the programme did not begin until 1946). Individuals aged 50 years in 1984 were assumed to have been born in 1934 and enrolled in school from 1939 to 1951, and therefore were assigned state- and age-specific estimated NSLP participation. Each state-cohort's estimated NSLP participation was calculated in three stages (see Appendix). Table 1 reports summary statistics. Figure 1 depicts estimated annual average NSLP participation rates for each age cohort.
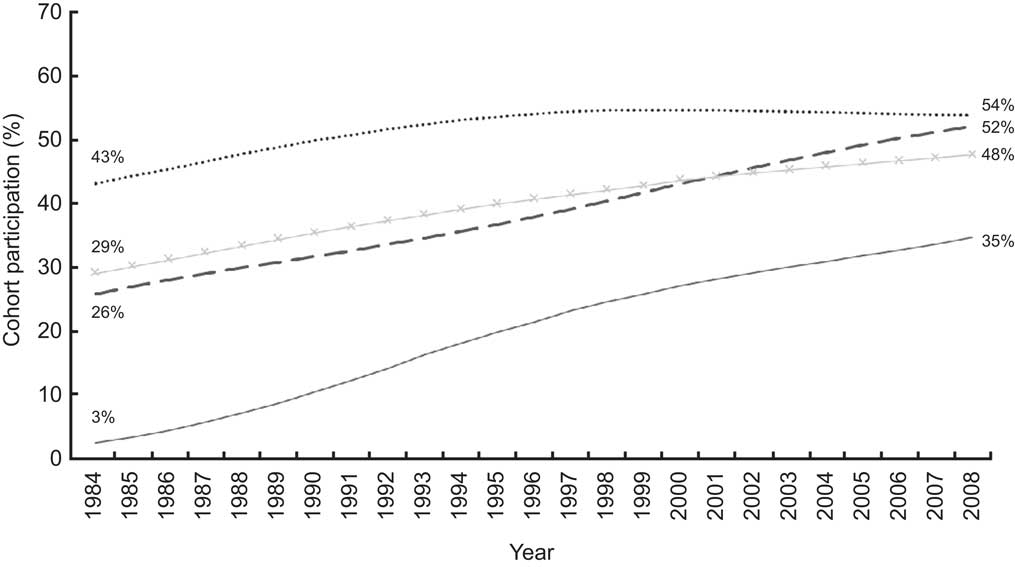
Fig. 1 Estimated cohort participation in the National School Lunch Program according to age cohort (![]() , age 18–34 years;
, age 18–34 years; ![]() , age 35–49 years;
, age 35–49 years; ![]() , age 50–64 years;
, age 50–64 years; ![]() , age 18–64 years) over a 25-year period (1984–2008), all US states combined
, age 18–64 years) over a 25-year period (1984–2008), all US states combined
Statistical analysis
Statistical analysis was performed using the Stata 10 statistical software package. The dependent variables of interest were repeated cross-sectional observations (panels) of state-cohorts’ prevalence of overweight and obesity from 1984 to 2008. The independent variables of interest were the state-cohorts’ estimated NSLP participation rates during schooling from 1925 to 2007. The analysis controlled for the state-cohorts’ racial/ethnic composition and the percentage of people in poverty based on US Census data during the analysis years (1984–2008)( Reference Paeratakul, Lovejoy and Ryan 24 – Reference Flegal, Carroll and Ogden 27 ). The models included state and year fixed effects – equivalent to assigning a dummy variable for each state and year to account for any constant state-specific and year-specific characteristics – and state-level clustered standard errors to account for repeated observations of the same states in the data set. The use of a fixed-effects model was supported empirically by a Hausmann test (P < 0·001).
Results
Among adults aged 18–64 years from 1984 to 2008 (i.e. in school between 1925 and 2007), a one percentage-point increase in estimated NSLP participation during schooling was significantly associated with a 0·29 percentage-point increase in the cohort's future prevalence of overweight and obesity (P < 0·05; Table 2, column 1). Regression results among cohorts aged 18–34 years (in school between 1955 and 2007) and 35–49 years (in school between 1940 and 1990) also estimated positive associations between NSLP participation and the cohorts’ future overweight and obesity prevalence, although these results were not statistically significant (Table 2, columns 2 and 3). Among adults aged 50–64 years (in school between 1925 and 1975), a one percentage-point increase in estimated NSLP participation was significantly associated with a 0·14 percentage-point increase in the cohort's future prevalence of overweight and obesity (P < 0·05; Table 2, column 4). State poverty rates demonstrated a significant and positive association with the cohorts’ prevalence of overweight and obesity among adults aged 35–49 years over the observation period. The proportions of adults of black, Hispanic and American Indian race/ethnicity among adult cohorts aged 18–64 years, 18–34 years and 50–64 years were significantly and positively associated with the cohorts’ prevalence of overweight and obesity. The proportion of American Indians was also significantly associated with the prevalence of overweight and obesity in the 50–64-year-old cohort. The proportion of adults of Asian race/ethnicity among the 18–34-year-old cohort was significantly and negatively associated with the cohort's prevalence of overweight and obesity.
Table 2 Regression results examining participation in the National School Lunch Program (NSLP) during childhood and subsequent prevalence of overweight and obesity among adults at the population level, all US states (1984–2008)
Dependent variable: state-cohort prevalence of overweight and obesity, 1984–2008.
Results are β, state-level clustered se and unclustered se.
All parameters (including dependent variable) represent percentages.
n 1064 state-cohort observations for all models; excludes Hawaii, Alaska and Washington, DC. All models included fixed state effects and time dummies.
(*) P < 0·10, *P < 0·05, ***P < 0·001.
Discussion
A multivariable regression analysis of state-based adult cohorts aged 18–64 years and 50–64 years during the period 1984–2008 estimated a positive association between the cohorts’ estimated NSLP participation during schooling and subsequent overweight and obesity prevalence. This association was not significant among state-based cohorts aged 18–34 years and 35–49 years.
The present analysis examined a population outcome; therefore, it is not possible to make inferences about the impact of the NSLP at the individual level based on these results. Another limitation is that the analysis did not address cohorts’ participation in other child nutrition programmes; the School Breakfast Program, for example, was available beginning in 1966, although generally had much lower participation than the NSLP( 28 ). Another limitation is that the analysis relied on self-reported age, height and weight data from the BRFSS to estimate the prevalence of overweight and obesity. The analysis assessed limited covariates – only race/ethnicity and poverty – that were potentially relevant to the cohorts’ overweight and obesity prevalence. The cohort construction that was possible based on historic data simultaneously captured variation in both cohort age (i.e. 18–34 years v. 50–64 years) and time in school (i.e. 1955–2007 v. 1925–1975), thus it is important to note that results for the 18–64 years age cohort were not simply an average of the estimates for the smaller cohorts. A major drawback of the fixed cohort design was an inability to distinguish NSLP participation by year of schooling with more specificity.
The analysis was limited by a lack of consistent historic, state-based data on factors, such as child poverty, that might have influenced state-level average NSLP participation. It is also possible that states’ NSLP participation might be endogenous in a model of subsequent adult health outcomes. In such a situation, excluded instruments can sometimes improve model estimates of observational data. Two variables that recent research has shown to be associated with NSLP participation( Reference Akin, Guilkey and Popkin 29 – Reference Anderson, Butcher and Levine 33 ) – the percentage of free and reduced-price lunches served and female labour force participation – for which relevant historic data were available were tested as excluded instruments, although both were insufficiently empirically correlated with historic NSLP participation to be used as instruments.
This historic, population-level observational analysis controlled for fixed trends in time and location, as well as poverty and race/ethnicity, and estimated that state-based adult cohorts’ NSLP participation during childhood between 1946 and 2007 was associated with the cohorts’ future prevalence of overweight and obesity for some age cohorts. Due to the time period under consideration, the analysis did not account for the impact of important NSLP nutrition improvements – perhaps related to state and federal legislation – in recent years. A population-level analysis is a blunt instrument to assess adult health outcomes associated with a childhood experience. Despite drawbacks, the present research appears to be the first to examine a potential historic association between NSLP participation and subsequent adult health while accounting for programme participation over many decades. Future research might employ more complex modelling techniques to overcome the drawbacks of observational data with such an approach. But given the limitations of population-level analyses, it is more likely that individual-level longitudinal data now being collected – for example, through the Early Childhood Longitudinal Study – will provide the best opportunities for robust analysis with respect to the question of the NSLP's long-term heath impact in more recent times.
Acknowledgements
Sources of funding: This research received no specific grant from any funding agency in the public, commercial or not-for-profit sectors. Conflicts of interest: There are no financial or personal conflicts of interest. Ethics: Ethical approval was not required. Authorship: C.P. designed and conducted the analysis and drafted and revised the manuscript.
Appendix
BMI estimates
BMI and prevalence of overweight and obesity (OVOB) were calculated from Behavioural Risk Factor Surveillance System (BRFSS) data (1984–2008) as:
 $${\rm{BMI}}\, = \,\frac{{{\rm{weight}}\ {\rm{(pounds)}}}}{{[{\rm{height}}\,{\rm{(inches)}}\times {\rm{height}}\,{\rm{(inches)}}]}}\times {\rm{703}}\eqno\rm$$
and
 $${\rm{Prevalence}}\,{\rm{OVO}}{{{\rm{B}}}_{st}}\, = \,\frac{{{\rm{number}}\,{\rm{of}}\ {\rm{adults}}\ {\rm{with}}\,{\rm{BMI}}\geq {\rm{25}}\ {\rm{kg/}}{{{\rm{m}}}^2} \,{\rm{in}}\ {\rm{state}}\ s\ {\rm{in}}\ {\rm{year}}\ t}}{{{\rm{number}}\ {\rm{of}}\ {\rm{adults}}{\rm}\ {\rm{in}}\ {\rm{state}}\ s\ {\rm{in}}\ {\rm{year}}\ t}}\,\times \,{\rm{100\%. }}\eqno\rm$$
Population estimates
-
• National estimates of the 5–17 years age group were available from US Census sources for each year from 1920 to 2008 and state-level estimates by age were available for all decennial Census years (1920, 1930, etc.). For intercensal years for which annual population estimates by state for the 5–17 years age group were not available from Census sources, estimates were achieved by using the Census's annual national estimate for the age group and raking each state's proportion of the national population between the decennial Census years. For example, in the 1920 Census, Alabama's 5–17-year-old population accounted for an estimated 2·74 % of the national total population aged 5–17 years, while in the 1930 Census, Alabama's 5–17-year-old population accounted for 2·56 % of the national total. A linear interpolation was used to estimate the state's percentage of the 5–17 years age group between the Census years (i.e. in 1921, it was estimated that the state had an estimated 2·72 % of national population estimate for the age group; in 1922, 2·70 %; in 1923, 2·68 %; etc.).
-
• For some Census years, clustered age groups were disaggregated to yield an estimate of the desired 5–17 years school-age cohort. For example, in the 1920 Census, age group estimates by state were published for cohorts of 5–9 years, 10–14 years and 15–19 years. The 15–19 years age group was disaggregated to a 15–17 years age group based on the assumption that each 1-year age group contributed the same proportion to the clustered cohort. The estimate of the 15–17 years age cohort was then summed with the other relevant cohort estimates to produce a total estimate of 5–17-year-olds in each state.
National School Lunch Program participation estimates
Each adult-age cohort's estimated National School Lunch Program (NSLP) participation by state was calculated in three stages. First, an average annual NSLP participation rate was calculated for each state from 1946 to 2007. The annual participation rate was the number of children participating in each state (reported in administrative sources) annually divided by the school-age population (age 5–17 years) that year (estimated from US Census sources). The annual participation rate in state s in year t was calculated as:
 $${\rm{Annual}}\ {\rm{NSLP}}\ {\rm{participatio}}{{{\rm{n}}}_{st}}\, = \,\frac{{{\rm{number}}\ {\rm{of}}\ {\rm{participants}}\ {\rm{in}}\ {\rm{state}}\ s\ {\rm{in}}\ {\rm{year}}\ t}}{{{\rm{school \hbox{-} age}}\ {\rm{population}}\ {\rm{(age}}\ {\rm{5 \!-\! 17)}}\ {\rm{in}}\ {\rm{state}}\ s\ {\rm{in}}\ {\rm{year}}\ t}}\,\times \,100\%.\eqno\rm$$
Second, total participation in the NSLP during schooling for 1-year adult-age cohorts by state and analysis observation year (e.g. 55-year-olds in Montana in 1984 or 26-year-olds in Oklahoma in 2008) was calculated by taking an average of estimated annual participation rates during the cohort's 13 years in school, weighted by the size of the school-age cohort in the state during each year of schooling to capture any cohort size changes that occurred during the cohort's schooling years. Years in school were identified by year of birth for each cohort; the year of birth for each 1-year adult cohort for the analysis years (1984–2008) was identified using analysis year – cohort age, and the years of schooling were identified using birth year + 5 to birth year + 17. Total participation in the NSLP during schooling for a cohort in state s born in year b was calculated as a weighted average:
 $${\rm {Total}}\ {\rm{NSLP}}\,{\rm{paticipatio}}{{{\rm{n}}}_{sb}}\, = \,\frac{{\mathop{\sum}\limits_{t\, = \,b\, + \,5}^{t\, = \,b\, + \,17} {{\rm{annual}}\ {\rm{participatio}}{{{\rm{n}}}_{st}}\times {\rm{school \hbox{-} age}}\ {\rm{population}}\ {\rm{size}}\ {{{{\rm{(age}}\,{\rm{5\!-\! 17)}}}}_{st}}} }}{{\mathop{\sum}\limits_{t\, = \,b\, + \,5}^{t\, = \,b\, + \,17} {{\rm{school \hbox{-} age}}\ {\rm{population}}\ {\rm{size}}\ {{{{\rm{(age}}\,{\rm{5 \!-\! 17)}}}}_{st}}} }}\,\times \,100\% .\eqno\rm$$
Third, a measure of cohort participation in the NSLP was calculated for the four aggregated adult-age cohorts examined in the analysis (18–64 years, 18–34 years, 35–49 years, 50–64 years) in the observation years by state by taking the average total participation for each contributing 1-year adult-age cohort calculated in the step above (e.g. 1-year age cohorts of 18, 19, 20 years, and so on, that contributed to the 18–34 years cohort in each state), weighted by the size of each contributing 1-year adult-age cohort in the state in the analysis observation years (1984–2008). Cohort participation for adults in the cohort aged 18–64 years in state s in observation year t was calculated as a weighted average:
 $${\rm{Cohort}}\,{\rm{NSLP}}\,{\rm{paticipatio}}{{{\rm{n}}}_{sb}}\, = \,\frac{{\mathop{\sum}\limits_{b\, = \,t\, - \,64}^{b\, = \,t\, - \,18} {{\rm{total}}\ {\rm{participatio}}{{{\rm{n}}}_{sb}}\times {\rm{adult}}\ {\rm{cohort}}\ {\rm{population}}\ {\rm{size}}\ {{{{\rm{(age}}\,{\rm{18 \!-\! 64)}}}}_{st}}} }}{{\mathop{\sum}\limits_{b = t - 64}^{b = t - 18} {{\rm{adult}}\ {\rm{cohort}}\ {\rm{population}}\ {\rm{size}}\ {{{{\rm{(age}}\,{\rm{18 \!-\! 64)}}}}_{st}}} }}\,\times \,100\% .\eqno\rm$$


