


Many studies, conducted mainly in developed countries, demonstrate that consumption of better-quality diets – characterized by greater intakes of fruits, fresh vegetables, whole grains and lean meats, higher micronutrient intakes, lower intakes of added sugars, fats and Na, and lower energy density – are positively associated with socio-economic status (SES)( Reference Irala-Estevez, Groth and Johansson 1 – Reference Aggarwal, Monsivais and Drewnowski 13 ). Almost all studies used education and income as a proxy of SES.
Although the association between SES and diet quality is well established in developed nations, it is still understudied in middle-income countries like Brazil. Brazilian studies that focused on the relationship between SES and obesity showed an inverse association between obesity and income during the period from 1975 through 2003( Reference Monteiro, Conde and Popkin 14 ) and reported that the influence of education on obesity prevalence was more pronounced than that of income, especially among women( Reference da Fonseca M de, Faerstain and Chor 15 ).
In relation to diet, the hypothesis that education and income do not have the same impact on diet quality is supported by the fact that income and education reflect different aspects of SES( Reference Aggarwal, Monsivais and Cook 16 , Reference Turrell, Hewitt and Patterson 17 ). For example, Monsivais and Drewnowski( Reference Monsivais and Drewnowski 4 ) found that education was a stronger predictor of energy density than was household income in American adults. Among the French elderly, higher energy intake was associated with higher income, but not with education level( Reference Féart, Jutand and Larrieu 18 ). A review study showed that education had a stronger effect on diet quality than did income( Reference Drewnowski and Specter 19 ).
It may be worthwhile to test this hypothesis in Brazil since education and income are not highly correlated; people in the lowest education level vary in income. The explanation for this is that the recent increase of 28 % in household income between 2004 and 2009 was not accompanied by a similar improvement in education status, with an increase of only 0·6 full years of study being observed in the same period( 20 ).
Findings of the Brazilian national study on nutritional deficiencies showed that the major problems among adults are the inadequacy of Ca, Mg, P, Na and vitamins A, C, D and E, for which the prevalence of inadequate intake was ≥60 %, and the inadequacy of Zn, thiamin and Fe (only in women), for which the prevalence of inadequate intake was ≥20 %( Reference Araujo, Bezerra and Barbosa F dos 21 ).
We aimed to study the independent association of income and education with those nutrients with a high prevalence of inadequacy among Brazilian adults. To our knowledge, the present study is the first to investigate the relationship between education and income and nutrient intakes in a nationwide sample in a middle-income country.
Methods
Population
The present study analysed data obtained from the Brazilian National Dietary Survey (NDS), which was carried out along with the 2008–2009 Household Budget Survey (HBS) conducted by the Brazilian Institute of Geography and Statistics. The NDS was the first national survey of individual dietary intake. The sample for the Brazilian HBS was selected using a two-stage cluster sampling design. In the first stage, the primary sampling units, census tracts, were selected by systematic sampling with probability proportional to the number of households. Census tracts were stratified to include representatives of all Brazilian regions, including both urban and rural areas, and also different socio-economic levels. In the second stage, households were selected by simple random sampling. The 2008–2009 HBS included 68 373 households from 4694 census tracts. A sub-sample of 25 % of the HBS households was estimated for the NDS. Finally, a total of 13 569 households agreed to participate in the survey (21 % were non-responders). Individuals aged 10 years or older (n 34 003) living in the selected households were included in the dietary survey. For the present paper we included only individuals aged 20–59 years, with the exception of pregnant and lactating women (n 1065), yielding a final sample of 21 003 Brazilian adults( 22 ). A total of 166 adults who did not answer the education question were excluded from analysis.
The sample weights used represent the adult population as in the census for the five Brazilian regions (North, South, Midwest, Southeast and Northeast) and the urban or rural areas. The general characteristics of adults investigated in the NDS were very similar to those of adults from the HBS, which has representativeness for the Brazilian population (Table 1). The present study was approved by the local ethics committee (CAAE 0011.0.259.000-11).
Table 1 General characteristics and prevalence of obesity among Brazilian adults aged 20–59 years (excluding pregnant and lactating women) from the 2008–2009 Household Budget Survey and National Dietary Survey

Values are presented as weighted means or percentages and their standard errors.
Dietary intake
Food records of two non-consecutive days were used to estimate food intake. All respondents received a booklet, which contained explanations on how to fill out the records and pictures of tableware to help them estimate the amount of food consumed. Individuals were encouraged to fill out information on foods, beverages, amounts consumed and the time and place of meals. Trained interviewers were responsible for entering the data obtained during the household survey in a computer database while at the household. Details about the pre-test, training and validation of the food records have been published elsewhere( 22 ).
The energy and nutrient intakes were estimated using a food composition table( 23 ) and a food portion table( 24 ) specially developed for the survey. Standard recipes were created and nutritional information was based on the Brazilian Table of Food Composition and the Nutrient Data System for Research, version 2008 (Nutrition Coordinating Center, University of Minnesota, Minneapolis, MN, USA). The nutrient intake data did not include the consumption of supplements and/or medications.
Socio-economic status
Socio-economic characteristics were recorded during the household interviews. Monthly household per capita income from all monetary and non-monetary sources of income, including gifts, donations, employment, self-employment and participation in cash transfer programmes, was calculated. The total household income was divided by the number of members in the household to calculate the per capita household income and then classified into quartiles: ≤$US 120·70, >$US 120·70–227·30, >$US 227·30–440·90 and >$US 440·90 per capita per month. The conversion rate at the time of the HBS ($US 1 = 2·38 Brazilian Real) was applied to convert the amounts to US dollars. Moreover, the official minimum monthly wage in Brazil during this period was $US 174·40.
Education was defined as the number of full years of study and was evaluated in quartiles according to the number of full years of education: ≤4 years, 5–8 years, 9–11 years and >11 years.
Data analyses
The prevalences of inadequate and excessive nutrient intakes and the usual nutrient intakes were estimated by using the National Cancer Institute (NCI) method. This method estimates the usual intake after adjusting for within-person variance, by considering the consumption-day amount using the linear mixed-effects model on a transformed scale( Reference Tooze, Midthune and Dodd 25 ). To estimate the usual nutrient intake expressed as a ratio, such as energy from saturated fat, the NCI method was also used and the usual ratio of intake was considered( Reference Freedman, Guenther and Dodd 26 ).
The NCI method assumes a simple random sampling. For a complex sample design, the BBR (balanced repeated replication) technique with the modification described by Fay( Reference Fay 27 ) is used to estimate standard errors and P values. Fay's BRR method considers design situations in which there are two primary sampling units per stratum. Since the NDS had more than two primary sampling units per stratum, a method called GBHS (grouped balanced half samples) was used. This method randomly assigns primary sampling units into two groups of approximately the same size in each stratum( Reference Barbosa, dos, Sichieri and Junger 28 , Reference Kish and Frankel 29 ).
The values of Estimated Average Requirement (EAR) proposed by the US Institute of Medicine were used as the reference for micronutrient intake( 30 – 35 ), and the EAR cut-off point method was used to estimate the prevalence of inadequate nutrient intake( Reference Beaton 36 ). The prevalence of inadequate nutrient intake represents the proportion of the population below the median requirement. Because the distribution of Fe requirement among women of reproductive age is skewed, the EAR cut-off point method could not be applied. In this case, the probability approach method was used to estimate the prevalence of inadequate Fe intake( 33 ).
The Na intake in the Brazilian population is excessively high( Reference Sarno, Claro and Levy 37 ); therefore, we used the Tolerable Upper Intake Level (UL) values, also proposed by the Institute of Medicine, to calculate the proportion of the population above the UL who were at risk of adverse effects( 34 ). Furthermore, the Na intake represents the total Na in food, taking into account both natural Na and added Na.
The cut-off point for energy intake from saturated fat (7 %) was based on the recommendation of the Brazilian Society of Cardiology( Reference Sposito, Caramelli and Fonseca 38 ). For dietary fibre intake, we adopted a value of 25 g/d considering a diet of 8368 kJ (2000 kcal) as recommended by the Brazilian Ministry of Health( 39 ). In the present paper, we considered 12·5 g dietary fibre/4184 kJ (1000 kcal). For both Na intake and energy intake from saturated fat, the inadequacy was based on excessive consumption of these nutrients.
The prevalences of inadequate and excessive nutrient intakes and their standard errors were calculated according to quartiles of monthly household per capita income and education, and models to estimate the prevalence included the five Brazilian regions (North, South, Midwest, Southeast and Northeast) and the area in which the households were located (urban or rural) as covariates.
Linear regression models were used to evaluate the associations between nutrient intakes (dependent variable) and SES (independent variable). The individual usual energy and nutrient intakes were evaluated as continuous variables and income and education were assessed as quartiles. The models considered both the independent and the mutually adjusted associations of education and income with nutrient intakes, adjusted for age and additionally for energy intake for analysis of minerals and vitamins. Furthermore, the aged-adjusted weighted mean nutrient intakes by quartiles of income and education and means mutually adjusted according to sex were estimated, except for those analyses with a statistically significant interaction between education and income. The interaction terms between sex and socio-economic variables and between income and education were tested for all nutrients. For those nutrients with a statistically significant interaction, aged-adjusted weighted means according to both income and education quartiles and by sex were shown graphically.
Both prevalence of inadequacy and linear models analyses took into account the day-to-day intra-individual variation in nutrient intake. The MSM (Multiple Source Method) was used to estimate individual usual nutrient intakes in the linear models( Reference Harttig, Haubrock and Knuppel 40 ).
All statistical analyses were weighted and performed using survey procedures from the statistical software package SAS release 9·3 to take into account the sample design effect. Weighting factors were corrected for non-response, thus allowing representative population estimates.
Results
For seven out of the eleven nutrients analysed (Ca, P, Zn, thiamin and vitamins B12, A and C), the prevalence of inadequate intake decreased with increasing income among men. In women, the prevalence of inadequate intake decreased with income for eight nutrients (Ca, P, Fe, Zn, thiamin and vitamins B12, A and C; Table 2). Similar results were observed for both sexes with regard to education levels (Table 3).
Table 2 Sample size (n 21 003), cut-off points used as guidelines and prevalences of inadequate nutrient intakes according to income quartilesFootnote * in Brazilian adults aged 20–59 years (excluding pregnant and lactating women), 2008–2009 National Dietary Survey

Values are presented as percentages and their 95 % confidence intervals.
* Income quartiles (monthly household per capita): Q1 = ≤$US 120·70; Q2 = >$US 120·70–227·30; Q3 = >$US 227·30–440·90; Q4 = >$US 440·90.
† Calculated by the probability approach method.
‡ Calculated as retinol activity equivalents.
Table 3 Sample size (n 20 837)Footnote *, cut-off points used as guidelines and prevalences of inadequate nutrient intakes according to education quartilesFootnote † in Brazilian adults aged 20–59 years (excluding pregnant and lactating women), 2008–2009 National Dietary Survey

Values are presented as percentages and their 95 % confidence intervals.
* One hundred and sixty-six adults were excluded because they had no information about education.
† Education quartiles (years of education): Q1 = ≤4 years; Q2 = 5–8 years; Q3 = 9–11 years; Q4 = >11 years.
‡ Calculated by the probability approach method.
§ Calculated as retinol activity equivalents.
For men and women, the excessive intake of energy from saturated fat and inadequate fibre intake increased with income (Table 2) and education level (Table 3). The prevalence of excessive Na intake in both sexes, and the prevalence of inadequate Fe intake in men, did not change with income (Table 2) or education level (Table 3). Inadequate intakes of Zn among men and of Fe among women aged 21–59 years changed only with income (Table 2).
The interaction term between sex and income was statistically significant (P < 0·05) only for fibre intake and the interaction between sex and education was statistically significant for fibre, Fe, Zn and vitamin B12 intakes (data not shown). Once sex modified the effect of the association between some nutrients and SES variables, all analysis were stratified according to sex.
Most nutrients were independently associated with income and education, such as energy, energy from saturated fat, fibre, thiamin and vitamins A and C in both sexes (Tables 4 and 5) and also for P among men (Table 4). Fe, vitamin B12 and Na intakes among women were associated only with education (Table 5). However, Fe intake was associated only with income among men (Table 4). Vitamin B12 intake was not associated with income or education among men (Table 4). An intriguing result was verified for Zn intake in that it was positively associated with income and education in the mutually adjusted model in both sexes, despite no association being observed in the simple models for income and education with the exception of the statistically significant association between education and Zn intake among men.
Table 4 Aged-adjusted weighted mean nutrient intakes by quartiles of income and education and mean nutrient intakes mutually adjusted among Brazilian men (n 9974) aged 20–59 years, 2008–2009 National Dietary Survey

SES, socio-economic status
*SES variable quartiles as follows. Income quartiles (monthly household per capita): Q1 = ≤$US 120·70; Q2 = >$US 120·70–227·30; Q3 = >$US 227·30–440·90; Q4 = >$US 440·90. Education quartiles (years of education): Q1 = ≤4 years; Q2 = 5–8 years; Q3 = 9–11 years; Q4 = >11 years.
†Eighty-one men were excluded because they had no information about education.
‡Mean nutrient intake by income and education quartiles is shown in Fig. 1 for interaction term P < 0·05.
§1 kJ = 0·239 kcal.
||Further adjusted for energy intake as a continuous variable by a linear model.
¶Calculated as retinol activity equivalents.
**Diff = difference in percentage between mean nutrient intake in the fourth and first quartiles: [(mean in Q4 – mean in Q1)/general mean] × 100.
Table 5 Aged-adjusted weighted mean nutrient intakes by quartiles of income and education and mean nutrient intakes mutually adjusted among Brazilian among women (n 11 029) aged 20–59 years (excluding pregnant and lactating women), 2008–2009 National Dietary Survey

SES, socio-economic status
*SES variable quartiles as follows. Income quartiles (monthly household per capita): Q1 = ≤$US 120·70; Q2 = >$US 120·70–227·30; Q3 = >$US 227·30–440·90; Q4 = >$US 440·90. Education quartiles (years of education): Q1 = ≤4 years; Q2 = 5–8 years; Q3 = 9–11 years; Q4 = >11 years.
†Eighty-five women were excluded because they had no information about education.
‡Mean nutrient intake by income and education quartiles is shown in Fig. 1 for interaction term P < 0·05.
§1 kJ = 0·239 kcal.
||Further adjusted for energy intake as a continuous variable by a linear model.
¶Calculated as retinol activity equivalents.
**Diff = difference in percentage between mean nutrient intake in the fourth and first quartiles: [(mean in Q4 – mean in Q1)/general mean] × 100.
The interaction between income and education was statistically significant (P < 0·05) for energy, Ca, P, Fe and Na intakes among men and for energy from saturated fat, Ca and P intakes among women. Na intake in men, P intake in women and Ca intake in both sexes were associated with income and education in the simple linear models; however, due to strong interaction between income and education, only the interaction term was statistically significant in the mutually adjusted model (Tables 4 and 5). Ca intake among men increased with income and education; however, this increase with income among men in the highest education quartile was not constant. In addition, Ca intake among women increased with income and education, although this increase with income was more evident in the highest education quartile. Similar results were observed for P intake among women. On the other hand, a negative association between income and Na intake was observed only among men in the highest educational level (Fig. 1).
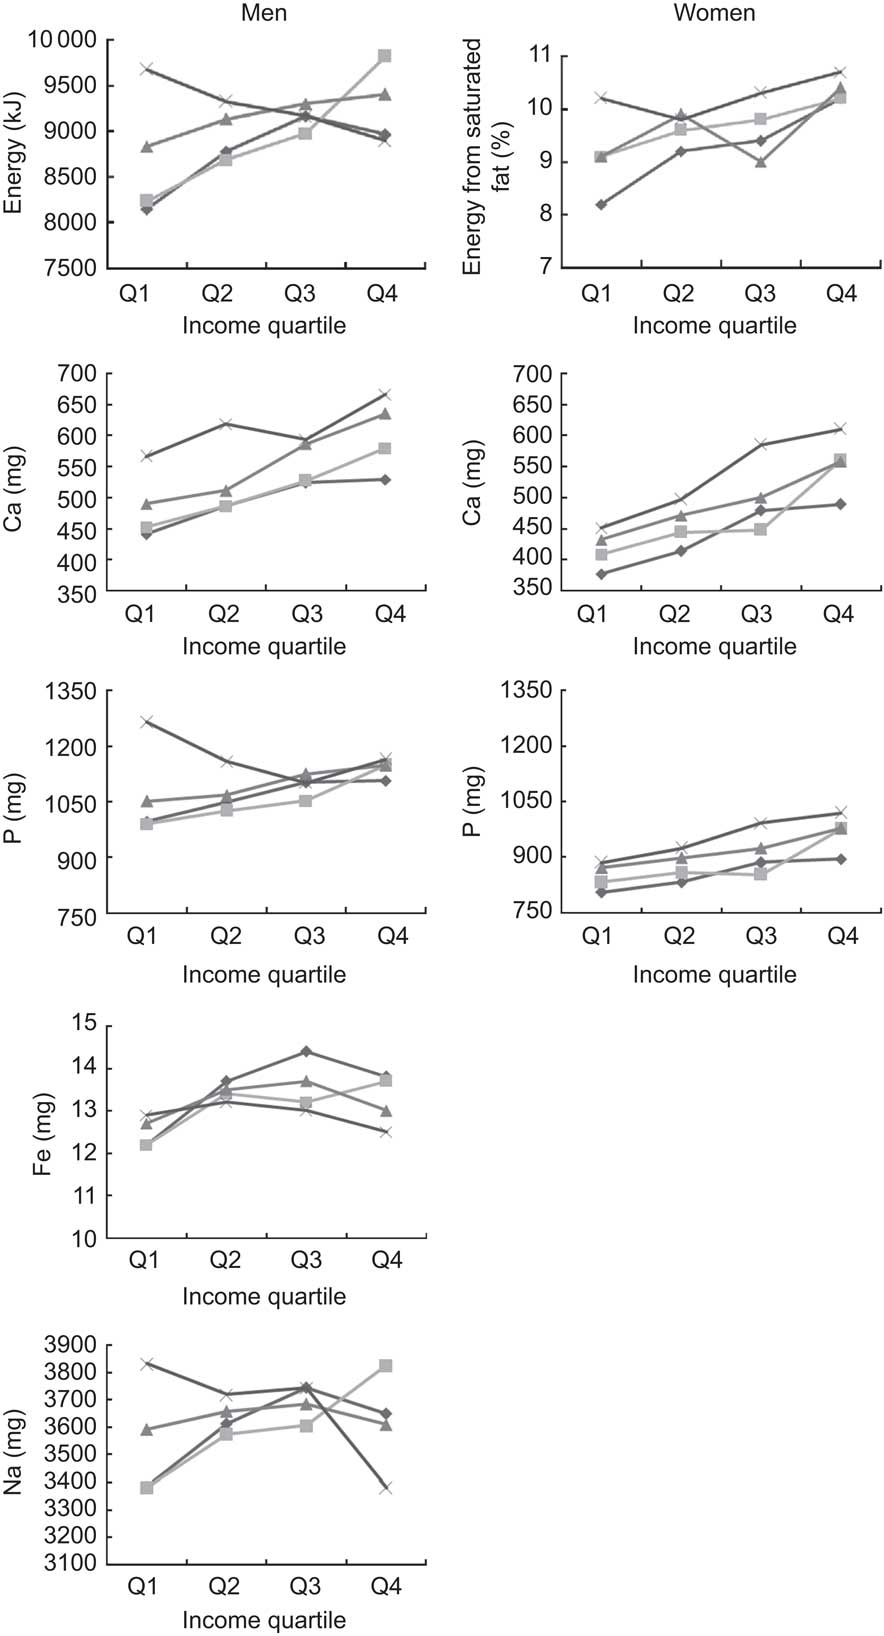
Fig. 1 Aged-adjusted weighted mean nutrient intakes according to quartiles of both income and education for those nutrients with a statistically significant interaction term between income and education according to sex; Brazilian adults aged 20–59 years, 9893 men and 10 944 women (excluding pregnant and lactating women), 2008–2009 National Dietary Survey. Income quartiles (monthly household per capita): Q1 = ≤$US 120·70; Q2 = >$US 120·70–227·30; Q3 = >$US 227·30–440·90; Q4 = >$US 440·90. Education quartiles (years of education): Q1 = ≤4 years (![]() ); Q2 = 5–8 years (inline-graphic xlink:type="simple" mime-subtype="gif" xlink:href="S1368980013003005_inline2"/>); Q3 = 9–11 years (
); Q2 = 5–8 years (inline-graphic xlink:type="simple" mime-subtype="gif" xlink:href="S1368980013003005_inline2"/>); Q3 = 9–11 years (![]() ); Q4 = >11 years (
); Q4 = >11 years (![]() )
)
Discussion
The present study used data from the first Brazilian NDS and revealed that inadequate nutrient intakes decreased with both income and education, with the exception of energy intake from saturated fat and intake of dietary fibre, for which there was a positive association. In addition, we found that most nutrients were associated with both income and education, despite that only educational level had an important role on the consumption of Fe, vitamin B12 and Na among women and only income status was relevant for Fe consumption among men.
In accordance with the findings of our study, many studies have identified that food and nutrient intakes were healthier among wealthy people and those with higher education levels( Reference Irala-Estevez, Groth and Johansson 1 – Reference Aggarwal, Monsivais and Drewnowski 13 ). On the other hand, our study showed that three markers of an unhealthy diet (higher energy intake, higher energy intake from saturated fat, lower fibre intake) were more evident in the high socio-economic groups. Our results indicate that even Brazilian people with high levels of education and resources to purchase and choose better food options do not necessarily achieve better-quality diets. A possible explanation is that the low-income population in Brazil still consumes traditional foods( Reference Souza A de, Pereira and Yokoo 41 ) and has lesser opportunity to consume food in places other than their homes( Reference Bezerra, Souza A de and Pereira 42 ). Eating out of home has gained importance in diets worldwide and also in Brazil, and energy and saturated fat intakes increase with food eaten out of home, whereas fibre intake is reduced( Reference Bezerra, Souza A de and Pereira 42 ).
Although there are few studies in middle- and lower-income countries about the association between diet quality and SES variables, Tseng and Fang( Reference Tseng and Fang 43 ) found similar results among Chinese immigrant women in the USA. They observed that higher education was significantly associated with higher intakes of energy, sugar and sugar-sweetened beverages and lower dietary moderation. The authors concluded that immigrant women followed the traditional diet patterns of their native country.
One aspect to be highlighted is that the high prevalences of inadequate nutrient intakes observed in the present study remained so across all income and education quartiles, despite the negative association with these variables. This finding is particularly important from a public health perspective, considering that Brazilian adults could be at risk of several diseases caused by both deficiencies in micronutrient intake (particularly Ca deficiency, vitamin A and C inadequacy) and excessive nutrient intake (especially saturated fat and Na intakes).
An interesting finding was the role of education in Ca and Na intakes in both sexes. Ca intake in both sexes was associated only with the interaction term of income and education in mutually adjusted models. This means that education intensified the association between income and Ca intake among women, in which the increase of Ca intake with income was much more evident among people in the highest educational level. The same was verified for P intake among women. Nevertheless, the behaviour of Ca intake among men in the highest educational level was modified by income, with a decrease of Ca intake from the second to the third income quartiles. Moreover, education modified the association between income and Na intake among men. We observed a positive association between income and Na intake among men from all educational levels with the exception of men from the highest educational level, for which Na intake decreased with income. Na intake among women was also associated only with education in mutually adjusted models. Similar results about the role of education were found in the USA, in that education had a stronger effect on diet quality than did income( Reference Monsivais and Drewnowski 4 , Reference Drewnowski and Specter 19 ).
It is relevant to mention the difference between sexes in the association of socio-economic variables and Fe intake. While education had the main role on Fe intake among women, only income was associated with Fe consumption among men. Hence, the strategy to increase Fe consumption, mainly among women who are the more vulnerable group to inadequacy, may be dependent on educational level improvement. Furthermore, vitamin B12 intake was associated only with education among women, reaffirming that to reach a better diet quality among women it is fundamental to enhance educational level.
On the other hand, diet cost has been shown to be a mediator of the relationship between SES and diet quality. Aggarwal et al.( Reference Aggarwal, Monsivais and Cook 16 ) found that socio-economic disparities in diet quality may be explained by differential diet cost. The authors concluded that diet cost is one of the critical factors that may explain the consumption of a lower-quality diet among individuals in the lower socio-economic strata, while other studies demonstrated that diet quality was positively associated with diet cost( Reference Rehm, Monsivais and Drewnowski 9 , Reference Iannotti, Robles and Pachón 10 , Reference Drewnowski, Darmon and Briend 44 – Reference Appelhans, Milliron and Woolf 46 ). Nevertheless, diet cost does not explain all of our results considering that the intakes of energy and energy from saturated fat were positively associated with income in both sexes and dietary fibre intake was negatively associated with income status. They were all markers of lower diet quality in highest-income group.
The high prevalences of inadequate nutrient intakes observed could be associated with underestimation of food intake. Although we chose not to exclude under- or over-reporting in our sample, the estimate of usual nutrient intake was done using the NCI method and MSM, which adjust for within-person variance, correcting extreme and unlikely intake (both related to under- or overestimates)( 47 ). In addition, the study design allowed for analysing food consumption over 1 year, which captures the seasonal variation of Brazilian food habits.
A possible limitation of the present study was that it did not consider vitamin and mineral supplemental intake. A Canadian study showed that the prevalence of supplement use was significantly higher among high-income households and individuals with a higher education level( Reference Vatanparast, Adolphe and Whiting 48 ). Although we did not estimate vitamin and mineral supplementation, we are of the opinion that this may not change our results because the use of supplements in Brazil is low and is usually recommended for specific groups, such as pregnant women( Reference Rondó, Fukushima and Moraes 49 ) and athletes( Reference Pereira, Lajolo and Hirschbruch 50 ).
The present population-based study suggests that the role of income and education are independent and their meanings differ according to sex and the nutrient analysed. Purchasing capability alone does not necessarily lead to a healthy diet, as well as a higher education level does not result always in better food choices. Education is one important step to improve nutrient intake in Brazil; emphasis should be laid on enhancing dietary knowledge and formulating economic strategies that would allow lower-income individuals to adopt a healthy diet.
Acknowledgements
Sources of funding: The survey was funded by the Ministry of Health of Brazil (agreement number 4652/2005; grant number 25000.202044/2005-16). The funder contributed to the study design and conduct of the study. M.C.A. received a fellowship from the Brazilian Federal Agency for the Improvement of Higher Education (Coordenação de Aperfeiçoamento de Pessoal de Nível Superior; CAPES). Conflicts of interest: None of the authors has conflicts of interest. Authors’ contributions: M.C.A. contributed to the analysis and interpretation of the data and the drafting of the manuscript; E.V.J. contributed to the analysis and interpretation of the data; W.L.J. contributed to the interpretation of the data; R.S. contributed to the design of the study, analysis and interpretation of the data and the drafting of the manuscript. All authors read and approved the final manuscript.


