


Malnutrition is still a silent emergency in the 21st century. Undernutrition is related to an inadequate intake of nutrients, which results in weight loss and growth faltering, reflected as underweight, wasting and/or stuntingReference Huffman, Steel, Pinstrup-Anderson, Pelletier and Alderman1. A child's growth is the most important indicator of health, which is influenced and measured by adequate intakes of food and nutrients and a decreased susceptibility to disease. Height and weight measurements are used as determinants of normal child growth. The UNICEF Conceptual Framework2 for Nutrition indicates that inadequate dietary intake results in growth failure, a condition referred to as chronic malnutrition or stunting. The consequence of this would be poor physical, mental and social development of the child, leading to chronic ill health, low productivity and less opportunity for educational growth3.
Poverty is related to chronic hunger, which is more widespread than acute hunger caused by famine4. In the past, undernutrition was the major concern with respect to the poor, who were largely rural. The present concern is that undernutrition as a disease migrates along with the substantial numbers of the poor who come to live in the citiesReference Ruz and Solomons5.
When measured according to weight-for-age, an estimated 150 million children under the age of 5 years are malnourished. It is estimated that globally 50 million children have wasting. This condition, where both the weight and height are low for the age of the child, is the subsequent result of reduced dietary intake, illness or both6. It is estimated that stunting is far more prevalent and that 182 million children are stunted due to chronic lack of food6.
Eastern Africa has the highest stunting rates at 48%, with Africa following at 39% and South Africa at 24%Reference de Onis and Blossner7. Malnutrition rates have increased in Africa. An upward trend in Kenya was confirmed, and it is predicted that the absolute numbers of malnourished children in sub-Saharan Africa will be higher in 2020 than they were in 1995Reference de Onis and Blossner7–Reference Smith and Haddad9.
The South African Vitamin A Consultative Group (SAVACG)10 found in a study of 11 000 South African children aged 6–71 months that the level of stunting in Gauteng was 11.5% and in the Limpopo Province 34%. Their study indicated that one in four children (23%) were stunted in South Africa and one in 10 were underweight. Stunting thus is a major problem in South Africa and, according to the SAVACG study10, was more prevalent in the rural than the urban communities and among children living in traditional or informal types of housing and those whose mothers were less well educated. This means that because of long-term malnutrition, ~660 000 pre-school children were identifiably malnourished and 1 520 000 were stunted. The children most at risk were those between the ages of 12 and 24 months.
The National Food Consumption Survey (NFCS)Reference Labadarios, Steyn, Maunder, Macintyre, Swart and Gericke11 reported similarly that more than one in five children in South Africa was stunted. Children aged 1–3 years were most severely affected and in particular those that lived in the rural areas and on commercial farms.
Methods
Study area
The research team purposefully selected two informal settlements in urban Gauteng and two villages in the Limpopo Province in order to compare urban and rural data.
The geographical areas for the present study were the informal settlements of Concern and Phomolong in urban Gauteng, and two villages, Sekuruwe and Molekane, in the Limpopo Province. The people in these areas were poor, the unemployment rate was high and the lack of services and infrastructure could have had an impact on and contributed to chronic malnutrition among young children.
Design and subject selection
The project was presented to the Directorate Mother and Child Health and Nutrition and the Subdirectorate: Nutrition of the Gauteng Department of Health in Gauteng and to the Limpopo Department of Health and Welfare: Subdirectorate Nutrition in order to obtain ethical permission. At the beginning of each interview, the objectives of the study were explained to the mother/caregiver (m/c) and they were informed that participation was voluntary.
The areas were visited on several occasions and the research team met with all the stakeholders and local organisations and clinics in both areas. The study was explained to the community leaders and the community was informed publicly during mass meetings, and agreement was reached to proceed with the survey in the two provinces.
A sociodemographic and anthropometric questionnaire was compiled by the NutriGro team in order to identify stunted and non-stunted children and to collect socio-demographic information on the children and mothers living in the informal settlements and the rural areas.
The researchers initially set out to select 40 stunted children in both areas. In urban Gauteng, 68, and in the Northern Province only 30 children were identified as being stunted with less than − 2 Z-scores, which indicated that they were stunted according to height-for-age. In order to keep the sample sizes in both areas similar, 40 children with Z-scores of − 2 and lower were selected from the urban stunted sample. They represented children from each age group ranging from 12 to 24 months. These children and their households were pair-matched as closely as possible with 40 children, categorised as non-stunted, with each pair living in the same area. The final sample size in the urban area was 74. There were 37 in both the stunted and non-stunted groups of children. This final sample size was due to the death of one child and the fact two children moved from the area during the study. The 30 stunted children in the rural area were similarly matched to 30 non-stunted children from the same area. The final sample size was 58 in the rural area. There were 29 children in both the stunted and non-stunted groups of children. This was also the result of the death of one child and one child that moved from the area during the study. The criteria used for pair matching were:
● Gender of the head of the household and the relationship to the child.
● Age and educational level of the mother.
● Number of people in the household.
● Total income of the household.
● Gender of the child.
● Age of the child.
In-depth case studies were conducted regarding the dietary intake of the children and m/cs in both areas.
Dietary assessment method
An interview was conducted in both areas on each household, using a standardised quantitative food-frequency questionnaire (QFFQ) to measure dietary intakes of both children and m/cs. Details were obtained on how often children were fed certain foods, the portions commonly consumed and the frequency of feeding, the use of home-prepared complementary foods and the use of indigenous foods. The research team gained permission to use a standardised QFFQ along with a standardised food portion photograph book (FPPB). The QFFQ was designed and standardised by MacIntyreReference Macintyre12 in 1998 for the Transition, Health and Urbanisation in South Africa (THUSA) study in the North West Province. This study recorded dietary intake of the African adult population. In the present study, the primary concern was the food intake of the young child, and therefore the questionnaire was adapted to include the dietary intake of the young child. Extra columns were included in the questionnaire to facilitate the documentation of the young child's dietary intake together with the dietary intake of the m/c on the same questionnaire. Specific food items such as baby cereal, baby food and young child formula were included. The researchers made sure that culture-specific food items of the specific study population were also included.
The FPPB consisted of A4 size colour photographs of the most frequently consumed foods among the African populationReference Macintyre12. Portion sizes were small, medium or large, and also indicated the weight in grams.
The enumerators also made use of a brand name picture book (BNPB), containing pictures and actual food labels of various foods. Actual food containers of the most often consumed food items in the area were also used. Yuhas et al. Reference Yuhas, Bolland and Bolland13 also found this method very helpful as a means of training subjects to quantify amounts of food more accurately. The adapted QFFQ was tested three times on 20 mothers with babies from the same areas, but who were not included in the study.
A training manual was adapted to include questions on the dietary intake of the young childReference Macintyre12. During a 2-day workshop in Pretoria, four enumerators, two urban and two rural, were trained. They were trained in using the QFFQ, FPPB and the BNPB, which ensured a standardised method to be used in both areas.
The fieldwork for the dietary case study was performed during November 1998. A minimum of four mothers per day was interviewed. The researcher met with the enumerators on a daily basis upon completion of the day's work. The questionnaires were checked to ensure that all the questions were answered, and if there were any queries the enumerators could immediately go back to clarify these with the mother.
Data analysis
Dietary data were coded and analysed by the Food Finder Dietary Analysis program (South African Medical Research Council, 1992). The amounts and frequency of foods consumed were analysed using programs developed for previous dietary studiesReference Macintyre12.
Statistical analyses were done on the dietary intakes of the young child and the m/c for both the urban and rural stunted and non-stunted groups. Intakes of the macronutrients fat, protein, carbohydrate and energy were determined. The micronutrient analyses were for thiamine, niacin, riboflavin, vitamin A, vitamin C, calcium and iron. The adequacy of the diet was compared with the recommended dietary allowance (RDA), and those values falling below 67% of the RDA for energy and micronutrients were determined. The percentage contributions of macro- and micronutrients to energy were determined. The 30 most often consumed food items for the urban and rural areas, for the children and m/cs, were compared with each other.
It was assumed that all the children still received breast milk. Breast milk intake was not measured in the present study, but a method described by Hautvast et al. was used to calculate the mean and percentage contribution of breast milk to the diet of all the childrenReference Hautvast, van der Heijden, Luneta, Van Staveren, Tolboom and Van Gastel14.
The mean intakes of energy, protein, carbohydrates and fat derived from complementary food were calculated for both the stunted and non-stunted urban and rural children. The total protein intake was subdivided into animal and plant protein.
Results
Sample description
The age distribution of the stunted and non-stunted children in both urban and rural areas is given in Table 1. The mean ages of the urban stunted and non-stunted children were 18.5 and 17.5 months, respectively, and of the rural stunted and non-stunted children 20.1 and 19.2 months, respectively. This shows that the children in the rural area were slightly older than the urban children.
Table 1 Age distribution of urban (n=74) and rural (n=58) stunted and non-stunted children

SD – standard deviation.
Anthropometric information
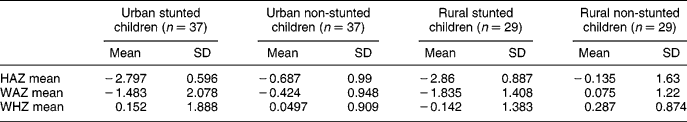
Anthropometric measurements were performed on both groups after the completion of a sociodemographic questionnaire. The results are presented in Table 2. The mean height-for-age Z-score in both urban and rural stunted children was − 2.8, which indicates stunting. The mean for the urban and rural non-stunted children shows a shift to the left of the median value of the reference population. In this study, the mean of the National Center for Health Statistics reference population Z-scores less than − 2 was used to determine stunting, and Z-scores of − 2 or more were regarded as normal. The mean weight-for-age for the stunted children in the urban and rural areas was below a Z-score of − 1 which indicates underweight. In the urban non-stunted group, the weight-for-age Z-score was − 0.424, which shows that this group was slightly underweight.
Table 2 Anthropometric information of urban (n=74) and rural (n=58) non-stunted and stunted children
HAZ – height-for-age Z-score; WAZ – weight-for-age Z-score; WHZ – weight-for-height Z-score; SD – standard deviation.
Energy and macronutrient intakes
The dietary intake regarding energy and macronurients from the urban and rural study populations are shown in Table 3. None of the differences between the mean intakes of the stunted and non-stunted groups in both areas was statistically significant (P>0.05).
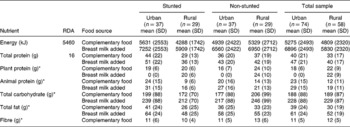
Table 3 Mean and standard deviation of energy and macronutrient intakes of urban stunted and non-stunted children (n=74: age 12–24 months) and of rural stunted and non-stunted children (n=58: age 12–24 months), derived from complementary food intake and with breast milk intake added
SD – standard deviation; RDA – recommended dietary allowance.
* No RDA.
The mean energy intake of the rural stunted children from complementary food was slightly lower than that of the urban stunted children. The energy intake from complementary food of the urban non-stunted children was also higher than that of the rural non-stunted children. With breast milk added, energy intake increased by 1621 kJ day− 1 for all groups of children.
Protein
Table 3 shows that both the urban and rural groups had a total protein intake well above the RDA of 16 g day− 1. The rural stunted children had a lower total intake, 29 g, than the urban stunted children, 44 g.
In the urban area, the animal protein intakes for both the stunted and non-stunted groups were high, 24 and 20 g day− 1, respectively, when compared with the RDA for total protein intake. The sources of animal protein were mainly eggs, boiled chicken and chicken feet.
The animal protein sources most often consumed in the rural area were fried egg followed by canned pilchards. The addition of breast milk increased the mean animal protein intake by 7 g in both groups, in both areas. Besides maize meal, the main plant protein sources were soya products in the urban area and canned beans in the rural area.
The urban stunted children had adequate protein intakes when compared with the rural stunted children. There was no significant difference in the mean protein intakes of the urban and rural stunted and non-stunted children. MacKeown et al. Reference Mackeown, Cleaton-Jones, Granath, Richardson and Sinwel15 found that the total amount of protein consumed ranged from 0.6% for rural blacks to 1.2% for urban blacks, which was higher than for urban whites, and this indicated a shift in the consumption of animal protein.
Carbohydrates
There is no RDA for carbohydrates, but from the literature it is clear that most of a person's energy must be derived from complex carbohydrates. An intake of at least 50–100 g of carbohydrates per day is needed in the diet to prevent ketosisReference Roberts16. Table 3 indicates that the urban stunted group consumed a mean of 199 g day− 1 in comparison with a lower mean intake of 172 g day− 1 by the rural stunted group.
The mean carbohydrate intake of the urban group was less than that of the rural group but, with the addition of breast milk, intakes of both groups increased by 40 g day− 1. These intakes were high considering that the children were younger than 2 years of age. The main source of carbohydrates was maize porridge, sugar from cold drinks and bread.
Fat
The fat in the diet of both the urban and rural groups was derived from added fat, from complementary foods, during cooking and fat in meat and dairy products.
Table 3 shows that the mean fat intake from complementary food of the rural stunted children was considerably less than that of the urban stunted children. The addition of breast milk increased the mean fat intake by 22 g. The rural non-stunted and urban non-stunted children had very similar fat intakes.
Macronutrient contribution to energy
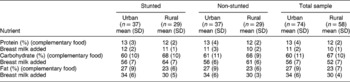
Table 4 shows the percentage contribution of the macronutrients to total energy for the urban and rural groups. There were no significant differences (P>0.05) in the percentage contribution to total energy of any of the macronutrient intakes of the urban and rural stunted and non-stunted children. The percentage energy contribution from protein and carbohydrate did not increase with the addition of breast milk. The energy contribution from fat in breast milk was 7%.
Table 4 Macronutrient intake as a percentage contribution to total energy intake for urban (n=74) and rural (n=58) stunted and non-stunted children
SD – standard deviation.
Micronutrients
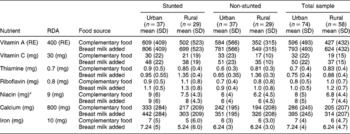
Vitamins A, C and B complex were selected for analysis because of their vital role in resisting infections and promoting growth in children. The mean intakes of the micronutrients vitamin A, C and B complex for the urban and rural groups are shown in Table 5. The micronutrient contribution from complementary food is shown together with the values for breast milk added.
Table 5 Mean and standard deviation of micronutrient intakes of urban stunted and non-stunted children (n=74: age 12–24 months) and of rural stunted and non-stunted children (n=58: age 12–24 months), derived from complementary food intake and with breast milk intake added
RE – retinol equivalents; SD – standard deviation; RDA – recommended dietary allowance.
* No value for breast milk added.
The children in both areas consumed diets consisting mainly of unenriched maize flour and were at risk of deficiency of these vitamins.
Vitamin A
Table 5 clearly shows that both the urban stunted and non-stunted children had adequate mean intakes of vitamin A from complementary food and, with the addition of breast milk, it increased by ~200 retinol equivalents (RE) for both groups.
The rural non-stunted children had inadequate vitamin A intake but, with the addition of breast milk, it increased to sufficient levels. The stunted children had an adequate intake of vitamin A from complementary food, and breast milk increased their intake by 197 RE.
Vitamin C
In both urban groups, the mean vitamin C intake was adequate, 33 and 30 mg day− 1, respectively, as can be seen in Table 5. With the inclusion of breast milk, both groups had intakes above the RDA. The mean vitamin C intake of the urban groups met the RDA, and breast milk increased the values by 18 mg. The mean vitamin C intakes of the rural groups were below the RDA, and breast milk increased the values to just above the RDA.
Thiamine
The urban and rural stunted children had mean thiamine intakes slightly higher than the RDA of 0.7 mg. The non-stunted urban children had inadequate mean intakes and the non-stunted rural children had intakes higher than the rural stunted children. The addition of breast milk increased the values for all the children by 0.05 mg.
Riboflavin
The mean riboflavin contribution to the diet of the urban stunted children from complementary food was sufficient, but for the urban non-stunted children it was 1 mg day− 1 less than the RDA. With the addition of breast milk, mean intakes of riboflavin increased to above the RDA.
The rural stunted children had a mean intake similar to the RDA and the mean intakes of the non-stunted children were more than the RDA. The addition of breast milk increased the mean intake of all groups by 0.02 mg.
Niacin
The urban stunted children had a mean niacin intake of 9 mg day− 1, in comparison with that of the non-stunted children of 6 mg day− 1, which put them at risk of niacin deficiency. The rural stunted and non-stunted children had inadequate mean intakes of niacin of 7.5 and 6.2 mg day− 1, respectively. Both groups were at risk of deficiency. There are no data for the estimation of niacin contribution from breast milk.
Minerals
Calcium
The RDA for calcium for a child between 1 and 3 years of age is 800 mg day− 1 according to Wardlaw and InselReference Wardlaw and Insel17. Both the urban stunted and non-stunted children had mean intakes far lower than the RDA, 333 and 242 mg day− 1, respectively. Their diet remained deficient of calcium after the addition of breast milk was calculated.
Both groups of children in the rural area had lower intakes than the urban children. Similar to the urban children, the addition of breast milk did not increase their levels to the RDA of 800 mg day− 1.
Iron
The urban stunted children had mean iron intakes of 7 mg day− 1, and the rural stunted children had an even lower mean intake of 6.3 mg day− 1, which is lower than the RDA of 10 mg day− 1. This was slightly higher than for the urban non-stunted children, but both groups are at risk of deficiency. The addition of breast milk made no difference to these values except for the urban stunted children whose iron intake increased by 1 mg day− 1.
There were no significant differences (P>0.05) in the mean intakes of micronutrients between both groups of urban and rural children.
Food intake of children
Information gathered by means of the FFQ enabled the researchers to determine the primary food items consumed by the urban and rural samples. In Tables 6 and 7 the 30 most often consumed food items are ranked, comparing the total amount per item for the stunted and non-stunted groups and the average consumption per person per day. Breast milk was not included in the presentation of the food intake results.
Table 6 Amounts of primary foods consumed by urban stunted and non-stunted children (n=74)
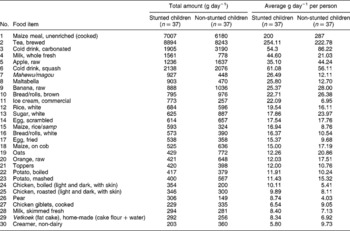
Table 7 Amounts of primary foods consumed by rural stunted and non-stunted children (n=58)
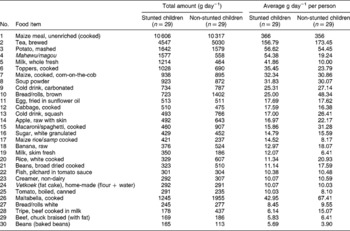
From Tables 6 and 7, it is very clear that the most consumed carbohydrate-rich food in both areas was maize meal. The consumption was much higher in the rural area, with average intakes of 366 g day− 1 for the stunted children and 356 g day− 1 for the non-stunted children. In the urban area, the stunted children consumed 200 g day− 1 and the non-stunted children 287 g day− 1.
Other sources of carbohydrates were brown/white bread, and home-made vetkoek (dumpling fried in oil), with higher intake of brown bread and vetkoek in the rural area. Maize rice or samp (a mixture of maize and beans) was consumed in both areas, and in the rural area both groups of children consumed macaroni or spaghetti, with a higher intake by the non-stunted children. In both areas, tea was the second most consumed food item, with higher consumption in the urban area. Both groups consumed large amounts of tea with sugar added. In the urban area, the children also consumed larger amounts of carbonated cold drinks and squash, which also added to their energy intake.
Fresh fruit consumed in the urban area were apples, bananas, oranges and pears, with higher intakes for the non-stunted group. In the rural area, they consumed apples and bananas, with the non-stunted children having a greater intake of fruit. In both areas, fruit was not consumed daily, but m/cs reported an intake once a week. Intakes were in very small amounts, ranging from an average of 12 to 25 g day− 1, which explains the overall low vitamin C intakes.
There was virtually no intake of vegetables in the urban area except for fresh maize and potatoes, boiled or mashed, with higher intakes among the non-stunted children. In the rural area, potatoes and cabbage were the only fresh vegetables consumed, and tinned tomatoes were added to the list.
In both areas, eggs were the first animal protein on the list. In the urban area, scrambled egg was the 14th most consumed food item and fried egg was at number 17 on the list, with similar intakes by both groups. In the rural area, fried egg was introduced as the 11th most consumed food item with similar intakes by both groups. The second most consumed protein source in the urban area was chicken, either boiled or roasted, and chicken giblets. This was, however, consumed in minimal amounts by both groups. In the rural area, chicken did not appear among the first 30 food items, but tinned fish (pilchards in tomato sauce) were consumed in equal amounts by both the stunted and non-stunted children. The 28th and 29th items on the rural list were tripe and beef that were consumed in minimal amounts by both groups of children.
Toppers, a soya product, were consumed by both groups in the urban area, which contributed plant protein to the diet. In the rural area, their consumption of plant protein was higher and included Toppers, dried beans and tinned beans.
Small amounts of milk, whole fresh and skimmed fresh, were consumed in both areas by all the children. The rural children had higher intakes of non-dairy creamer than the children in the urban area. It is clear that not all the children in both areas received cow's milk. Other dairy products such as cheese and yoghurt, which are expensive, were absent from the food lists. The urban children did consume commercial ice cream, but in very small amounts.
Discussion
Macronutrients
Energy intake
From Table 3 it is clear that the urban stunted children had adequate mean energy intakes from complementary food, slightly higher than the RDA. The rural stunted and urban and rural non-stunted children had mean intakes less than the RDA. With the addition of breast milk, mean energy intakes for all groups increased to exceed the RDA. The findings for the rural stunted children were similar to those of Hautvast et al. Reference Hautvast, van der Heijden, Luneta, Van Staveren, Tolboom and Van Gastel14 who observed that stunted children in Zambia tended to have lower mean energy intakes from complementary food than non-stunted children. Similar results were obtained by the NFCS, which indicated that Gauteng was one of three provinces with the highest mean energy intake for all age groups of children. In the Limpopo Province, one out of three children living in rural areas had a consistently and significantly lower energy intake than children living in urban areasReference Labadarios, Steyn, Maunder, Macintyre, Swart and Gericke11.
The findings from this study also compare favourably with results from other South African studies which reported that poorly nourished children often consume a diet similar in amounts of food to well-nourished children but that their mean energy intake is substantially lessReference Vorster, Oosthuizen, Jerling, Veldman and Burger18, Reference Huffman, Luann and Martin19.
In the present study, the reported mean total protein, plant protein and animal protein intakes for the urban and rural stunted and non-stunted children were adequate and even exceeded the RDA of 16 g day− 1, as can be seen in Table 3. This corresponds to results from the NFCSReference Labadarios, Steyn, Maunder, Macintyre, Swart and Gericke11, which indicated that protein intakes for children of all age groups and provinces were higher than the RDA. According to KleynhansReference Kleynhans20, households with non-stunted children spent more money monthly on protein foods than households with stunted children.
In the urban area, the non-stunted children consumed more maize meal porridge than the stunted children, a mean intake of 287 g day− 1, and in the rural area the non-stunted children had a lower mean intake of maize meal porridge. Vorster et al. Reference Vorster, Oosthuizen, Jerling, Veldman and Burger21 explained that a relatively greater carbohydrate intake among rural blacks, double that of the urban population in South Africa, illustrates the expected change in intake during urbanisation. Sugar intake in the urban area was higher than in the rural area. This is similar to the findings of the NFCSReference Labadarios, Steyn, Maunder, Macintyre, Swart and Gericke11.
The present study found that the contribution to total energy from carbohydrate was slightly higher (8%) for the rural stunted and (6%) for the rural non-stunted children, than the urban stunted and non-stunted children. This is similar to the findings of MacIntyreReference Macintyre12 of women in the North West Province. The carbohydrate intake as a percentage contribution to energy was >60% for all groups of children. Richardson et al. Reference Richardson, Sinwel and Rantsho22 reported a similar trend of carbohydrate consumption of 51–75% total energy among black schoolchildren.
Mean reported total fat intakes for both urban non-stunted and stunted children were higher than the range reported by Vorster et al. Reference Vorster, Oosthuizen, Jerling, Veldman and Burger18. The mean fat intakes in the urban area were high, 41 g day− 1 for urban stunted children and 36 g day− 1 for urban non-stunted children, compared with the rural area with mean intakes of 26 g day− 1 for the rural stunted and 33 g day− 1 for the non-stunted children. This trend was similar to the findings of MacintyreReference Macintyre12 in the THUSA study on women in the North West Province. When breast milk was added to the diet of the children in the present study, mean fat intakes increased on average with 22 g day− 1 for both rural and urban subjects. Fat intake contributed 27% to total energy for both stunted and non-stunted children in the urban area. This is 4% more than for both rural groups who received 23% energy from fat. This agrees with the trend, described by WalkerReference Walker23, that fat intakes increase with urbanisation.
Micronutrient intake
Vitamin A
Table 5 shows that the rural non-stunted children had a mean vitamin A intake less than the RDA of 400 RE. The other groups of children had mean intakes exceeding the RDA. MacIntyreReference Macintyre12 also found that the vitamin A intake of the urban population was higher than that of the rural population. This contradicts the report from Vorster et al. Reference Vorster, Oosthuizen, Jerling, Veldman and Burger18 that vitamin A intakes in the rural area were higher than in the urban area.
When breast milk is added, the mean vitamin A contribution increased by 49% for both groups. This is similar to findings reported by Huffman et al. Reference Huffman, Luann and Martin19 and MahalanabisReference Mahalanabis24 that breast milk is an important source of vitamin A in the diet of children in developing countries, where the diet often lacks both variety and animal products.
Vitamin C
Both urban groups had mean vitamin C intakes consistent with the RDA, and the addition of breast milk slightly increased the intake of both groups, with 17 mg day− 1 for the stunted and 18 mg day− 1 for the non-stunted children. Both groups of rural children had a mean vitamin C intake below the RDA, but with the addition of breast milk it increased to meet the RDA. Both the urban and the rural children were at risk of vitamin C deficiency. Upon examining the foods consumed by the children in both areas, it is clear that their diet was deficient in vitamin C-rich foods and especially fruit and vegetables, which are expensive items.
B complex vitamins
The urban non-stunted children had mean thiamine and riboflavin intakes less than the RDA. The urban stunted and rural stunted and non-stunted children had mean thiamine and riboflavin intakes above the RDA. The mean niacin intake of the urban stunted children was similar to the RDA. The rural stunted children had mean niacin intakes less than the RDA, and the urban and rural non-stunted children had mean niacin intakes which put them at risk of deficiency. The NFCSReference Labadarios, Steyn, Maunder, Macintyre, Swart and Gericke11 study found that nearly one out of four children had intakes of < 50% the RDA.
Hautvast et al. Reference Hautvast, van der Heijden, Luneta, Van Staveren, Tolboom and Van Gastel14 explained that linear growth retardation is not caused by one single micronutrient, but that poor quality diets supply insufficient amounts of multiple micronutrients. The low niacin intakes of some of the children in the urban and rural areas could be attributed to the fact that they consumed mainly maize meal porridge, which was prepared from unenriched maize meal. Their intakes of animal protein were also very low, which could further explain their low niacin status. At the time of the study, enriched maize meal was available in South Africa, but it was more expensive than unenriched maize meal and therefore not purchased.
Calcium
It is clear that the mean calcium intakes of both groups of children in the urban and rural areas were less than the RDA of 800 mg. The addition of breast milk did not increase the values sufficiently to meet the RDA. Both the urban and rural children are at risk of deficiency.
Low milk intakes among Africans are common, and reasons could be influenced by previous cultural habits and the prevalence of lactose intolerance. Lactose intolerance is very common among, for example, blacks and Hispanics, and therefore soured milk has become an integral part of their culture. The high cost of milk and dairy products make these items a commodity which cannot be afforded by the very poorReference Vorster, Oosthuizen, Jerling, Veldman and Burger21, Reference Bourne, Langenhoven, Steyn, Jooste, Nesamvuni and Laubscher25.
Results from the NFCSReference Labadarios, Steyn, Maunder, Macintyre, Swart and Gericke11 study indicated that at national level, one out of two and three out of four children had, respectively, an intake of less than half and less than two-thirds of the recommended intake of calcium.
Iron
It was found in the SAVACG10 study that in South Africa one child in five was anaemic, one in 15 moderately anaemic and one in 500 severely anaemic. One in 10 children was iron-depleted or deficient, one in 20 was severely iron-depleted or deficient and one in 20 had iron-deficiency anaemia. The prevalence of anaemia and poor iron status was highest in the urban areas. This can lead to reduced stamina, stunting and learning problems.
The present study found that in both the urban and rural areas, the children from the stunted and non-stunted groups had mean iron intakes less than the RDA of 10 mg. These values did not increase to adequate levels with the addition of breast milk. It is clear from this that all the children in both areas were at risk of iron deficiency.
Ruz and SolomonsReference Ruz and Solomons5 found that in Southeast Asia in poor sectors of urban populations, iron deficiency seems to be a constant, in contrast to the variability of other micronutrients. Vorster et al. Reference Vorster, Oosthuizen, Jerling, Veldman and Burger21 reported that South African urban black young children were a vulnerable group, with mean iron intakes below 67% of the RDA.
The NFCS studyReference Labadarios, Steyn, Maunder, Macintyre, Swart and Gericke11 found that children living in urban areas had significantly higher intakes of iron than children living in rural areas, which was not the case for the NutriGro study. There is an apparent move away from the traditional diet, which presents particularly great challenges to nutrition educators.
The low mean intakes of calcium and iron places both groups at risk of deficiency, and this finding is confirmed by MacIntyreReference Macintyre12 and other studies on the South African populationReference Vorster, Oosthuizen, Jerling, Veldman and Burger18, Reference Walker23, Reference Langenhoven, Steyn, Van Eck and Gouws26.
It is clear from the results that the stunted and non-stunted children in both areas had similar mean dietary intakes (see Table 6 and 7). In both the urban and rural areas, insufficient dairy products, fruit and vegetables were consumed. The low calcium and iron intakes of all the children in both areas resulted from the overall low intakes of dairy products and animal protein.
Poverty appeared to be the main cause of inadequate dietary intake in both areasReference Roberts16. The people do not have enough money to purchase fruit, vegetables and milk. It is therefore important to train the community to understand the nutrition message through nutrition educational programmes. According to the Food and Agriculture Organization of the United Nations27, the allocation of women's time and knowledge are two less directly food-linked factors which may have significant nutritional effects through changes in breast-feeding, childcare, and health and sanitation factors.
Emphasis on the more directly food-linked factors such as the quantity and quality of the diet, its variety and composition can determine nutritional well-being. This includes the availability of animal products, such as liver and offal, which are iron-rich, and other micronutrient-rich and energy-dense foods.
There is limited but sufficient land available to the urban and rural people to grow vegetables for their own use and to sell, which in turn would enable them to buy animal protein and dairy products. In a case study conducted by Khosa et al. 28 in the rural area, it was found that if households made use of a drum and drip micro-irrigation system, using grey water from their households, they could produce vegetables for household consumption to alleviate dietary inadequacies. The amount of vegetables harvested were weighed and documented. The results showed that substantial amounts of vegetables were harvested. On average, 65% of these vegetables were consumed by the households and 35% used as gifts. Maswikaneng et al. Reference Maswikaneng, van Averbeke, Bohringer and Albertse29 conducted a case study on urban farming in the urban informal settlement areas. Water, available from standpipes, carried in buckets or tins, was used for irrigation. It was found that farming in home gardens was more important than community gardens. The quantities produced provided enough for home consumption, but there was no surplus for selling.
Conclusion
It is thus clear from this study that diet is not the only the cause of stunting, but the causes are multifactorial. In South Africa, the health status of children is in jeopardy due to rapid urbanisation, which has led to the creation of informal shack settlements on the outskirts of cities. Factors such as poverty, overcrowding and the possible contamination of food can have an impact on the health status of childrenReference Kleynhans20. It is necessary to monitor these situations and formulate appropriate intervention strategies. In South Africa, the immediate and underlying causes of malnutrition are reflected by the basic economic and socio-political inequalities in the country as portrayed by the UNICEF2 conceptual framework for nutrition. Increased access to basic services such as primary health care, clean water, sanitation and education must be prioritised and the eradication of poverty must be the main focus. Three M-Tech students are already working on separate projects to determine the prevalence of parasite infestation, to determine the purity of water and to measure food contamination. Poor food quality rather than actual lack of food are the cause of malnutrition in young South African children and can be eradicated by functional nutritional educationReference Kleynhans20.
It is therefore important to educate especially the women on the type of vegetables to plant, for example vegetables rich in vitamin A and C, calcium and iron. In the Limpopo Province, a needs assessment was carried out and the development of vegetable gardens is now in progress, and this will be repeated in the urban area. Attention should also be given to the mode of processing and preparing of food, the frequency of feeding and, for young children, the duration of breast-feeding.
Negotiations with government for the administration of vitamin A supplements to women and children will be a short-term solution to the eradication of vitamin A deficiency. In the long term, the option of food-based intervention and food fortification must be explored in more depth in order for the community to become active in solving their dietary problems. The fortification of maize meal and bread flour is now mandatory in South Africa since 2003.
Bourne et al. Reference Bourne, Langenhoven, Steyn, Jooste, Nesamvuni and Laubscher25 suggested that other activities, such as skills development, home gardens and women's health groups, should be linked to nutritional support strategies.
Acknowledgements
The National Research Foundation (NRF) and Technikon Pretoria are thanked for co-funding the project.


