


Approximately 26 million adults in the USA have been diagnosed with diabetes, about 90–95 % of whom have type 2 diabetes mellitus (T2DM)( 1 ). T2DM is a chronic disease that is characterized by high levels of blood glucose (fasting >126 mg/dl and/or postprandial >200 mg/dl). Impaired glucose tolerance (IGT; 2 h postprandial blood glucose between 140 and 199 mg/dl, but fasting glucose <126 mg/dl) and impaired fasting glucose (IFG; fasting glucose between 100 and 126 mg/dl) are prediabetic conditions( 2 ). The transition from IFG and IGT to overt T2DM appears to be relative to other confounding factors, with 25 % progressing, while another 50 % remain in the impaired glycaemic state and the remaining 25 % revert back to normoglycaemic conditions( Reference Shaw, Zimmet and de Courten 3 , Reference Stern, Williams and Haffner 4 ). Having both prediabetic conditions (IFG and IGT) puts a person at higher risk than having just one of the two( Reference Bergman 5 , Reference Ferrannini, Gastaldelli and Iozzo 6 ). Further, the dietary modifications required to manage one v. both may be quite different, based on their pathophysiology. IFG is characterized by basal and first-phase glucose-induced insulin response loss, but without differences in second-phase insulin release or insulin resistance( Reference Simmons, Echouffo-Tcheugui and Griffin 7 ). IGT, on the other hand, is associated with defects in oral glucose-induced insulin response, but an even stronger deficit in late-phase insulin secretion, and reduced hepatic as well as skeletal muscle insulin resistance( Reference Simmons, Echouffo-Tcheugui and Griffin 7 ). Since insulin resistance is closely associated with dietary fat intake( Reference Riccardi, Giacco and Rivellese 8 ), dietary risk factors contributing to isolated IFG (only one prediabetic condition) v. both IFG and IGT (two prediabetic conditions) could be different from one another, as well as from those of T2DM. Furthermore, reversing isolated IFG or IFG with IGT from progressing to T2DM may be influenced by dietary factors differently and can be effectively handled if they are better understood.
Diet composition, especially dietary fat intake, is associated with T2DM onset or incidence( Reference Himsworth 9 , Reference Rahati, Shahraki and Arjomand 10 ). High intake of SFA has been associated with increased risk of T2DM( Reference Lazarou, Panagiotakos and Matalas 11 ), as well as higher plasma and tissue SFA with increased risk of developing T2DM( Reference Laaksonen, Lakka and Lakka 12 ). MUFA, on the other hand, have been shown to be protective against IGT( Reference Paniagua, de la Sacristana and Sanchez 13 ). Dietary PUFA, especially long-chain n-3 PUFA from fish and other seafood, have shown conflicting evidence. While some studies show a beneficial effect( Reference Zheng, Huang and Yang 14 ) or no associations( Reference Patel, Forouhi and Kuijsten 15 ), surprisingly some others have shown an increase in risk for T2DM associated with high PUFA, including n-3 fatty acid consumption( Reference Djousse, Gaziano and Buring 16 ). When considering the relationship of dietary fatty acid composition with glucose tolerance and fasting glucose, MUFA, especially from plant sources, appears to be the most metabolically beneficial, followed by PUFA, while SFA is positively associated with poor glycaemic control and insulin resistance( Reference Krishnan and Cooper 17 ).
Several epidemiological studies have already focused on risk factors for T2DM, especially so with SFA( Reference Marshall and Bessesen 18 – Reference van Dam, Willett and Rimm 20 ); however, dietary risk factors for isolated IFG and IFG with IGT are not well established. Dietary fat has been implicated in IGT transition to T2DM( Reference Marshall, Hoag and Shetterly 21 ), but only amount and not composition has been studied( Reference Edelstein, Knowler and Bain 22 ). It is generally assumed that risk factors for T2DM are also applicable for these prediabetic states as well. Our primary aim was to determine the longitudinal relationship between dietary fatty acid composition, namely SFA, MUFA and PUFA (including n-3 and n-6 fatty acid) intakes, and risk of developing isolated IFG or IFG with IGT. We tested the overall null hypothesis that dietary risk factors for isolated IFG and IFG with IGT are the same as those for T2DM, namely high SFA, low PUFA and low n-3. We hypothesized that higher SFA intake may be related to increased risk, while MUFA would be inversely related. We also hypothesized that PUFA, specifically n-3 fatty acids, would be associated with decreased risk in middle-aged men and women enrolled in the Atherosclerosis Risk in Communities (ARIC) study.
Research design and methods
Study population
Data from the ARIC study for the present report were obtained from BioLINCC, the National Institute of Health’s Biological Specimen and Data Repositories Information Coordinating Center for population-based studies. ARIC is an ongoing prospective epidemiological study that started in 1987, aiming to investigate the aetiology, history and medical care of atherosclerosis. The original study included a cohort and a community surveillance component; the data for the present paper are from the cohort component. Four different states in the USA – including Forsythe County, North Carolina; Jackson, Mississippi; western suburbs of Minneapolis, Minnesota; and Washington County, Maryland – participated in the study, with approximately 4000 African-American or White adult men and women from each of the four communities. Eligibility criteria for study subjects included being between 45 and 64 years of age, able and willing to complete all study visits, living within selected areas and not planning on moving in the next decade. Data collection occurred at four visits: at visit 1 (V1) between 1987 and 1989; visit 2 (V2) between 1990 and 1992; visit 3 (V3) between 1993 and 1995; and visit 4 (V4) between 1996 and 1998. More information about the ARIC study design, recruitment and participants is found elsewhere( 23 ). Briefly, multiple communities in the four study sites listed were chosen based on geographic and ethnic balance, based on probability sampling, to include age-eligible individuals confirmed by government-issued photo identification cards. A home interview discussing CVD risk factors, socio-economic factors and family medical history was administered to each cohort member to identify the volunteer. Interested, eligible volunteers were then requested to come in to their local clinic to obtain consent, baseline information and enrol them into the study. The clinic visit included anthropometry, venepuncture to obtain fasting blood, interview questionnaires about CVD risk, pulmonary function examinations, electrocardiograms and ultrasound of the heart. After the clinic visit, follow-up telephone calls happened each year and follow-up examinations happened during the three-year visits. In addition to this, community surveillance procedures monitored medical events in study participants. The community surveillance was established to monitor rates for hospitalized cardiovascular events, including deaths. This information was then appended to the ARIC cohort database, if the event was for a cohort participant.
Exclusion criteria
A total of 15 792 individuals enrolled into the study, but only 14 693 had reported diet at baseline. Since our primary outcome is IFG, observations with IFG at V1 (≥100 mg/dl but less than 125 mg/dl; n 5359) and/or a diagnosis of type 1 or 2 diabetes at V1 (fasting >126 mg/dl and/or postprandial >200 mg/dl; n 1808) at V1 were excluded. It is important to note that this constitutes ~46 % of our original data set (n 14 693). Of the remaining 7526, those whose reported total daily energy intake was <1883 kJ (<450 kcal) or 14 644 kJ (>3500 kcal) were considered implausible reporter outliers, and removed from analyses( Reference Hu, Stampfer and Manson 24 ). We found 153 such reports that were eliminated from analyses.
Measurements
Study participants arrived at their field centre in the fasted state for a blood draw to measure glucose, insulin, total cholesterol, LDL cholesterol, HDL cholesterol and TAG. Fasting blood glucose was measured during V1, V2, V3 and V4, which was used to estimate IFG status at each of these visits. In addition, demographic and lifestyle information was collected using standardized procedures and questionnaires administered by trained observers. Dietary intake was assessed at V1 and V3 by a sixty-six-item modified semi-quantitative FFQ( Reference Willett, Sampson and Stampfer 25 ). This questionnaire has been validated( Reference Willett, Sampson and Browne 26 ) and has been successfully used to evaluate risk of T2DM( Reference Salmeron, Hu and Manson 27 ). Also, since the study focuses on dietary fat, it is important to note that the FFQ specifically asks for table, cooking and baking fats, as well as differentiates between dark fish and non-fatty fish( Reference Willett, Sampson and Browne 26 ). Anthropometrics were measured, including height using a stadiometer (to the nearest centimetre) and weight on a Tanita scale (to the nearest kilogram). General health information was queried, including status of hypertension, dyslipidaemia, diabetes or other chronic diseases, and if medication was taken. At baseline (V1) and V3 the Baecke questionnaire( Reference Baecke, Burema and Frijters 28 ) was administered to obtain physical activity habits.
Statistical analysis
R statistical software packages Rcmdr, Amelia, Mice and EZR were used for analyses. Baseline and V3 dietary data for all macronutrients and their sub-components were averaged to represent dietary intake, since two dietary measures reflects their dietary intake better than a single measure and because there is evidence to show that dietary intake patterns (ratio or proportions of nutrients in the diet) remain stable for up to 7 years( Reference Jankovic, Steppel and Kampman 29 , Reference Weismayer, Anderson and Wolk 30 ) (they were recorded 6 years apart in the ARIC study). If volunteers did not have dietary data at V3, just V1 diet was retained as their dietary exposure. Energy (in kilocalories) from SFA, MUFA, PUFA, n-3 and n-6 were converted to percentage of total daily energy intake. Since the diet analysis did not report n-6 (g) intake, we summed 18 : 2, 18 : 3, 20 : 4 and 22 : 5 that were part of the nutrient report to arrive at an n-6 PUFA category. These calculated percentages were used to generate tertiles of exposure to these fatty acids, which were in turn used to arrive at categorical variables for dietary exposure to of SFA, MUFA, PUFA, n-3 and n-6 fatty acids. Using the percentage of individual nutrients (fatty acids in this case) to total energy intake as dietary exposure variables is the classic way to generate ‘energy density models’ to adjust for total energy intake( Reference Willett, Howe and Kushi 31 ).
Cox proportional hazards regression models were used to evaluate the relationship between tertiles of exposure/intake for each fatty acid and risk of developing isolated IFG, or IFG with IGT, over 9 years of follow-up. Fasting plasma glucose values across all four visits were used to determine onset of incident IFG, and 2 h glucose at V4 was used for categorizing volunteers into IFG with IGT. Time-to-event variable was determined to be the number of days from baseline to the visit that the participant was first identified with IFG, isolated or otherwise. Because dairy products have SFA which have been inversely related to the development of T2DM( Reference Baecke, Burema and Frijters 28 ), we also controlled for dairy intake. We also chose to adjust for dairy intake in models evaluating exposure of MUFA, but not PUFA, n-3 or n-6, because dairy fat is rich in SFA (~69·4 %) and MUFA (~25 %) but is not a particularly rich source of PUFA or other long-chain fatty acids (~2·3 %)( Reference Mansson 32 ). Daily servings of dairy product intake was calculated (as an aggregate of non-skimmed milk, yoghurt, cheese, butter and other dairy-based desserts) and included in the statistical models. Regression models were adjusted by confounding factors as follows. Model 1 was adjusted for age, sex, race and study centre; model 2 was constructed with model 1 and in addition was adjusted for education, leisure-time physical activity, smoking and alcohol consumption; model 3 was built using model 2 as the base with additional adjustment for dairy intake. Model 4 and model 5 were further adjusted for BMI: model 4 used model 2 as baseline and further adjusted for BMI, while model 5 used model 3 as the base model with further adjustment for BMI. Dietary exposure tertiles were tested in the ARIC study population that developed isolated IFG, or developed IFG and had (or developed) IGT concurrently, to understand the dietary risk factors for these prediabetes conditions better.
Figure 1 depicts the study sample retention/exclusion criteria as well as imputation results. In order to understand the effect of missing data on our results, we used multiple imputation (Amelia package in R) to impute missing data at baseline. For V1, even though 15 792 volunteers were enrolled, only 14 693 had diet data reported and 755 of these did not have physical activity information. Since this was only 11 % missing data, we imputed and regenerated our initial data set (n 15 792). However, at V2, V3 and V4, 3262 dietary data and 6566 blood glucose data were missing. This is 42 % of the total n, which is beyond the imputations that have been reported thus far( Reference Crameri, von Wyl and Koemeda 33 – Reference Liu, Vanhooke and Frey 37 ). Multiple imputation has been attempted and used in epidemiological studies, especially in nutritional epidemiology with repeated measures of variables in longitudinal design( Reference Biering, Hjollund and Frydenberg 35 , Reference Twisk and de Vente 38 ). However, there were several computing complications that came to light while imputing such a high percentage of missing data (despite trying an alternative package, Mice, in R) similar to the ones reported before( Reference Young and Johnson 34 ) questioning its accuracy, as well as over-imputation concerns, as Young and Johnson pointed out. In addition, as Sterne et al. pointed out, several multiple imputation packages returned negative and implausible values upon imputation( Reference Sterne, White and Carlin 39 ). Considering all this, imputing longitudinal repeated-measures data appears very problematic and often inappropriate, especially in large data sets such as the ARIC study( Reference Crameri, von Wyl and Koemeda 33 ). Hence, we did not perform imputation on the data set that included data from all four visits, and performed it only on the V1 data set. This, when merged with the remaining visit data using ‘merge’ by subject ID in R, resulted in a final data set with n 5600. We used this ‘imputed’ data set to evaluate the sensitivity of our models to change in sample size. Further, in the original non-imputed data set we used just V1 diet (instead of an average of V1 and V3 as mentioned earlier) to evaluate risk for isolated IFG and for IFG and IGT. Taking into consideration the several concerns surrounding the multiple imputation process, we chose to use the imputed data set for the sensitivity analysis and not as the primary data set for results from the current study.
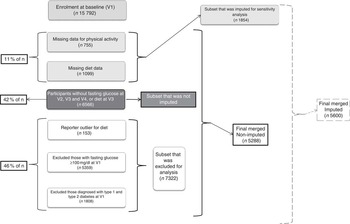
Fig. 1 Exclusions, missing data, imputations and resulting sample size for the current analysis from the Atherosclerosis Risk in Communities study population. Final non-imputed data set comprised n 5288 and imputed data set was n 5600 (V1, visit 1; V2, visit 2; V3, visit 3; V4, visit 4)
Results
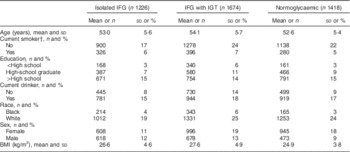
Of 5288 study participants, 1996 (38 %) were male and 3292 (62 %) were female. The study population was 84 % Caucasian (n 4433) and the remaining 16 % (n 855) were African American. Baseline characteristics are shown in Table 1 as means and standard deviations for continuous variables and as frequencies and percentages for categorical variables. Average age of study participants was 53·5 years and 50 % of the population was educated beyond high school. About 60 % of participants did not consume alcohol and 77 % were non-smokers. Average BMI was 26·2 kg/m2. By V4 (after 12 years), 1226 individuals had developed IFG, 1674 had both IFG and IGT (developed recently or had it from before), and 1418 individuals developed/had neither. The online supplementary material, Supplemental Table 1 presents baseline characteristics for all study volunteers (n 14 693).
Table 1 Baseline demographic characteristics of Atherosclerosis Risk in Communities study participants (n 5288) who had isolated impaired fasting glucose (IFG), IFG with impaired glucose tolerance (IGT), or were normoglycaemic by the fourth study visit
Dietary intake and physical activity indices as an average of both V1 and V3 are presented in Table 2. Average daily energy intake was 6026 kJ (1440·2 kcal), with 59 % of energy from carbohydrates, 22 % from fat and 20 % from protein. In addition to macronutrients, Table 2 also reports percentage of total daily energy from MUFA, PUFA and SFA intake, as well as grams of intake, across individuals grouped as having isolated IFG, IFG with IGT, or neither.
Table 2 Dietary intake and physical activity information for Atherosclerosis Risk in Communities study participants (n 5288) at visits 1 and 3, based on whether they developed impaired fasting glucose (IFG), impaired glucose tolerance (IGT), both or none at visit 4

Grams of macronutrients were adjusted for energy, age, sex and race using residual correction. Percentages of energy from macronutrients were adjusted for age, sex and race.
† Score from Baecke physical activity questionnaire.
We evaluated the relationship of dietary intake of SFA, MUFA, PUFA, n-6 and n-3 fatty acids with risk of incident isolated IFG in individuals who did not have or develop IGT using Cox proportional hazards regression models (Table 3). We did not observe a significant association between SFA and incident isolated IFG, irrespective of whether it was with or without lifestyle corrections (age, sex, race, education, physical activity, smoking, alcohol consumption or dairy intake). Dietary MUFA intake was not related to risk of incident isolated IFG when the models were not controlled for BMI or dairy intake; however, controlling for dairy intake (model 4) and for dairy intake and BMI (model 5) indicated a significantly reduced risk for onset of IFG by 10 % (both P=0·03) in tertile II, but not in tertile III (P=0·30 and 0·34 for model 4 and 5, respectively).
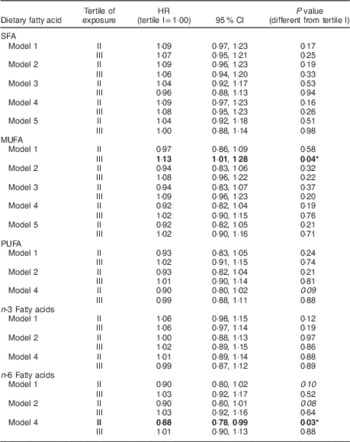
Table 3 Hazard ratios (HR) and 95 % confidence intervals for the relationships between percentage of energy from individual dietary fatty acid intakes and incident impaired fasting glucose, Atherosclerosis Risk in Communities study (n 5288)

Bold font and P value with ‘*’ indicate significantly different hazard ratio from tertile I of percentage of energy from individual fatty acid intake at P≤0·05. Italicized P value indicates a trend (P=0·05–0·10).
Model 1: adjusted for age, sex, race and study centre; model 2: model 1 plus adjusted for education, leisure-time physical activity, smoking and alcohol consumption; model 3: model 2 plus adjustment for dairy intake; model 4: model 2 plus adjustment for BMI; model 5: model 3 plus adjustment for BMI.
PUFA, n-6 and n-3 intakes were also evaluated similar to SFA and MUFA. However, we did not do a dairy intake adjustment for these three dietary parameters (described above in ‘Statistical analysis’ section). Neither PUFA nor n-6 intake was significantly related to the risk of incident isolated IFG, irrespective of whether it was adjusted for lifestyle factors, baseline BMI and dairy intake (both P>0·05). On the other hand, n-3 fatty acid intake was associated with a 10 % increased risk of incident isolated IFG (model 2, tertile III: hazard ratio (HR)=1·10; 95 % CI 1·00, 1·121; P=0·05), which changed after adjusting for other lifestyle factors (model 4: HR=1·08; 95 % CI 0·98, 1·18; P=0·12).
Similarly, we evaluated the relationship of dietary intake of SFA, MUFA, PUFA, n-3 and n-6 fatty acids with the risk of incident IFG in individuals who concurrently had or developed IGT by V4 (Table 4). Similar to the previous SFA model, we did not see a significant increase in hazard of incident non-isolated IFG with increasing intake of SFA (P>0·05). MUFA intake was found to be associated with an increased risk of incident non-isolated IFG when tested by itself (model 1, tertile III: HR=1·13; 95 % CI 1·01, 1·28; P=0·04), but this relationship disappeared once it was adjusted for lifestyle factors and BMI (P>0·05). PUFA showed a trend for a reduced hazard of incident non-isolated IFG (HR=0·90, P=0·09, tertile II), but not in tertile III, and this appeared only in the BMI-adjusted model, not in the base model. Unlike the isolated IFG model, n-3 fatty acids did not show a significant hazard association with incident non-isolated IFG. However, n-6 fatty acids showed a trend in models 1 and 2, which became significant in model 3 (which is adjusted for BMI and lifestyle parameters) with a reduced hazard for incident non-isolated IFG in tertile II (HR=0·88; 95 % CI 0·78, 0·99; P=0·03), but did not apply to tertile III of n-6 intake. There were no sex or race effects in any of the models we tested.
Table 4 Hazard ratios (HR) and 95 % confidence intervals for the relationships between percentage of energy from individual dietary fatty acid intakes and incident impaired fasting glucose with impaired glucose tolerance, Atherosclerosis Risk in Communities (n 5288)
Bold font and P value with ‘*’ indicate significantly different hazard ratio from tertile I of percentage of energy from individual fatty acid intake at P≤0·05. Italicized P value indicates a trend (P=0·05–0·10).
Model 1: adjusted for age, sex, race and study centre; model 2: model 1 plus adjusted for education, leisure-time physical activity, smoking and alcohol consumption; model 3: model 2 plus adjustment for dairy intake; model 4: model 2 plus adjustment for BMI; model 5: model 3 plus adjustment for BMI.
The online supplementary material, Supplemental Table 2 presents outputs from our sensitivity analysis using: (i) the imputed data set of n 5600; and (ii) just diet data from V1 instead of average V1+V3, with n 5288. With isolated IFG as the primary outcome, there was an 8 % reduction in hazard for isolated IFG with moderately high MUFA intake and a 10 % increased risk of isolated IFG with higher n-3 PUFA intake. When diet just at V1 was used, the MUFA risk remained and the n-3 PUFA exposure increasing IFG risk remained a trend. Similarly, when evaluating IFG and IGT risk using the imputed data set, the reduction in risk by 12 % with n-6 PUFA was only a trend; however, it was a significant 7 % reduction when evaluated using V1 diet alone. Overall, the summary of our results – with moderately high MUFA reducing isolated IFG risk, higher n-3 PUFA increasing isolated IFG risk, but n-6 PUFA reducing IFG and IGT risk – was retained following this sensitivity analysis.
Discussion
The primary findings of our longitudinal analysis revealed that dietary SFA, PUFA and n-6 intakes were not related to incident isolated IFG. Moderately higher MUFA intake (10–15 % of total daily energy) was related to a ~10 % reduction in hazard for incident isolated IFG, but not very high MUFA intakes, which is consistent with previous literature. The development of IFG, where IGT was also present, was associated with dietary n-6 fatty acid and PUFA intakes, but not with SFA, MUFA or n-3 fatty acid intake. Moderately high dietary n-6 intake (4–5 % of total daily energy) was associated with a ~12 % reduction in incident IFG with IGT, but higher intakes than that lost this benefit. Some other significant associations that were found with specific fatty acid intakes disappeared when adjusted for BMI, indicating that body weight and/or body fat percentage may override some potential positive or negative effects that fatty acids may have on IFG incidence.
In the current study we hypothesized that dietary SFA exposure would be a hazard for higher incidence of IFG; however, we did not observe a significant risk, irrespective of whether individuals were concurrently dysglycaemic or normoglycaemic in the postprandial state. The impact of dietary SFA intake on increased risk of T2DM is a more recent concept( Reference van Dam, Willett and Rimm 20 ) with support from animal studies pointing to change in membrane lipid composition as the mechanism behind this effect( Reference Lichtenstein and Schwab 40 ). Interestingly, a subset of the ARIC study participants (n 2909) were studied by Wang et al.( Reference Wang, Folsom and Zheng 41 ) evaluating the incidence of T2DM across quartiles of plasma SFA, MUFA and PUFA composition. They concluded that plasma SFA was positively associated with incidence of T2DM, after adjusting for BMI, sex and several other confounding variables. On the contrary, other epidemiological studies( Reference van Dam, Rimm and Willett 19 ) and experimental studies in human subjects( Reference Piers, Walker and Stoney 42 ) have questioned the impact of dietary SFA on T2DM or glucose intolerance. The current study suggests that similar to T2DM, dietary SFA may not be crucial in incident isolated IFG risk.
One interesting and somewhat surprising finding was the 10 % risk reduction of isolated IFG with moderately high MUFA intakes. Since IFG is not characterized by insulin resistance, and dietary MUFA is associated with improving insulin resistance( Reference Due, Larsen and Hermansen 43 ), it is surprising that dietary MUFA is associated with reduced risk of onset of IFG. However, this might be explained by improved fasting pro-insulin levels moderating fasting glucose levels as suggested by Paniagua et al.( Reference Paniagua, de la Sacristana and Sanchez 13 ). High-MUFA diets have also been found to improve glycaemic control, reduce insulin levels and improve overall glycaemic control when compared with consuming PUFA( Reference Julius 44 ), SFA( Reference Vessby, Uusitupa and Hermansen 45 ) or carbohydrates( Reference Ros 46 , Reference Paniagua, Gallego de la Sacristana and Romero 47 ). The current study adds to this literature, associating moderate intake of MUFA with reduced incident isolated IFG. It is of particular interest to note that the moderate MUFA intake had the reduced hazard benefit, and not the higher intake, suggesting an optimal intake for its impact based on the ARIC study participants.
n-3 PUFA are strongly regarded as heart healthy and good for decreasing chronic disease risk. Epidemiological evidence, however, has been contradictory, with some studies showing no relationship between n-3 fatty acids and glycaemic control( Reference Hartweg, Perera and Montori 48 ) and others showing a positive association between n-3 PUFA and disruption of glycaemic control( Reference Patel, Forouhi and Kuijsten 15 , Reference Kaushik, Mozaffarian and Spiegelman 49 ). n-3 Fatty acids have been shown to be protective against disruptions in glucose homeostasis in animal studies via increasing PI3 kinase and GLUT4 activity in muscle, inhibiting glucose-6-phosphatase in liver( Reference Delarue, LeFoll and Corporeau 50 ) and reducing cyclooxygenase-mediated pro-inflammatory pathways to improve insulin sensitivity( Reference Flachs, Rossmeisl and Bryhn 51 ). All of these impact glycaemic control. A recent study also showed reduced insulin resistance following n-3 supplementation in children and adolescents( Reference Juarez-Lopez, Klunder-Klunder and Madrigal-Azcarate 52 ). However, n-3 fatty acids can increase circulating blood glucose levels by increasing gluconeogenesis( Reference Woodman, Mori and Burke 53 ) and increasing fatty acid utilization( Reference Carpentier, Portois and Malaisse 54 ). Whether this is inclusive of the metabolic complications associated with T2DM is still unclear( Reference Kaushik, Mozaffarian and Spiegelman 49 ). Our results showing a positive relationship between n-3 PUFA and increased incident isolated IFG agree with the recent study that n-3 PUFA may actually increase risk of IFG( Reference Juarez-Lopez, Klunder-Klunder and Madrigal-Azcarate 52 ), and leads us to speculate that n-3 fatty acids may help with insulin resistance and IGT but not fasting glycaemic control and IFG. Supporting this argument, the IFG with IGT incidence in our ARIC study population did not identify any association with dietary n-3 intake, further adding proof that dietary management of one (isolated IFG) v. two (IFG and IGT) prediabetic conditions requires different dietary fat composition advocacies. Future studies focusing on replacing SFA and MUFA with PUFA and n-3 PUFA would shed further light on the difference in dietary risk factors impacting this issue.
Until recently, n-6 PUFA were thought by many to actually increase inflammation disease risk. More recent studies, however, have shown that there is a lack of literature to support these notions( Reference Farvid, Ding and Pan 55 , Reference Vaughan, Garrison and Stamatikos 56 ). Our finding that moderate intake of n-6 PUFA actually reduced non-isolated IFG provides additional support for some of the beneficial effects of this type of PUFA. More research exists regarding the impact of n-3 PUFA on diabetes or blood glucose( Reference Jeppesen, Schiller and Schulze 57 ); however, these findings should generate further discussion about the possible health benefits of n-6 PUFA and their role on blood glucose regulation as well as overall disease risk, which is still poorly understood( Reference Tortosa-Caparros, Navas-Carrillo and Marin 58 ).
Strengths, limitations and conclusions
The current study has a few limitations. Dietary data were obtained using a sixty-six-item semi-qualitative FFQ administered by trained and certified interviewers. As mentioned earlier, self-reported dietary intake includes participant bias and may not be very accurate. However, a standardized protocol, trained interviewers and a validated FFQ, as used in the current study, have been shown to be more reliable than a self-administered FFQ( Reference Bingham, Gill and Welch 59 ). Also, the time-to-event (IFG) was estimated as the number of days between baseline and the visit date when IFG was identified, but for many study participants IFG may have occurred earlier. Therefore, time-to-event may be longer than actual time; however, this strategy is consistent for all study participants.
We used the energy density model to control for overall energy intake. The energy density model is the most commonly used method for controlling for the effect of overall energy intake on the outcome variable, especially when the primary independent variables are energy-contributing variables (dietary fat in this case). Its limitations include the possibility that it does not entirely eliminate the confounding effect of dietary energy intake, as has been noted earlier( Reference Berdanier, Dwyer and Feldman 60 ). Further, we did not adjust for baseline dietary pattern or other dietary macronutrients that might indirectly be involved in the pathogenesis of IFG and IGT. This might question the strength of the risks we report for MUFA, n-3 and n-6 PUFA, unless proven by a randomized control trial. However, the strength of the nutrient density model lies in its ease of use and interpretation, because it provides an indirect means to control for other dietary macronutrients and familiarity. It is also primarily used in national guidelines, making it readily relevant and applicable to the population( Reference Berdanier, Dwyer and Feldman 60 ).
Yet another strength of our study lies in the fact that ARIC is a large, population-based study of African-American and White middle-aged adults with almost 10 years of follow-up, making it appropriate to address our hypothesis. ARIC started in 1987, with ~11·4 % having either type 1 or type 2 diabetes, which is comparable to the 9·4 % prevalence of diabetes in the general population( 61 ). This age group is leading into the 65 years or older population, which is highly at risk for diabetes (at 25·9 % prevalence( 61 )). This makes it pertinent to study the age group that has been chosen for the ARIC study, as the longitudinal impact of diet during these years contributes to chronic disease status in the senior years. Hence, we believe that the ARIC study population is ideally suited for the question we have addressed.
Overall, based on our individual results, isolated IFG may benefit from moderately high MUFA intake and limited n-3 PUFA intake, while IFG in association with IGT may improve with higher n-6 PUFA intake. SFA intake did not play a significant role in incident prediabetes in this study population. Future research should both confirm and test these speculations in a controlled feeding trial, to assess their validity.
Acknowledgements
Acknowledgements: This manuscript was prepared using ARIC Research Materials obtained from the National Heart, Lung, and Blood Institute’s (NHLBI) Biologic Specimen and Data Repository Information Coordinating Center and does not necessarily reflect the opinions or views of the ARIC or the NHLBI. Financial support: This research received no specific grant from any funding agency in the public, commercial or not-for-profit sectors. Conflict of interest: The authors declare no conflict of interest. Authorship: S.K., J.A.C. and C.M.P. obtained the data and conceived the study question and hypothesis. S.K. conducted all analyses, L.M.S. guided and advocated analyses. All authors contributed to writing the manuscript and tables and figures. Ethics of human subject participation: Public-use data were obtained from a previously conducted study, where all procedures involving human subjects were approved by the Institutional Review Boards of the participating institutions: Wake Forest Baptist Medical Center, Winston-Salem, NC; University of Mississippi Medical Center, Jackson, MS; University of Minnesota, Minneapolis, MN; and Johns Hopkins University, Baltimore, MD. Written informed consent was obtained from all subjects.
Supplementary material
To view supplementary material for this article, please visit https://doi.org/10.1017/S1368980016003669


