


Anaemia, the condition of low blood Hb levels, affects an estimated one in three persons globally( 1 ). Women of reproductive age (WRA; 15–49 years) experience a disproportionately large anaemia burden due to menstrual blood losses as well as higher nutrient requirements and increased blood volume during pregnancy( Reference Scholl and Hediger 2 ). India leads in terms of the number of anaemic individuals, with recent estimates indicating that 53 % of WRA and 50 % of pregnant women are anaemic in India( 3 ). Of particular concern is anaemia during pregnancy, which is positively associated with maternal mortality, risk of infection, preterm delivery, and poor fetal and infant health( Reference Rahman, Abe and Rahman 4 ). Quality of life in anaemic women is also impacted, with demonstrated inverse relationships between anaemia and work capacity( Reference Haas and Brownlie 5 ), physical performance( Reference Pasricha, Low and Thompson 6 ) and neuropsychological outcomes( Reference Murray-Kolb 7 ).
In the past decade, anaemia among WRA in India saw a slow average annual rate of reduction of 0·2 % from 2006 to 2016( 3 ). India is not on track to meet the World Health Assembly target of a 50 % anaemia reduction among WRA between 2012 and 2025( 8 ). Economic development alone is unlikely to address the problem of anaemia( Reference Alderman and Linnemayr 9 ). Rather, anaemia reduction requires combining multiple strategies including commercial fortification of staple foods, distribution of iron–folic acid (IFA) supplements and deworming drugs, enhancing nutrient levels of staple crops through biofortification and behaviour change communication to promote better dietary patterns( Reference Zimmermann and Hurrell 10 , Reference Bouis, Hotz and McClafferty 11 ).
The aetiology of anaemia is complex and therefore best approached from a holistic perspective that simultaneously accounts for factors at multiple levels( Reference Anand, Rahi and Sharma 12 ). This is especially important in developing country contexts such as India’s, given overlapping issues of poor hygiene, inadequate access to health resources and a predominantly vegetarian grain-based diet( Reference Headey, Hoddinott and Park 13 , Reference Corsi, Mejía-Guevara and Subramanian 14 ). At a nutrient level, Fe deficiency is thought to be causally related to anaemia in approximately 30–50 % of cases, with deficiencies in folate and vitamin B12 also being primary contributors( Reference Kassebaum, Jasrasaria and Naghavi 15 , Reference Petry, Olofin and Hurrell 16 ). Phytic acid, found in grains and legumes, is indirectly responsible for anaemia as it binds Fe in the gut and therefore inhibits its passage across the enterocyte( Reference Zimmermann and Hurrell 10 ).
Simultaneous consideration of changes in consumption of interacting dietary components, use of dietary supplements, socio-economic status, environmental factors and utilization of health services such as antenatal care is critical to determine how each of these factors influences the likelihood of anaemia. While prior research on anaemia in India focuses on cross-sectional data and individual predictors( Reference Bharati, Som and Chakrabarty 17 – Reference Bentley and Griffiths 19 ), we sought to investigate how changes in micronutrient intake relate to the risk of anaemia in pregnant women – while accounting for changes in covariates such as socio-economic status and coverage of public health interventions – using four population-representative household survey data sets from India spanning 10 years. Furthermore, given high regional variability in India in terms of dietary patterns and agroecological practices and conditions, we sought to examine these interrelationships at the district level in districts spanning north, north-east, central and south India, such that inferences could be made at the national level. Our findings suggest that multisectoral public health policies and programmes that simultaneously target women’s education, early marriage, open defecation (OD) and promotion of diets rich in Fe and folic acid and low in phytate are likely to have the greatest impact on anaemia reduction among pregnant women.
Methods
Data sources
Individual- and household-level data from two repeated cross-sectional rounds of the District Level Household and Facility Survey in 2002–04 (DLHS-2)( 20 ) and 2012–13 (DLHS-4)( 21 ) were used. The DLHS is conducted by the International Institute for Population Sciences for the Ministry of Health and Family Welfare, Government of India. The DLHS rounds follow a systematic, multistage stratified sampling design and households are sampled to be representative at the national, state and district levels. While DLHS-2 covered all states/union territories in India, DLHS-4 covered only a subset of twenty-one states/union territories. For our analyses, we only used data from states (and districts) covered in both rounds.
Additionally, we used the national- and state-representative household consumer expenditure survey (HCES) conducted by India’s National Sample Survey Organization (i.e. the National Sample Survey – Consumer Expenditure Survey (NSS-CES) 61st round, 2004–05 and 68th round, 2011–12)( 22 , 23 ). The HCES provides information on total food quantities consumed and amounts spent by households to purchase food and non-food items with a recall period of one month. The HCES interviews are conducted with households randomly selected through a stratified multistage survey design. Households are sampled to be representative for a contiguous group of districts within a state/union territory having similar topography, agro-economic characteristics and population densities( 24 , 25 ) (see online supplementary material, Supplemental Note, for a discussion). The HCES accounts for seasonality in consumption by using a uniform sample spread across the four quarters of the year. The final data set (466 districts, 17 138 pregnant women) used for our analyses was derived only from districts common to both rounds of the DLHS and both rounds of the HCES.
Outcome variable
The primary outcome was the prevalence of anaemia among pregnant women aged 15–49 years. A Hb cut-off of <110 g/d, as per WHO standards, was used to define anaemia( 26 ). Laboratory measurement of Hb was done using the dried blood spot method( 20 , 21 ).
Explanatory variables
Sociodemographic variables included: household socio-economic status (SES), woman’s years of education, woman’s age at pregnancy, cluster (village) level OD, household cooking fuel type (wood or other) and household size. The SES score was constructed using principal component analysis of household assets including dwelling type, water source, toilet type, primary fuel used for lighting, and possession of assets including fan, radio, sewing machine, television, phone, bicycle, motorcycle and car. The SES score was divided into quintiles to obtain a within-year measure of household wealth relative to other households. OD was transformed by raising it to the power of 0·33 to account for non-linearity in the association with nutritional outcomes( Reference Headey, Hoddinott and Park 27 ). Programmatic variables included total number of IFA tablets consumed during pregnancy at the time of the survey and number of antenatal care visits. Dietary variables included household-level nutrient supply (reported food quantities consumed by a household in a month multiplied by nutrient content per unit food item) of vitamin B12, folic acid, Fe and phytate. The HCES data set includes household consumption data on cereals, coarse grains, dairy, pulses, eggs and meats, oils, vegetables, fruits, spices and sugars. In the absence of an alternative source of nationally representative individual-level data on dietary intake that would provide more reliable estimates of food consumption by pregnant women within a household, we use consumption data to estimate household micronutrient supply. We first computed district means of quantities consumed for eighty-eight food items spanning all food groups from the household-level data. These means were converted to four explanatory variables representing daily nutrient supply at the household level – vitamin B12 (cobalamin; µg), folic acid (µg), Fe (mg) and phytate (mg) – using conversion factors obtained from the Indian Food Composition Tables ( Reference Longvah, Ananthan and Bhaskarachary 28 ). These four nutritional components were selected based on biological plausibility of an association with anaemia( Reference Zimmermann and Hurrell 10 , Reference Moll and Davis 29 , Reference Phiri 30 ). To obtain nutrient content for food items not listed in the 2017 Indian Food Composition Tables (brown bread, white bread, milk powder, curd, ghee, butter, honey, mustard oil, groundnut oil, coconut oil, safflower seeds), we used micronutrient levels from the Nutritive Value of Indian Foods ( Reference Gopalan, Rama Sastri and Balasubramanian 31 ). Micronutrient levels of rice and wheat available in the market were used for subsidized rice and wheat, as micronutrient content information is not available for these subsidized food items that are typically offered to eligible poor rural households through the public distribution system. A full list of nutrient levels from foods used in our analyses can be found in the online supplementary material, Table S1.
Construction of the district panel data set
District averages of the outcome and predictors from the DLHS were calculated and then matched and merged with district averages of dietary factors estimated from NSS-CES to create a ‘synthetic’ district-level panel. Following Spears et al.( Reference Spears, Ghosh and Cumming 32 ), data were merged by district and year, yielding a final sample of 17 318 pregnant women aged 15–49 years in 466 districts (233 districts in 2004 and 233 districts in 2012). The data set construction steps and sample size at each step are outlined in the online supplementary material, Table S2.
Mapping anaemia prevalence
Anaemia prevalence among pregnant women aged 15–49 years was mapped for the sample districts for the year 2012 using Geographic Information Systems coordinates for Indian Districts in DLHS-4. This map was used to understand spatial variations in prevalence rates across and within regions and to visualize the regional distribution of the sample.
Comparison of household micronutrient supply estimates with recommended intake levels
Estimated household-level micronutrient supply was compared with dietary guidelines issued by the National Institute of Nutrition in 2011( 33 ). To approximately estimate recommended intake at the household level, an average household of one man, one pregnant woman and two children was assumed given an average household size of 4·2 members in DLHS-4. Recommended intake levels were summed across individuals to obtain the ‘recommended household intake’ of Fe, folic acid and vitamin B12. These comparisons aided an investigation into current shortfalls from recommended intake and possible effects of achieving recommended levels in terms of anaemia reduction.
Statistical analysis
Multivariate fixed-effects ordinary-least squares regression models were used to determine the association between changes in explanatory variables and changes in the outcome of interest. Multivariate rather than univariate models were used to reflect potential interactive effects between nutrients when consumed together. For district i at time t, the explanatory variables are the vectors/sets of household nutrient supply (Diet) and sociodemographic and programmatic factors (Non-diet). In all specifications, a year dummy variable (T) along with district fixed effects (µ i ) were included. The three final estimating equations were:
 $$N_{{i,t}} \,{\equals}\,C{\plus}\beta \,Diet_{{i,t}} {\plus}{\rm }T_{t} {\plus}{\rm }\mu _{i} {\plus}{\varepsilon}_{{i,t}} ,$$
 $$N_{{i,t}} \,{\equals}\,C{\plus}\alpha Non{\rm {\hbox-}}diet_{{i,t}} {\plus}T_{t} {\plus}\mu _{i} {\plus}{\varepsilon}_{{i,t}} $$
and
 $$N_{{i,t}} \,{\equals}\,C{\plus}\beta Diet_{{i,t}} {\plus}\alpha Non{\rm {\hbox-}}diet_{{i,t}} {\plus}T_{t} {\plus}\mu _{i} {\plus}{\varepsilon}_{{i,t}} .$$
Equation (1) estimates a model that explains anaemia prevalence using dietary factors alone, equation (2) uses non-dietary factors alone, while equation (3) is a combined model that includes both dietary and non-dietary factors. Using µ i , unobserved district-level factors that do not change over time and that may affect anaemia, its determinants or both were accounted for. Examples of such factors include deeply engrained dietary patterns, climate and geography( Reference Smith and Haddad 34 ). A white noise term (ε i,t ) was added to represent residual variation and constant (C) to represent the intercept. Coefficients α and β are interpreted as the resultant unit change in the outcome (anaemia prevalence) for a unit change in the explanatory variable. With two time points, the fixed-effects model yields coefficients equivalent to those estimated using a first difference or change-on-change model. Dietary variables were retained at the household level because the HCES do not collect information on individual consumption.
Secondary analyses
Two secondary analyses were conducted. Improved sanitation is a predictor of nutrition outcomes in children( Reference Headey, Hoddinott and Park 27 , Reference Smith and Haddad 34 ), but the association between OD as an environmental externality and anaemia in pregnant women is currently understudied( Reference Coffey, Geruso and Spears 35 ). Therefore, as an out-of-sample validity check, we corroborated the association of OD and anaemia among pregnant women using district-level data from India’s 2011 Census( 36 ) and the National Family Health Survey (NFHS) 2015–16( 37 ). This first post hoc analysis helped us interpret the regression coefficient for OD in the primary multivariate models. Second, we investigated the primary dietary sources of the chosen dietary factors (Fe, folic acid, vitamin B12 and phytate). These analyses shed light on the possible locally preferred foods that might be leveraged in policies and programmes aiming to reduce anaemia.
Results
Mapping of district-level anaemia prevalence among pregnant Indian women
Mapping of anaemia prevalence data revealed two key insights (Fig. 1). First, except for a few districts in the states of Himachal Pradesh (north), Arunachal Pradesh (north-east) and Kerala (south-west), anaemia prevalence was high in almost all areas (above 60 %) in 2012, underscoring the severity of the problem of anaemia among pregnant women in India. Second, data used in the study are representative of north, east, central and southern parts of India, thus covering most ecological and dietary patterns in the country.
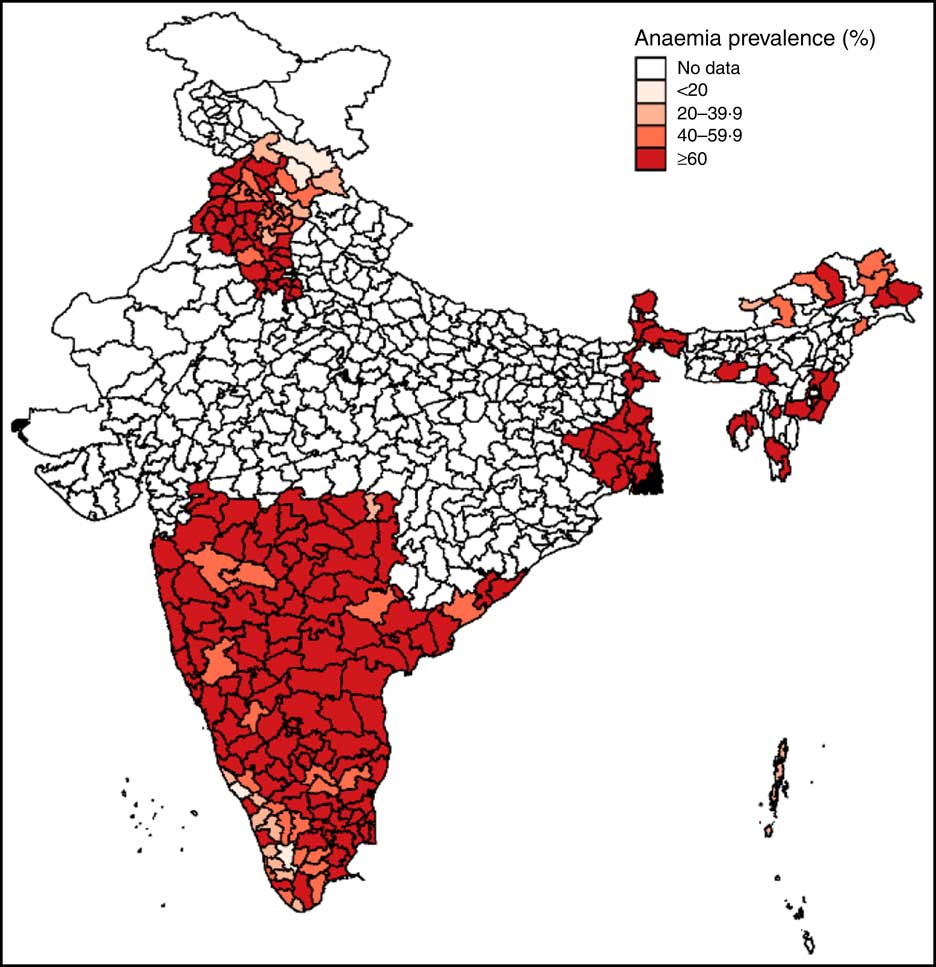
Fig. 1 (colour online) Map of district-level anaemia prevalence among pregnant Indian women aged 15–49 years, 2012
Changes in anaemia, sociodemographic, programmatic and dietary factors from 2002 to 2012
Anaemia prevalence among pregnant women fell from 82 % to 66 % from 2002 to 2012 (Table 1). The situation in terms of non-dietary variables generally improved, with women getting pregnant later, being more educated and attending slightly more antenatal care visits in 2012 compared with 2002 (all P < 0·001). OD and the use of wood as a source of cooking fuel were both high but decreased over time (P<0·001). Use of IFA tablets was low and did not change (P=0·957). No changes were observed in average household supply of folic acid and vitamin B12; however, both Fe (P=0·014) and phytate (P=0·001) supply decreased. In 2012, recommended supply at the household level, using the National Institute of Nutrition guidelines and assumptions about household composition explained earlier, seemed to be met for folic acid and vitamin B12 (Table 2). Household Fe supply, however, was only at 60 % of the recommended level per National Institute of Nutrition guidelines (Table 2).
Table 1 Changes in anaemia, sociodemographic, programmatic and dietary factors from 2004 to 2012 in pregnant Indian women aged 15–49 years (n 17 318)Footnote *
IFA, iron–folic acid; ANC, antenatal care.
* Data sources: District Level Household Survey, years 2002–04 and 2012–13( 20 , 21 ) and National Sample Survey – Consumer Expenditure Survey, years 2004–05 and 2011–12( 22 , 23 ).
† The socio-economic status (SES) score was constructed using principal component analysis of household assets including dwelling type, water source, toilet type, primary fuel used for lighting, and possession of assets including fan, radio, sewing machine, television, phone, bicycle, motorcycle and car. The SES score was divided into quintiles to obtain a within-year measure of household wealth relative to other households.
‡ Open defecation was measured as the percentage of households practising open defection within a village raised to power of 0·33.
Table 2 Comparison of estimated household nutrient supply in 2012 with recommended intake among households with pregnant women aged 15–49 years in India
* Data source: District Level Household and Facility Survey 2012–13 (DLHS-4)( 21 ).
† Recommended intakes were obtained from India’s National Institute of Nutrition guidelines( 33 ).
‡ The household requirement was computed assuming an average household of one man, one pregnant woman and two children (the average household size in DLHS-4 was 4·2 members); e.g. for Fe, the total household supply required was computed as 17+35+12+12(=76 mg/d). Percentage of daily requirement met was computed by dividing estimated household supply by total household supply required.
Influence of changes in sociodemographic and programmatic factors on change in anaemia prevalence
Age at pregnancy, women’s education and OD were significant predictors of anaemia (P<0·001). A one-year increase in age at pregnancy (P<0·001) and a 10 % reduction in OD (P=0·003) both predicted a 3·5–3·8 percentage point (referred to as % henceforth) reduction in anaemia. One additional year of education was associated with a 2·8 % reduction in the prevalence of anaemia (P=0·028). A 10 % increase in the urban population was associated with a 2·1 % increase in anaemia (P=0·044). Changes in wealth, type of cooking fuel used, number of IFA tablets, number of antenatal care visits and household size were not significantly associated with changes in anaemia (Table 3).
Table 3 Drivers of change in anaemia prevalence among pregnant Indian women aged 15–49 years between 2004 and 2012Footnote *
IFA, iron–folic acid; ANC, antenatal care.
* Data sources: District Level Household Survey, years 2002–04 and 2012–13( 20 , 21 ) and National Sample Survey – Consumer Expenditure Survey, years 2004–05 and 2011–12( 22 , 23 ). All models are adjusted for district fixed effects. Coefficients on micronutrients are for household-level consumption because individual consumption data were not available.
† The socio-economic status (SES) score was constructed using principal component analysis of household assets including dwelling type, water source, toilet type, primary fuel used for lighting, and possession of assets including fan, radio, sewing machine, television, phone, bicycle, motorcycle and car. The SES score was divided into quintiles to obtain a within-year measure of household wealth relative to other households.
‡ Open defecation was measured as the percentage of households practising open defection within a village raised to power of 0·33.
Influence of dietary changes on change in anaemia prevalence
Household supply of folic acid, Fe and phytate were significant predictors of anaemia among pregnant women. At the household level, a 100 µg/d increase in folic acid supply was associated with a 1 % reduction in anaemia (P=0·014), whereas a 100 mg/d increase in phytate supply predicted a 1 % increase in anaemia (P=0·001). An additional daily Fe supply of 10 mg per household (approximately 2–3 mg per capita) was associated with 8·9 % reduction in anaemia (P=0·002; Table 3).
Combined influence of dietary and non-dietary factors on anaemia
In the model where dietary and non-dietary factors were both included, a reduction in anaemia was associated with increased age at pregnancy (P<0·001), reduced OD (P=0·001), greater folic acid supply (P=0·018), greater Fe supply (P<0·001), and reduced urbanization (P=0·015) and phytate supply (P=0·002). An additional daily Fe supply of 10 mg per household was associated with a 10 % reduction in anaemia. The combined model explained 44 % of the variation in the sample (R 2=0·44; Table 3).
In post hoc secondary analysis, the association between anaemia prevalence and the practice of OD was corroborated using the NFHS-4 data set (Fig. 2). The scatter plot revealed a non-linear relationship beyond 40 % OD prevalence, i.e. anaemia increased linearly with OD up to 40 % and then plateaued, thus reaffirming the need for a non-linear variable specification in the regression model( Reference Headey, Hoddinott and Park 27 ).
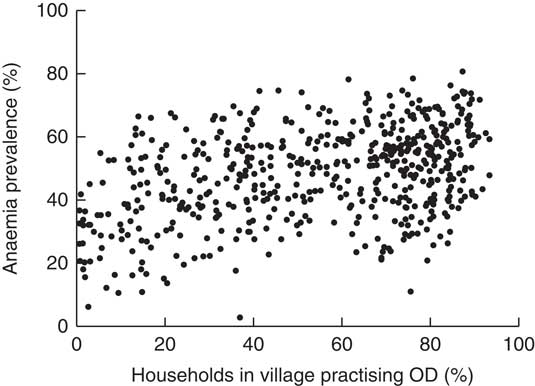
Fig. 2 Association between open defecation (OD) and prevalence of anaemia (Hb<110 g/l) among pregnant Indian women aged 15–49 years, 2015. Dots represent individual districts. (Data sources: Indian National Family Health Survey, 2015–16( 37 ) for district-level anaemia prevalence and Indian Census 2011( 36 ) for percentage of households practising OD in a district)
When examining which foods accounted for the majority of each of the four dietary factors examined, we found that cereals contributed approximately 25 % of folic acid, 50 % of Fe and 75 % of phytate supply at the household level (Fig. 3). Milk and fish were the predominant sources of vitamin B12, with fish also accounting for 25 % of folic acid supply. Other than cereals, primary sources of Fe included pulses and leafy greens.

Fig. 3 Contribution of food items to total folic acid, iron, vitamin B12 and phytate supply among pregnant Indian women aged 15–49 years. Inner and outer rings represent intake in 2004 and 2012, respectively
Discussion
We estimated and compared the associations of sociodemographic, programmatic and dietary factors with anaemia prevalence among pregnant Indian women. Our findings suggest that delayed age at pregnancy and reduction in OD were strong predictors of anaemia reduction in India between 2004 and 2012. Changes in household Fe, folic acid and phytate supply were also significantly associated with changes in anaemia prevalence. The direction of results is consistent with anaemia assessments at the global level( Reference Stevens, Finucane and De-Regil 38 ) as well as those from India( Reference Pasricha, Black and Muthayya 39 , Reference Balarajan, Fawzi and Subramanian 40 ) and suggest that family planning, sanitation and micronutrient deficiencies should be addressed to optimally reduce anaemia among WRA.
Interpretation of effect sizes for sociodemographic and programmatic factors
In the current sample, age at pregnancy increased by 2·2 years from 2002 to 2012, an increase that accounted for an estimated 7 % decline in anaemia over this 10-year period. Delayed pregnancy may benefit anaemia through several pathways. Women who become pregnant at a young age might drop out of school early and thus be less educated compared with women who get pregnant later. Delaying pregnancy may also allow women to mature beyond the growth spurt and corresponding high nutrient requirements of adolescence, and to form better eating habits. While age at pregnancy may be dependent on socio-economic and cultural contexts, India has programmes and policies that could have directly influenced age at first birth and birth spacing( Reference Pachauri 41 ) during the study period. Thus, it is likely that the increase in age at pregnancy of surveyed pregnant women is a response to programmatic and policy interventions.
Estimated village-level OD decreased by 22 % from 2002 to 2012, a change that accounted for an estimated 9 % decline in anaemia over this 10-year period. The biological plausibility of a positive association between anaemia and OD is well supported given current knowledge of how faecal exposure can lead to chronic intestinal inflammation, i.e. environmental enteropathy, and thus reduced nutrient absorption( Reference Ngure, Reid and Humphrey 42 ). The association between anaemia and OD is understudied, but recently has been demonstrated in Nepal( Reference Coffey, Geruso and Spears 35 ). As of 2016, only 50 % of Indian households used an improved sanitation facility( 21 ), thus there is wide scope for improvements in sanitation. Our findings suggest that India’s efforts to focus on making entire villages OD free could have positive nutritional benefits( Reference Dash 43 ). Importantly, our analyses suggest that campaigns which do not reduce OD to less than 40 % of households in a village practising OD are unlikely to achieve anaemia reductions.
The population living in urban areas increased by 6·7 % from 2002 to 2012, an increase that accounted for an estimated 1·7 % increase in anaemia after adjusting for covariates such as household SES and women’s education; a small but significant change. Although there is no established mechanism for an adverse effect of urbanization on anaemia, women who move to urban areas may have migrated in search of employment and may be living in urban slums with poor sanitation and lack of access to piped water( Reference Agarwal 44 ). Furthermore, women in urban slums make dietary sacrifices for children and working male members during times of food insecurity such as periods of food price inflation( Reference Gupta, Singh and Seth 45 ). Thus, it is possible that women who migrate to urban areas experience an increased risk of anaemia due to unsanitary environmental conditions and an inadequate consumption of nutrient-rich foods.
We did not find that number of IFA tablets consumed during pregnancy was associated with anaemia (P=0·215), which was unexpected given the relatively high dose of Fe and folic acid in supplements compared to food items. Women in DLHS-4 were sampled at all stages of pregnancy and we would expect IFA tablet consumption to increase with duration of pregnancy. However, it is known that anaemia during the second and third trimesters is more prevalent than during the first trimester( Reference Abel, Rajaratnam and Gnanasekaran 46 ). This effect is largely attributable to haemodilution, which could nullify the expected positive association between IFA tablet consumption and anaemia. Others have reported that at least forty IFA tablets have to be consumed during pregnancy to see an improvement in Hb( Reference Gautam, Bansal and Taneja 47 ); in our sample, the mean consumption was twenty-seven tablets (see Table 1), which could reflect low compliance, short mean duration of pregnancy during the time of the survey, or supply and access constraints.
Interpretation of effect sizes for dietary factors
In pregnant women, the recommended daily intakes of Fe and folic acid are 35 mg and 500 mg, respectively (Table 2). Assuming that within a household, pregnant women receive an equal share of nutrients, pregnant Indian women met only 30 % of their Fe requirement in 2012. However, this is likely to be an overestimate given the well-understood gender gap in India( Reference Borooah 48 ). If recommended levels were met, anaemia would be considerably reduced. For instance, an increased household supply of 30 mg per household per day (~7 mg per capita) from 2012 levels predicts a 30 % anaemia reduction in pregnant women. We did not find a statistically significant association between household vitamin B12 supply and anaemia (P = 0·056 in the dietary model), which may be due to the stable supply of this nutrient over the 8-year span (4·2 to 4·1 µg per household per day from 2004 to 2012; see Table 1) and thus limited predictive power. Our finding that cereals were the largest source of Fe and folic acid reinforces the importance of cereal fortification as a solution to anaemia( Reference Huma, Salim-Ur-Rehman and Anjum 49 , Reference Pachón, Spohrer and Mei 50 ). However, cereals also contribute phytate, which reduces Fe absorption and thus counteracts their beneficial effect. Further, more than 75 % of household Fe supply came from non-haem sources which have lower Fe absorption rates than haem sources (Fig. 3). Therefore, the use of modern biotechnological methods to both improve micronutrient content and reduce phytate content in cereals is essential in the fight against anaemia( Reference Gupta, Gangoliya and Singh 51 ).
Study strengths
Our study has several key strengths. First, we constructed a district panel data set to simultaneously account for multiple factors which interact in real-world settings to influence anaemia. This data set allowed us to control for changes in observed factors over time and unchanging unobserved factors (such as geography) within districts, thus greatly reducing biases that are inherent in cross-sectional data-based inference. Second, to our knowledge, the present study is the first to account for household-level micronutrient supply using the richest source of dietary data available in India, the NSS-CES, and to use the derived estimates to predict anaemia at the population level. The NSS conducts consistent and routine surveys on the consumption of over 100 food items; thus, the derived estimates are a reliable source for population-level inference. Our findings can be generalized not only at the national level, but also for other populations in South Asia and Africa with largely grain-based diets. Finally, the analyses presented here address an important public health problem – anaemia – in a particularly high-burden group of pregnant women.
Study limitations
Our study is not without limitations. First, the effects of changes in the examined factors on anaemia could be biased by unmeasured factors such as changes in personal hygiene habits. Second, associations between predictors may bias coefficients in the ordinary least-squares model. For example, household wealth may be related to the ability to purchase micronutrient-rich foods or build a latrine. Third, given our sample size of 466 districts, the inclusion of district fixed effects may have masked significant effects due to the loss of degrees of freedom available for statistical tests. For example, while women’s education was significant only in the non-dietary model, its effect size (one more year of education predicted a 1·6 % reduction in anaemia) is indicative of its relative importance even in the combined model. Fourth, NSS-CES data do not allow us to assess micronutrient intake from meals consumed outside the home. Given the high poverty context, we do not expect this to be a major issue, and inclusion of sociodemographic variables likely reduces this bias. Fifth, consumption of processed foods and snacks may not be well captured in the one-month dietary recall, as these non-traditional foods are difficult to measure in the shifting dietary landscape( Reference Smith 52 ). Such measurement errors may weaken associations between dietary factors and outcomes, but the strong associations we observed reflect that these biases are relatively small. Sixth, we did not account for the household supply of other nutrients that may also be related to anaemia such as enhancers or inhibitors of Fe absorption (e.g. vitamin C, Ca), riboflavin or vitamin A. We restricted our analyses to the major dietary predictors of Fe, folic acid and vitamin B12 (and phytate, given the heavily grain-based diet in India)( Reference Phiri 30 ). Including additional factors comes with a cost in terms of reduced degrees of freedom and greater potential for multicollinearity. Finally, in the absence of reliable individual-level data on dietary intake, we have used household consumption data from HCES to estimate the effect of household-level micronutrient supply on anaemia prevalence in pregnant women. The share of food intake of the pregnant woman within the household is unknown, and the household supply of micronutrients may not be equally distributed among household members. Thus, we are only able to estimate household nutrient deficits, which may not correspond to nutrient deficits at the individual level for pregnant women.
Conclusions
Reducing anaemia among WRA was declared a priority by the World Health Assembly( 53 ). Since India contributes the largest share of anaemic women in the world, the evidence generated here is relevant for strategies to reduce global anaemia prevalence by 50 % by 2025. Public health interventions to reduce anaemia in pregnant women in India have mostly focused on Fe supplementation to pregnant and lactating mothers and children aged 6–59 months. The National Nutritional Anemia Control Program has also promoted consumption of Fe-rich foods, but there is little evidence on the association between long-term changes in dietary patterns and changes in anaemia prevalence at the population level. Our findings suggest that IFA supplementation alone may not be a highly effective strategy to combat anaemia in pregnant women, especially given its history of supply, access and compliance issues that reduce effectiveness in certain contexts( Reference Sachdev and Gera 54 ). Given the multiple determinants of anaemia, a holistic public health approach – targeting both sociodemographic factors such as women’s education, age at first pregnancy and reduction of OD as well as dietary factors such as consumption of locally available Fe-rich foods – is likely to have the greatest impact on anaemia reduction.
Acknowledgements
Acknowledgements: The authors thank Purnima Menon and Harold Alderman for their comments on the manuscript. Financial support: This research received no specific grant from any funding agency in the public, commercial or not-for-profit sectors. Conflicts of interest: None. Authorship: S.C. and N.R. conceived the idea for the manuscript. S.S and S.C. designed the study and wrote the manuscript. S.C. led data the analysis. M.M. and N.G. extracted nutrient data. S.S. provided supervision. All authors were involved in the interpretation of data, critically reviewed the manuscript and approved the final version. Ethics of human subject participation: The current paper was a secondary analysis of publicly available DLHS and NSS-CES surveys. The DLHS surveys were conducted by the International Institute for Population Sciences and the NSS-CES surveys were conducted by the National Sample Survey Office of the Government of India. All data were collected following appropriate ethical standards for protecting respondents.
Supplementary material
To view supplementary material for this article, please visit https://doi.org/10.1017/S1368980018000903


