


Despite notable improvements in achieving global food security, more than 800 million people remain undernourished( 1 ). One out of three individuals worldwide is affected by at least one form of nutritional deficiency and many suffer from several deficiencies simultaneously. Micronutrient malnutrition remains one of the largest nutritional problems worldwide( Reference Steyn, Nel and Nantel 2 , Reference Gödecke, Stein and Qaim 3 ). Multiple indicators to measure and describe malnutrition and food insecurity exist, ranging from various household-level food production and consumption-based indicators to individual-level dietary indicators, anthropometric measurements and health outcomes( Reference Carletto, Zezza and Banerjee 4 – 20 ). Each of the indicators has a somewhat different focus and interpretation, but eventually all of them are used to measure how well people are nourished. Hence, a positive correlation between the different indicators would be expected( Reference Steyn, Nel and Nantel 2 , Reference Carletto, Zezza and Banerjee 4 ). But is this really true? Answering this question is important for at least two reasons: first, to understand whether certain indicators can be used as proxies for others for which data may not easily be available in certain situations; and second, to understand if household-level indicators can be used as proxies for individual-level diets and nutrition( Reference Hoddinott and Yohannes 8 ). Empirical evidence to answer such questions is limited; comparisons between household-level and individual-level indicators are particularly rare( Reference Zezza, Carletto and Fiedler 21 , Reference Koppmair, Kassie and Qaim 22 ).
We contribute to the literature on the measurement of diets and nutrition by comparing a larger set of indicators for the same study population. Our focus is on developing countries, because this is where problems of nutritional deficiencies are most pronounced( 1 ). Results may be of interest not only for researchers but also for development agencies that are planning and implementing nutrition programmes. Simple but reliable diet and nutrition assessment tools are important for practical programme implementation( Reference Hoddinott and Yohannes 8 , Reference Kennedy, Ballard and Dop 11 , Reference Swindale and Bilinsky 15 ).
The best measures of nutritional status are anthropometric indicators based on individual weight and height data( Reference Nelson, Beresford and Kearney 12 ). Common anthropometric indicators that are used to measure nutritional status are BMI for adults and height-for-age and weight-for-age Z-scores for children( 16 , 19 , 20 ). However, these anthropometric indicators are not necessarily good proxies of food security and dietary quality, as factors other than food intake can also influence body height and weight. Nevertheless, child anthropometrics are also used to report food insecurity( 1 , Reference Development Initiatives 23 , 24 ).
Food security and dietary quality are better measured through food consumption data that can be collected at household or individual level( Reference Carletto, Zezza and Banerjee 4 , Reference de Haen, Klasen and Qaim 25 ). If data on the quantity of different food items consumed are available, it is possible to calculate the intakes of energy and specific nutrients and set these amounts in relation to recommended levels to derive adequacy ratios( 26 ). Alternatively, measures of food variety or dietary diversity can be calculated, which is possible also when the frequency but not the quantity of food items consumed is known( Reference Carletto, Zezza and Banerjee 4 , Reference Habte and Krawinkel 7 ). The food variety score (FVS) is a simple count of the number of food items consumed over a certain period of time and thus measures the variety of dietary intake( Reference Chávez Zander 5 , Reference Keding, Msuya and Maass 10 , Reference Ruel 13 ). Dietary diversity (DD) scores count the number of food groups consumed( Reference Kant 9 , Reference Ruel 13 , Reference Ruel, Harris and Cunningham 14 ). Different DD scores with variations in the food group classifications exist( Reference Ruel, Harris and Cunningham 14 , Reference Leroy, Ruel and Frongillo 27 ). Household-level DD scores are generally considered good indicators of access to food and food security( Reference Kennedy, Ballard and Dop 11 , Reference Swindale and Bilinsky 15 , Reference Leroy, Ruel and Frongillo 27 ). Depending on the food group classification, individual-level DD scores are better indicators of dietary quality( 6 ). Specific DD scores were developed for women and children, as these are often the most vulnerable population groups( 6 , 17 , 18 ). Data to calculate FVS and DD scores are easy and fast to collect, which is why these indicators have become popular among operational development agencies( Reference Carletto, Zezza and Banerjee 4 , Reference Ruel, Harris and Cunningham 14 , Reference Savy, Martin-Prével and Traissac 28 , Reference Kennedy, Pedro and Seghieri 29 ).
Food consumption data can be collected with different methods. Most commonly, food recall methods are used, with variations in the recall period( Reference de Haen, Klasen and Qaim 25 ). Seven-day or 30d food consumption recalls and 24h dietary recalls are typical tools( Reference Zezza, Carletto and Fiedler 21 , Reference Coates, Colaiezzi and Bell 30 ). Beyond recall approaches, food record approaches are also commonly employed( Reference Gibson 31 ). At the household level, 7d food consumption recalls are frequently used to calculate measures of energy and nutrient consumption. However, such consumption indicators do not measure actual food intake, as issues of food waste, intra-household distribution and food away from home are not considered( Reference Koppmair, Kassie and Qaim 22 , Reference de Haen, Klasen and Qaim 25 ). Actual food intake is better captured through 24 h dietary recall at the individual level, which can also account for food preparation methods and food consumed away from home.
Several studies have analysed the relationships between different indicators at either household or individual level. For instance, Hoddinott and Yohannes examined the relationship between the household dietary diversity score (HDDS) and the household availability of food energy( Reference Hoddinott and Yohannes 8 ). Kennedy et al. found positive associations between the HDDS and household food consumption scores( Reference Kennedy, Berardo and Papavero 32 ). At the individual level, positive associations were shown between DD scores and micronutrient adequacy ratios, and between DD scores and anthropometric measures of women and children( Reference Ruel, Harris and Cunningham 14 , Reference de Haen, Klasen and Qaim 25 , Reference Savy, Martin-Prével and Traissac 28 , Reference Kennedy, Pedro and Seghieri 29 ). For adult males, the available evidence is scarce. Also, very few studies have compared household-level with individual-level diet or nutrition indicators. Recent research confirmed positive associations between household-level and individual-level DD scores in Malawi and Niger( Reference Koppmair, Kassie and Qaim 22 , Reference Cisse-Egbuonye, Ishdorj and McKyer 33 ). Hatløy et al. found significant associations between child nutritional status and household-level food item counts in an urban area in Mali( Reference Hatløy, Torheim and Oshaug 34 ). Bühler et al. reported mixed results when comparing child nutritional status and household-level food insecurity measures in Cambodia and Laos( Reference Bühler, Hartje and Grote 35 ).
Many existing studies only use one indicator, or a small set of indicators, without comparing them with many others( Reference Hoddinott and Yohannes 8 , Reference Ruel, Harris and Cunningham 14 , Reference Koppmair, Kassie and Qaim 22 , Reference Kennedy, Berardo and Papavero 32 – Reference Headey and Ecker 36 ). Therefore, we contribute to this literature by comparing a larger set of dietary and nutrition indicators at household and individual levels. We use data from rural areas of western Kenya, where subsistence farming is widespread and rates of malnutrition are relatively high( 37 , Reference Mbuvi, Muthengia and Kenyanya 38 ). At the household level, we carried out a 7d food consumption recall to calculate FVS, DD scores, and household-level energy and micronutrient consumption. At the individual level, we carried out a 24 h dietary recall to calculate similar dietary indicators for male and female adults and children. We also collected anthropometric data to measure individual nutritional status.
Materials and methods
Study area
The present study builds on data from smallholder farm households in the western part of Kenya. Specifically, the survey was conducted in the counties of Kisii and Nyamira, where most households are involved in subsistence-oriented farming( Reference Mbuvi, Muthengia and Kenyanya 38 ). Child undernutrition in this part of Kenya is relatively widespread. According to official statistics, 26 % of children below the age of 5 years were stunted in 2015( 37 ). At the same time, almost 30 % of the female adults were classified as overweight or obese( 37 ).
Data collection
We carried out an interview-based household survey in Kisii and Nyamira between October and December 2015. Participating households were randomly selected in a two-stage procedure. As many of the rural households are organized in farmer groups, we first randomly selected forty-eight farmer groups (thirty-two groups in Kisii and sixteen in Nyamira). Then, in each of the groups, we randomly selected fifteen to twenty households depending on group size. In total, 824 households (557 in Kisii and 267 in Nyamira) were sampled. The interviews were carried out in the local language by a team of interviewers specifically recruited and trained for the study. The interviewers were supervised by the researchers. Households were informed about the date and time of the interview several days in advance. Written informed consent was obtained from household heads and the parents of participating children.
To capture food consumption at the household level, a 7d food consumption recall was conducted with the person in the household responsible for food preparation. For this recall we used a list of 130 food items commonly consumed in this region. For each food item consumed by the household during the past 7d, the quantity, source (own production, purchased, gift) and unit price were captured. Of the 824 households, we have complete consumption data for 809 households.
In addition, we collected individual-level food intake and anthropometric data of persons living in the sampled households. In each household, we intended to target the household head, the spouse and one child aged 6–59 months. However, in many households we were unable to obtain data from three individuals because either a spouse and/or children did not exist or were not living in the same household. In some cases, individuals were absent during the scheduled time of the interview, even in a second attempt. In cases where more than one child aged 6–59 months was living in the household, the child included in the study was chosen randomly. In total, we obtained data from 1261 adults (782 females and 479 males) and 295 children (147 girls and 148 boys).
Individual-level food intake data were collected through a 24 h dietary recall. For adults, this recall was carried out twice during two separate meetings. The second recall was taken on a different and non-consecutive day to capture day-to-day variation of food consumption( Reference Savy, Martin-Prével and Traissac 28 ). During both recalls, participants were asked whether this was a normal or an exceptional day (e.g. celebration or sickness). Recalls of exceptional days were excluded from the analysis( Reference Nelson, Beresford and Kearney 12 , Reference Bingham 39 , Reference Patterson and Pietinen 40 ). The anthropometric measures were taken during the second meeting and were obtained from 1046 adults. For children, we only conducted one 24 h dietary recall, which was answered by the mother or caregiver. Anthropometric measures were taken from 238 children. Data from pregnant women were excluded from the survey. Lactating women were included; in a robustness check we confirmed that their exclusion does not lead to very different results. The same approach was chosen for breast-fed children.
One limitation of both food recall methods, the 7d food consumption and the 24h dietary recalls, in our cross-sectional survey is that they do not capture seasonal variation( Reference de Haen, Klasen and Qaim 25 ). However, Kisii and Nyamira receive plenty of rainfall and agricultural production takes place all year round. Hence, seasonal variation in food consumption may be lower than in many other parts of Africa.
Indicators of diets and nutrition
We use different indicators to measure diets and nutrition at household and individual level. Table 1 shows a summary of all indicators used. Additional explanations are provided below.
Table 1 Summary of indicators used to describe diets and nutrition at household and individual levels
n, sample size; DDS, dietary diversity score; MDD-W, minimum dietary diversity for women; MDD, minimum dietary diversity (specifically for children); FVS, food variety score; FCR, food consumption recall; DR, dietary recall; FG, food group; AE, adult equivalent; IOM, Institute of Medicine; FS, food security.
† FG classification according to Kennedy et al.( Reference Kennedy, Ballard and Dop 11 ).
‡ FG classification according to FAO and US Agency for International Development, Food and Nutrition Technical Assistance III Project( 6 ).
Nutritional status
Anthropometric data are used to depict the nutritional status of adults and children. Weight and height were measured for all individuals, following recommended techniques( Reference Cogill 41 ). For adults, BMI was calculated. For the classification of nutritional status, WHO standards were applied( 42 ). For children, Z-scores for weight-for-age (WAZ), weight-for-height (WHZ) and height-for-age (HAZ) were calculated according to the 2006 WHO standards( 18 , 19 ). Implausible data of children, too high and too low (n 6), were flagged and excluded, using the proposed cut-off points of ±6 sd for WAZ and ±5 sd for WHZ and HAZ( 19 , Reference Mei and Grummer-Strawn 43 ).
Dietary diversity
Three different measures of dietary diversity are calculated. First, we used the HDDS with twelve food groups to measure dietary diversity at the household level( Reference Kennedy, Ballard and Dop 11 , Reference Swindale and Bilinsky 15 , Reference Swindale and Bilinsky 44 ). For comparison, we used the same twelve food groups also to calculate a dietary diversity score (DDS) at the individual level for all adults and children. Second, we used the minimum dietary diversity for women (MDD-W) with ten food groups( 6 ). The MDD-W is recommended primarily for women of reproductive age (15–49 years). We use the MDD-W for these women in our sample (n 438), but additionally also use the same measure for the entire sample of female and male adults (n 1026). Third, for the child sample we calculated the minimum dietary diversity (MDD) score with seven food groups( 17 ). Whereas the MDD was primarily developed and validated for young children aged 6–23 months, we used this score for all children in our sample aged 6–59 months (n 271). Table 2 shows the classification of food groups for the different dietary diversity scores.
Table 2 Food groups used to construct different dietary diversity scores
DDS, dietary diversity score; MDD-W, minimum dietary diversity for women; MDD, minimum dietary diversity; F&V, fruits and vegetables.
In addition to the dietary diversity scores, we use the FVS, where each food item consumed is counted( Reference Chávez Zander 5 , Reference Keding, Msuya and Maass 10 , Reference Ruel, Harris and Cunningham 14 ). The FVS is used at the household level as well as for individual adults and children. Supplemental Table 1 in the online supplementary material shows the different food items consumed and the corresponding food group classifications. For the calculations of dietary diversity scores and FVS we considered all food groups and items, regardless of the actual quantities consumed, as there is no consensus whether – and if so, which – minimum thresholds should be used( Reference Ruel, Harris and Cunningham 14 , Reference Martin-Prevel, Becquey and Arimond 45 , Reference Arimond, Wiesmann and Becquey 46 ).
Nutritional intake
We calculated consumption and intake levels of food energy, macronutrients (protein, fat, carbohydrates) and three micronutrients (vitamin A, Zn, Fe) at the household level and at the individual level for male and female adults and children. Deficiencies in vitamin A, Zn and Fe make up the largest share of the health problems caused by micronutrient malnutrition in developing countries( 1 , Reference Lim, Vos and Flaxman 47 ). Quantities of all food items consumed were converted using the Tanzanian food composition table( Reference Lukmanji, Hertzmark and Mlingi 48 ), complemented with other sources where necessary( Reference Hotz, Lubowa and Sison 49 – 52 ). For some of the food items, consumed quantities were reported in non-standard units. We carried out market surveys and weighed typical unit measures for being able to make gram conversions. Food preparation methods were accounted for to the extent possible.
At the household level, energy and nutrient consumption levels were expressed per adult equivalent (AE), taking account of the demographic structure of each household. The AE computations consider age, gender and levels of physical activity of each household member( 26 ). We used common estimated average requirements (EAR) per AE of energy and micronutrients to classify households as nutritionally deficient( Reference Chege, Andersson and Qaim 53 , Reference Chiputwa and Qaim 54 ). For energy, a household was classified as undernourished if the consumption is below 10 042 kJ (2400 kcal)/AE per d( 26 ). For the micronutrients, the AE thresholds are 625 µg retinol equivalents for vitamin A, 15·0 mg for Zn and 18·3 mg for Fe( 55 ). In total, 801 households are included for this household-level energy and nutrient consumption analysis; eight households were excluded due to missing information on consumed quantities of certain food items.
At the individual level, EAR thresholds for energy and micronutrients take account of the age and gender of the individual adult or child; for energy individual weight is additionally considered( 55 , 56 ). In total, individual nutritional intake was calculated for 1007 adults and 255 children. Several individuals had to be excluded due to missing information for specific intake parameters. Unlike child anthropometric measures, where agreed-upon threshold values for the exclusion of outliers exist, clear thresholds are not available for measures of energy or nutrient consumption. We carried out robustness checks by excluding observations more than 1·5 times the interquartile range away from the mean. While the sample mean values change to some extent when excluding outliers, the statistical associations between the indicators were not affected. At the individual level, adequacy ratios for energy and micronutrients were also calculated, using specific EAR thresholds for adults and children( 56 ).
Statistical analysis
The data were analysed with the statistical software package Stata version 15.1. We show descriptive statistics for the different dietary and nutrition indicators at household and individual levels. To analyse the associations between the indicators, we computed correlation coefficients and used Pearson’s correlation coefficient test for statistical significance( Reference Steyn, Nel and Nantel 2 , Reference Kennedy, Pedro and Seghieri 29 , Reference Kennedy, Berardo and Papavero 32 , Reference Hatløy, Torheim and Oshaug 34 , Reference Hatløy, Hallund and Diarra 57 – Reference Torheim, Ouattara and Diarra 59 ). We are particularly interested in the associations between different types of dietary indicators and the associations between dietary indicators and nutritional status at the individual level. Furthermore, we are interested in the associations between dietary indicators at the household level and similar dietary indicators at the individual level, as these results can help to judge whether household-level indicators can be used as valid proxies for individual diets and nutrition.
We computed the correlation of each indicator with all the others. Of course, some of the correlations are more interesting than others when the focus is on identifying proxies. For instance, even without this analysis, it is clear that using BMI as a proxy for vitamin A intake is not a good idea. However, given that different forms of malnutrition often coexist in the same households and individuals, detecting correlations may be of interest also beyond the purpose of identifying proxies. We therefore show all correlations, even though we concentrate only on selected ones in the discussion.
Correlation analysis has certain limitations, as it only shows to what extent two variables are linearly related. To get a better understanding of whether correlations that were found statistically significant hold true only for parts of the sample or are possibly driven by correlated confounding factors, we also use regression analysis. In linear regression models, we looked at associations between the dietary indicators while controlling for a set of household characteristics. Furthermore, to test the agreement between household-level and individual-level DDS we applied Bland–Altman plots( Reference Giavarina 60 , Reference Bland and Altman 61 ).
Results
Nutritional status
The average household in our sample had 5·26 (sd 2·04) household members, including adults and children. Anthropometric indicators for the individual household members are shown in the online supplementary material, Supplemental Table 2. The male and female adults included in the sample had a mean age of 44·98 (sd 13·12) years, a mean weight of 64·97 (sd 12·57) kg and a mean height of 163·13 (sd 7·79) cm. The mean adult BMI was 24·44 (sd 4·57) kg/m2. Forty per cent of the adults included in the study had a BMI above 25 kg/m2 and are therefore classified as overweight. Overweight was significantly more widespread among women (46 %) than men (28 %). Only 6 % of the adults were classified as underweight with a BMI below 18·5 kg/m2.
The children included in the sample had a mean age of 32·27 (sd 14·58) months, a mean weight of 12·92 (sd 3·18) kg and a mean height of 89·02 (sd 12·46) cm. Nineteen per cent of the children were stunted, 75 % were underweight and 1 % were wasted. Only a very small percentage of the children were classified as overweight.
Dietary diversity
Descriptive statistics of the different dietary diversity and food variety indicators calculated at household and individual levels are summarized in Table 3. The average household consumed 9·4 different food groups during the 7 d recall period. Cereals and vegetables were consumed by all households. Within the group of cereals, the consumption of maize flour was reported most frequently (98 %), followed by white rice (75 %). The least consumed food group was fish and seafood (Fig. 1).
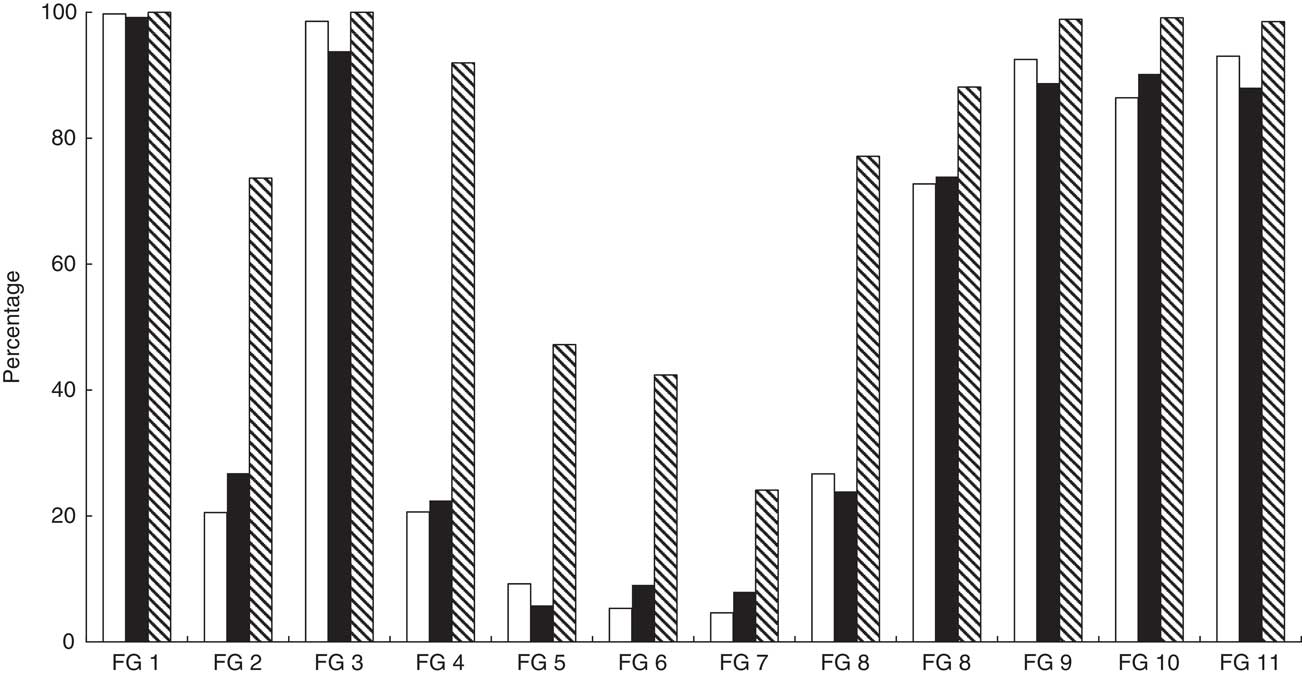
Fig. 1 Food group distribution in percentage terms (based on twelve food group classification) for adults (
![]() ), children (
), children (
![]() ) and households (
) and households (
![]() ) from Kisii and Nyamira counties, rural western Kenya, October–December 2015. Data were collected from 809 households and 1556 individuals (782 female adults, 479 male adults, 295 children aged 6–59 months) living in these households. FG, food group; FG 1, cereals; FG 2, white roots & tubers; FG 3, vegetables; FG 4, fruits; FG 5, meat; FG 6, eggs; FG 7, fish & seafood; FG 8, legumes, nuts & seeds; FG 9, milk & milk products; FG 10, oils & fats; FG 11, sweets; FG 12, spices, condiments & beverages
) from Kisii and Nyamira counties, rural western Kenya, October–December 2015. Data were collected from 809 households and 1556 individuals (782 female adults, 479 male adults, 295 children aged 6–59 months) living in these households. FG, food group; FG 1, cereals; FG 2, white roots & tubers; FG 3, vegetables; FG 4, fruits; FG 5, meat; FG 6, eggs; FG 7, fish & seafood; FG 8, legumes, nuts & seeds; FG 9, milk & milk products; FG 10, oils & fats; FG 11, sweets; FG 12, spices, condiments & beverages
Table 3 Descriptive statistics for dietary diversity measures in households, adults and children from Kisii and Nyamira counties, rural western Kenya, October–December 2015

n, sample size; DDS, dietary diversity score; FG, food group; MDD-W, minimum dietary diversity for women; MDD, minimum dietary diversity for children; FVS, food variety score.
At the individual level, both adults and children consumed about six food groups during the 24 h recall period on average, when using the twelve food group classification to calculate DDS. The MDD-W and MDD scores were lower, as one would expect given the different food group classifications. In the adult sample, all individuals consumed cereal-based food items – mostly ugali (a thick porridge made from maize flour). Eggs and seafood were consumed by only 5 % of the sample. In the child sample, almost all individuals consumed some form of staple foods (cereals, roots or tubers) and 94 % consumed at least one type of vegetable (Fig. 1).
For the MDD-W and the MDD, critical levels were established as guidelines for healthy and balanced nutrition( 6 , 17 , 18 ). Women of reproductive age should have MDD-W≥5 to guarantee an adequate intake of all required nutrients( 6 ). The mean MDD-W for women of reproductive age in our sample was 4·79 food groups (Table 3). Thirty-four per cent of the women remained below the critical level of five food groups. For the combined sample of male and female adults (n 1026), the picture is similar with a mean MDD-W of 4·71 (sd 0·99). Children should have MDD ≥ 4 for a healthy diet( 17 , 18 ). Twenty-six per cent of the children in our sample remained below this critical level. Also, when we confined the sample to children aged 6–23 months (n 75), the picture remained similar (mean 3·89 (sd 1·06)).
Nutritional intake
Table 4 reports the average consumption of energy and nutrients at the household level and for individual household members. At the household level, 33 % were classified as undernourished in terms of food energy. At the individual level, the calculated rates of energy undernourishment were significantly higher, 72 % for adults and 53 % for children. For micronutrient consumption levels and deficiency rates, we also observed notable differences between household-level and individual-level estimates. While the household-level data point at widespread Fe deficiency, the individual-level estimates suggest that Zn deficiency is much more prevalent (Table 4).
Table 4 Dietary intake at household, adult and child level in Kisii and Nyamira counties, rural western Kenya, October–December 2015

The differences between the household-level and individual-level dietary measures are striking. Especially the levels of energy consumption are much higher at the household level. This can be explained by two factors. First, the household measures are expressed per male AE, taking into account that male adults have higher energy requirements than female adults and children. Second, the household measures are based on the 7 d food consumption recall, whereas the individual measures are based on the 24 h dietary recall. Food consumption recalls are known to overestimate actual intakes, because food waste, quantities possibly consumed by guests and quantities possibly fed to pets are also included( Reference Zezza, Carletto and Fiedler 21 , Reference de Haen, Klasen and Qaim 25 ). Here, the focus is not primarily on the absolute values, but on the associations between the different indicators.
Associations between indicators
Correlation coefficients between all the different indicators at household and individual levels are shown in the online supplementary material, Supplemental Tables 3 and 4. The correlations of particular interest are summarized in Tables 5–9 and are discussed in more detail in the following.
Table 5 Correlations between household dietary indicators in Kisii and Nyamira counties, rural western Kenya, October–December 2015

DDS, dietary diversity score; FVS, food variety score; AE, adult equivalent; n, sample size.
**P < 0·05, ***P< 0·01.
Table 6 Correlations between different dietary and nutrition indicators for adults in Kisii and Nyamira counties, rural western Kenya, October–December 2015

DDS, dietary diversity score; FVS, food variety score; MDD-W, minimum dietary diversity for women; n, sample size.
*P <0·1, **P<0·05, ***P<0·01.
Table 7 Correlations between different dietary and nutrition indicators for children in Kisii and Nyamira counties, rural western Kenya, October–December 2015

DDS, dietary diversity score; MDD, minimum dietary diversity; FVS, food variety score; n, sample size; WAZ, weight-for-age Z-score; HAZ, height-for-age Z-score; WHZ, weight-for-height Z-score.
*P <0·1, **P<0·05, ***P<0·01.
Table 8 Correlations between household-level and individual-level indicators for adults in Kisii and Nyamira counties, rural western Kenya, October–December 2015

DDS, dietary diversity score; FVS, food variety score; AE, adult equivalent; n, sample size; MDD-W, minimum dietary diversity for women.
**P<0·05, ***P<0·01.
Table 9 Correlations between household-level and individual-level indicators for children in Kisii and Nyamira counties, rural western Kenya, October–December 2015
DDS, dietary diversity score; FVS, food variety score; AE, adult equivalent; n, sample size; MDD, minimum dietary diversity; WAZ, weight-for-age Z-score; HAZ, height-for-age Z-score; WHZ, weight-for-height Z-score.
*P<0·1, **P<0·05, ***P<0·01.
Table 5 reports the correlation coefficients between the different dietary indicators at the household level. All the correlations are positive and statistically significant. As expected, DDS is strongly correlated with FVS. Somewhat more surprising is the fact that micronutrient consumption is more strongly correlated with energy consumption than with either DDS or FVS. The strong correlations between energy, Fe and Zn consumption can be explained by the fact that starchy staple foods, especially maize, are the main source of Fe and Zn for households in the study region. Another reason for the stronger correlation between energy and micronutrients is that the energy indicator accounts for the quantity of food items consumed, whereas the DDS and FVS indicators do not. With better energy availability, households also increase the quantities of fruits, vegetables and animal-source foods consumed, which is not fully captured when simply counting the number of food groups or food items consumed during the 7 d recall period.
Correlation coefficients between the individual-level dietary and nutrition indicators for adults are reported in Table 6. All correlations between the different dietary indicators are positive and statistically significant, meaning that improvements in one indicator are associated with improvements in all the other indicators as well. This is a welcome finding. However, this also implies that multiple nutritional deficiencies are commonplace among the more disadvantaged population segments: people with low dietary diversity are also those who have low energy, protein and micronutrient intakes. Additional results in online supplementary material, Supplemental Table 5 confirm that adult dietary quality is positively associated with education and income. Hence, the poorest people suffer most from low dietary quality and nutritional deficiencies. Particularly noteworthy in Table 6 is also the strong correlation between the different food variety and dietary diversity scores, including DDS and MDD-W, suggesting that dietary indicators with different food group classifications lead to similar conclusions.
However, most of the correlations between the adult dietary indicators and BMI are very small and not statistically significant (Table 6). BMI is even negatively associated with some of the dietary indicators. This is not necessarily surprising for the micronutrients, as overweight and micronutrient malnutrition can occur simultaneously in the same individuals. However, BMI is also negatively correlated with energy consumption and positively correlated with being undernourished, which is counterintuitive. We further tested the associations through a regression model with BMI as dependent and energy intake as explanatory variable (see online supplementary material, Supplemental Table 6). After controlling for age, gender and household income levels, the energy intake coefficient turns insignificant. Hence, the negative correlations between BMI and some of the intake variables in Table 6 should not be over-interpreted. That energy intake is not a good predictor of BMI in this case may be related to the fact that food intake was collected only for short recall periods.
Correlation coefficients between the individual-level dietary and nutrition indicators for children are reported in Table 7. As for the adult sample, all correlations between the different dietary indicators are positive and statistically significant. MDD is correlated more strongly with micronutrient intakes than DDS and is therefore a better proxy of child dietary quality. However, as for the adult sample, we observe that most of the correlation coefficients between the child dietary indicators and the anthropometric measures are statistically insignificant. The only exception is the positive correlation between energy intake and HAZ. We infer that dietary indicators are not suitable proxies for nutritional status, neither for adults nor for children.
Beyond correlation analysis, we examined the associations between the dietary indicators at household, adult and child levels using regression models and controlling for a set of socio-economic characteristics (see online supplementary material, Supplemental Table 5). All associations remain positive and statistically significant. We also tested for possible heteroscedasticity in the regression models. As a clustered sampling procedure was used to select households, the error term distribution within clusters may possibly differ from the distribution across clusters. We tested for this possibility by computing se with cluster correction at the farmer group level. These corrections had no effect on the levels of statistical significance, hence underlining the robustness of the findings.
Associations between household, adult and child indicators
Results for the correlations between the dietary indicators at the household level and the dietary and nutrition indicators at the individual level are shown in Tables 8 and 9. Table 8 focuses on the results for adults. Household DDS and FVS are positively and significantly correlated with all individual-level dietary indicators. Similarly, other household-level dietary indicators are positively correlated with most other individual-level dietary indicators, including micronutrient intakes (see also online supplementary material, Supplemental Table 3). The associations remain positive and significant also after controlling for socio-economic characteristics in regression models (Supplemental Table 7).
Household DDS is not significantly correlated with adult BMI. However, household FVS and household energy consumption are positively and significantly correlated with adult BMI (Table 8). This suggests that household-level dietary indicators may be better proxies for adult nutritional status than individual-level dietary indicators. Most of these results also hold when we considered male and female adults separately (see online supplementary material, Supplemental Tables 8 and 9).
Table 9 shows the results for children. Household DDS and FVS are positively and significantly correlated with the individual-level dietary diversity indicators. However, household DDS is not significantly correlated with child micronutrient intakes. The same results are also obtained with regression models after controlling for key socio-economic characteristics (see online supplementary material, Supplemental Table 10). In contrast, household energy consumption and household micronutrient consumption levels are positively and significantly correlated with child micronutrient intakes (see also Supplemental Table 4), suggesting that the household-level indicators that account for the quantity of food items consumed are better proxies of child dietary quality than household DDS. Concerning child nutritional status, some of the household-level dietary indicators are significantly correlated with the weight-based measures (WAZ, WHZ), but not with HAZ.
Comparing results in Tables 8 and 9, it is interesting to observe that the correlation coefficients between household-level energy consumption and individual-level energy and nutrient intakes are very similar in magnitude for adults and children. This suggests that household-level consumption indicators are suitable proxies for the diets of all family members. Supplemental Table 11 in the online supplementary material provides further support for this interpretation by correlating household-level energy and micronutrient consumption with individual-level adequacy ratios. For energy, Zn and Fe, these correlations are all positive and statistically significant and similar in magnitude when comparing results for adults and children.
Bland–Altman plots for assessing the agreement of household-level DDS and individual-level DDS for adults and children are shown in Fig. 2. For adults, 95 % of the pairs of measurements fall within the limits of agreement. For children, 97 % of the pairs of measurements fall within the limits of agreement. These findings further support the result that household measures of dietary diversity can be used as good proxies for individual adult and child dietary diversity.
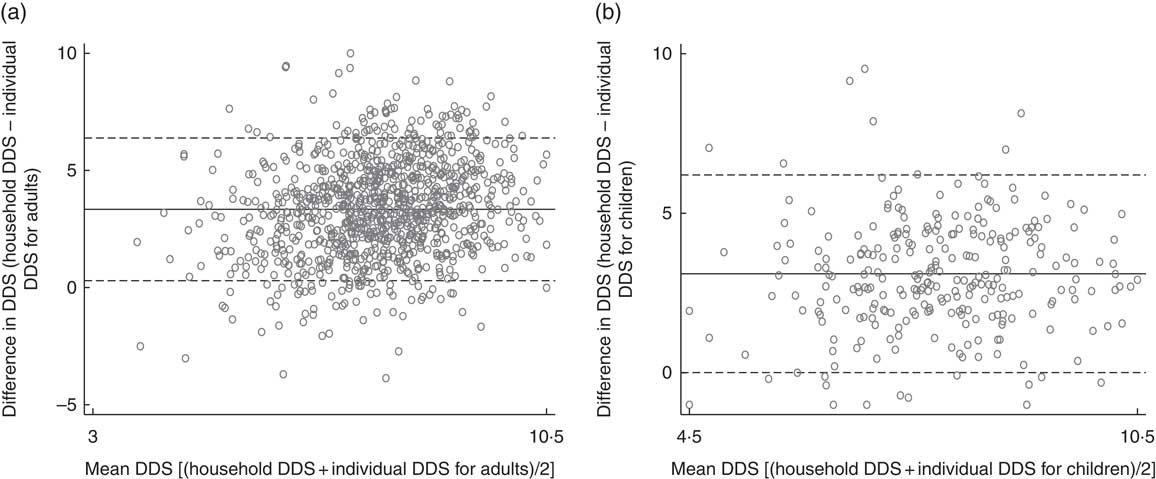
Fig. 2 Bland–Altman plots assessing the agreement of household-level dietary diversity score (DDS) and individual-level DDS for (a) adults and (b) children from Kisii and Nyamira counties, rural western Kenya, October–December 2015. ——— represents the mean difference (bias) and – – – – – represent 95 % limits of agreement (mean difference± 1·96 sd of the difference). (a) Mean difference between household DDS and individual DDS for adults was 3·34 (95 % CI 0·29, 6·38); (b) mean difference between household DDS and individual DDS for children was 3·10 (95 % CI 0·01, 6·20). Data were collected from 809 households and 1556 individuals (782 female adults, 479 male adults, 295 children aged 6–59 months) living in these households
Discussion and conclusion
In the present paper we have calculated and compared a large set of dietary and nutrition indicators based on household-level and individual-level data collected for the same target population in rural areas of western Kenya. The main objective was to analyse associations between different types of indicators, to better understand which indicators can be used as proxies for others. Such information can be useful to assess diets and nutrition in situations with only limited availability of data.
First, we were interested in the associations between different indicators within the same target group. We found that all dietary indicators are positively correlated at a high level of statistical significance. DDS and FVS calculated based on 7 d recall data at the household level are good proxies not only of household energy consumption but also of household micronutrient consumption. Likewise, DDS and FVS calculated based on 24 h recall data at the individual adult and child level are good proxies of individual energy and micronutrient intakes. This is consistent with previous studies that had tested such associations in different geographical contexts( Reference Steyn, Nel and Nantel 2 , Reference Leroy, Ruel and Frongillo 27 , Reference Kennedy, Pedro and Seghieri 29 , Reference Hatløy, Torheim and Oshaug 34 , Reference Torheim, Ouattara and Diarra 59 , Reference Moursi, Arimond and Dewey 62 ). In our data, the significant associations between individual-level dietary diversity scores and micronutrient intakes hold regardless of the exact food group classification used, which is an interesting and novel result.
In terms of nutritional status indicators, most of the correlations between individual-level dietary data and anthropometric measures are very small and statistically insignificant. In other words, dietary indicators are not good proxies of nutritional status, neither for adults nor for children. This contrasts with a few other studies that had shown significant associations between dietary diversity indicators and children’s and women’s nutritional status in different developing countries( Reference Ruel, Harris and Cunningham 14 , Reference Arimond and Ruel 63 ). However, our study is not the first to find small or insignificant associations between dietary diversity and anthropometric indicators in some situations: Jones et al. used data from nine countries and found significant associations between child MDD and HAZ in only three of these nine countries( Reference Jones, Ickes and Smith 64 ). The relationship may be confounded by uncontrolled factors related to sanitation and hygiene( Reference Jones, Ickes and Smith 64 ). Furthermore, within-person error may play a role when the dietary indicators are based on a single-round 24 h recall, as is true for our sample of children. Within-person error can occur because certain food groups (especially animal products) are not consumed on a daily basis( Reference Thorne‐Lyman, Spiegelman and Fawzi 65 ). Further research on the associations between dietary indicators and anthropometric measures is warranted, since results seem to be context-specific.
Second, we have analysed the associations between different indicators across household and individual levels, which was rarely done before. Our findings show that household-level DDS and FVS are positively and significantly correlated with individual-level DDS and FVS for children as well as for male and female adults. Most previous studies had not collected dietary and nutrition data for adult men. Moreover, energy and micronutrient consumption at the household level are positively and significantly correlated with individual-level energy and micronutrient intakes for all target groups. Interestingly, the household-level dietary indicators are correlated more closely with some of the adult and child anthropometric measures than the individual-level dietary indicators. We conclude that household-level data can be used to calculate valid proxies of the diets of children and male and female adults when individual-level data are not available. This is an important result, because household-level data are often included in nationally representative household living standard surveys, whereas individual-level data are not.
Third, through comparing household-level and individual-level indicators we indirectly also compared two different recall methods, namely 7 d food consumption recall and 24 h dietary recall. Evaluating absolute levels of energy and nutrient consumption, both methods lead to different results. For instance, household-level calculations with 7 d food consumption recall data result in significantly higher levels of energy consumption and lower rates of undernourishment than individual-level calculations with 24 h dietary recall data. Interestingly, both food recall methods lead to higher rates of undernutrition than what the anthropometric indicators suggest, with notable differences especially in the adult sample. This means that the concrete method of data collection matters a lot when the focus is on measuring malnutrition. However, as mentioned, the different indicators derived from 7 d food consumption and 24 h dietary recall data are positively and significantly correlated. In other words, both methods are consistent in terms of ranking households and individuals according to their relative diet and nutrition situation.
Acknowledgements
Acknowledgements: The authors thank Jonathan Nzuma from the University of Nairobi and Michael Njuguna from Africa Harvest Biotech Foundation International for their cooperation and assistance during the field work. Useful comments were received from two anonymous reviewers and the editors of this journal. Financial support: This research was financially supported by the German Federal Ministry of Food and Agriculture (BMEL) based on a decision of the Parliament of the Federal Republic of Germany (grant number 2813FSNu01). BMEL had no role in the design, analysis or writing of this article. Conflict of interest: The authors do not report any conflicts of interest. Authorship: All authors contributed to the design of the research. A.F. and A.A. collected the data. A.F. analysed the data. All authors wrote and approved the final version of the paper. Ethics of human subject participation: No ethical approval was required. Participation in the survey was not associated with any health risks for study participants. Written informed consent was obtained from household heads and parents of participating children.
Supplementary material
To view supplementary material for this article, please visit https://doi.org/10.1017/S1368980018002756


