


Self-reported food intolerances are common. Most studies report prevalence rates ranging from 4 to 20 % of the general population(Reference Young, Stoneham and Petruckevitch1–Reference Gislason, Bjoernsson and Gislason3). In a multicentre European study measuring ‘illness’ or ‘trouble’ caused by ingestion of particular foods, rates of food intolerance were lower in Spain and Ireland compared with Scandinavian countries and Germany(Reference Woods, Abramson and Bailey2). Australia and Mexico also had higher rates of food hypersensitivity measured at 19·1 % and 30·1 %, respectively(Reference Woods, Abramson and Bailey2,Reference Puente-Fernandez, Maya-Hernandez and Flores-Merino4) . Prior data from the USA collected over 25 years ago found a prevalence of 12 % among 555 subjects(Reference Woods, Abramson and Bailey2). There appears to be some variability across countries. Food intolerance is not a novel ailment, but there remains a paucity of recent US-based research in this area.
The literature is more robust when it comes to prevalence of traditional immune-mediated IgE-associated food allergies. The pathogenesis of food intolerance or non-allergic food hypersensitivity is less clearly defined. Food chemical reactions, enzyme and transport defects, microbiome diversity and composition, perturbations the microbiota–gut–brain axis and fermentable oligo-, di-, mono-saccharides and polyols are potential mechanisms that may contribute to food hypersensitivity(Reference Lomer5,Reference Chey6) . Symptoms attributed to food intolerance vary, and may include complaints of the gastrointestinal tract such as flatulence, abdominal pain, bloating and diarrhoea(Reference Lomer5). These adverse reactions typically resolve upon elimination of the culprit food from the diet and return with its reintroduction. Despite the inherent challenges that accompany clinical trials of nutrition-based interventions, a double-blinded, placebo-controlled oral challenge is considered by some to be the criterion standard for identifying food-related intolerance; the number of clinically useful diagnostics is limited(Reference Lomer5).
Multiple studies have suggested that particular trigger foods are implicated in generating the symptoms of common gastrointestinal disorders such as irritable bowel syndrome in as high as 84 % of patients(Reference Bohn, Storsrud and Tornblom7,Reference Locke, Zinsmeister and Talley8) . Many irritable bowel syndrome patients have symptoms that worsen after a meal (63 %) and exclude or limit foods from their diet (62 %)(Reference Simren, Mansson and Langkilde9,Reference Monsbakken, Vandvik and Farup10) . Patients with functional gastrointestinal disorders exhibit higher rates of self-reported food allergies and food sensitivities that worsen abdominal symptoms than those with organic disease (OR 4·14, OR 3·08)(Reference Bhat, Harper and Gorard11). The manifestations of food-related irritable bowel syndrome symptoms are associated with a heavier disease burden and reduced quality of life(Reference Bohn, Storsrud and Tornblom7). Many patients want to learn more about foods to avoid(Reference Halpert, Dalton and Palsson12). Additionally, dietary restrictions and interventions have been shown to improve symptoms for some irritable bowel syndrome patients(Reference Altobelli, Del Negro and Angeletti13–Reference Staudacher, Lomer and Farquharson16).
Given the clinical importance of this issue and the resurgence of interest in food-related mechanisms of gastrointestinal symptoms and the impact of these symptoms on health-related quality of life, we aimed to update the data on this topic in US adults. The primary aim of our study was to quantify the prevalence of self-reported food intolerances among US adults with a secondary aim to identify common culprit foods. We hypothesised that food intolerances would be common and found in a greater percentage of the population than predicted by earlier US studies(Reference Woods, Abramson and Bailey2).
Methods
We conducted a cross-sectional study of individuals enrolled in Amazon’s Mechanical Turk (MTurk), a crowdsourcing website for the completion of requester directed tasks. Individuals were invited to complete an online survey involving a single questionnaire on ‘food-related health.’ MTurk has been shown to approximate the demographics of internet users in America(Reference Paolacci and Ipeirotis17). Inclusion criteria were adults aged 18–80 years, a US-based internet protocol address and MTurk approval rating >95 %. Workers with high approval ratings answer quality control questions more accurately and thus reduce response bias(Reference Peer, Vosgerau and Acquisti18). Surveys were administered from July to August 2019. Data were collected on self-reported food intolerances and basic demographic characteristics in order to estimate the prevalence of food intolerance and to identify the most commonly implicated foods – Supplement. Survey participants received a small monetary sum ($0·10) upon survey completion. This study was approved by the Indiana University Institutional Review Board, and consent was implied if individuals chose to participate after reviewing the study information and survey invitation.
Data were summarised using percentages or medians and interquartile range. Univariate comparisons between participants with and without self-reported food intolerances were performed using the Wilcoxon rank sum test for age and Pearson’s χ 2 test for other variables. Sample size estimates were calculated to evaluate the association between a binary variable and food intolerance. A target sample size of 875 respondents provided 80 % power at the 5 % significance level to detect a 2·3 OR of reporting food reporting food intolerance for binary variables with a prevalence of 20 %, assuming the prevalence of food intolerance to be 20 % in the study population, as estimated from prior reports in the literature. Adjusted associations of participant characteristics with food intolerance were assessed using multivariable logistic regression. Since age is a continuous variable, the association between age and food intolerance was examined using the LOWESS smooth scatter plot. This plot suggested a piecewise linear effect of age, where the odds of food intolerance decreased at a different rate for subjects in the 35–55 years age bracket compared with those in the 18–35 years or 55+ years age brackets. The effect of age was similar in those 18–35 years and 55+ years. This difference was accommodated using the logistic regression with the piecewise linear effect of age in which there were two variables for age: 18–35 years and 55+ years or 35–55 years. Analyses were conducted with SAS, version 9.4 (SAS Institute Inc.). Two-sided hypothesis tests were utilised with a P-value of <0·05 considered to be statistically significant.
Results
A total of 2200 unique surveys were received. After excluding those with an invalid response to the quality control question (n 64) and ineligible workers (n 3), we analysed 2133 valid survey responses. We found that 24·8 % (n 529; 95 % CI 23·0, 26·6 %) of US adults reported having a food intolerance and 75·2 % (n 1604) did not. There were significant differences in age, sex, race and number of prescription medications between those with and without self-reported food intolerance – Table 1. Those with a food intolerance were younger (P < 0·01); more likely to be female (P = 0·05) and more frequently African American, Asian or multiple races (P < 0·01) than those without a food intolerance. The number of prescription medications differed between those with and without a food intolerance (P < 0·01). LOWESS local regression approach demonstrated that the odds of food intolerance decreased linearly for ages 18–35 and 55+ years, but remained flat for ages 35–55 years. Within each age bracket, we observed the following OR for every 10-year increase in age: 18–35 years OR 0·71 (95 % CI 0·55, 0·90), 35–55 years OR 1·11 (95 % CI 0·91, 1·35) and 55+ years OR 0·69 (95 % CI 0·40, 1·18). The final model included two age variables: 18–35 years and 55+ years or 35–55 years. After adjusting for all other covariates, food intolerance was significantly associated with younger age for those aged 18–35 and 55+ years (18–35 and 55 + OR 0·70; 95 % CI 0·56, 0·89; P < 0·01), but was not associated with age in those aged 35–55 years. Adjusted analyses also revealed associations of food intolerance with race (African American OR 1·90; 95 % CI 1·37, 2·65; P < 0·01 and Asian OR 1·76; 95 % CI 1·19, 2·61; P < 0·01) and higher number of prescription medications (1–2 medications OR 1·53; 95 % CI 1·22, 1·91; P < 0·01 and three or more OR 1·48; 95 % CI 1·09, 2·01; P = 0·01) – Table 2. Region was not associated with food intolerance.
Table 1 Sample characteristics*
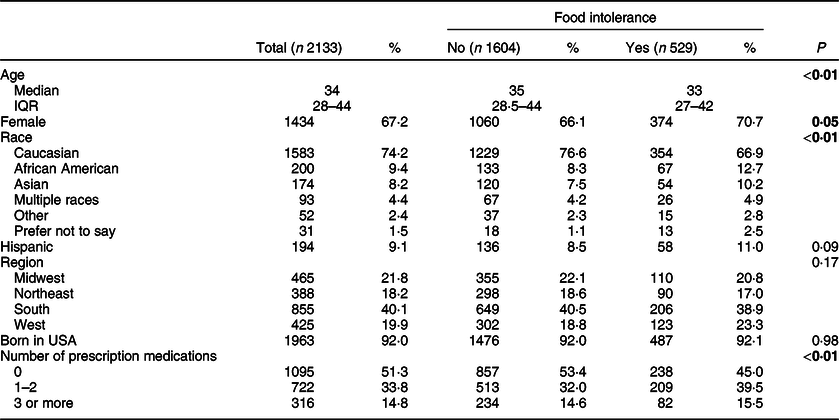
Bolded values emphasise those P-values that are statistically significant.
* Data show n and % unless otherwise specified. Median and interquartile range (IQR) are reported for age due to the skewness of the distribution. P-values are derived based on the Wilcoxon rank sum test for age and the Pearson’s χ 2 test for other variables.
Table 2 Adjusted associations of participant characteristics with food intolerance*
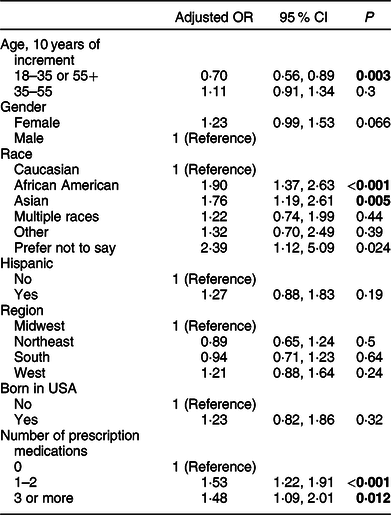
Bolded values emphasise those P-values that are statistically significant.
* OR estimates are based on multivariable logistic regression adjusting for all other variables and assuming a piecemeal linear effect of age.
The most commonly reported food intolerances were lactose, wheat, shellfish, eggs and soya among others – Fig. 1. When categorised broadly during data analysis after survey completion, grains, fruit, lactose, fish, vegetables, alcohol and nuts were most troublesome for individuals in that order. The prevalence of specific food intolerances in the study sample of US adults was 6·7 % (95 % CI 5·6, 7·7) for lactose, 4·8 % (95 % CI 3·9, 5·7) for wheat, 3·3 % for shellfish (95 % CI 2·6, 4·1), 2·9 % (95 % CI 2·2, 3·6) for eggs and 2·5 % for soya (95 % CI 1·9, 3·2). Lactose was often observed in combination with another intolerance (30·3 % (n 43) of all lactose intolerant subjects (n 142) reported lactose intolerance in combination with another food); the frequency of a non-lactose food intolerance was 18·1 % (95 % CI 16·5, 19·8).
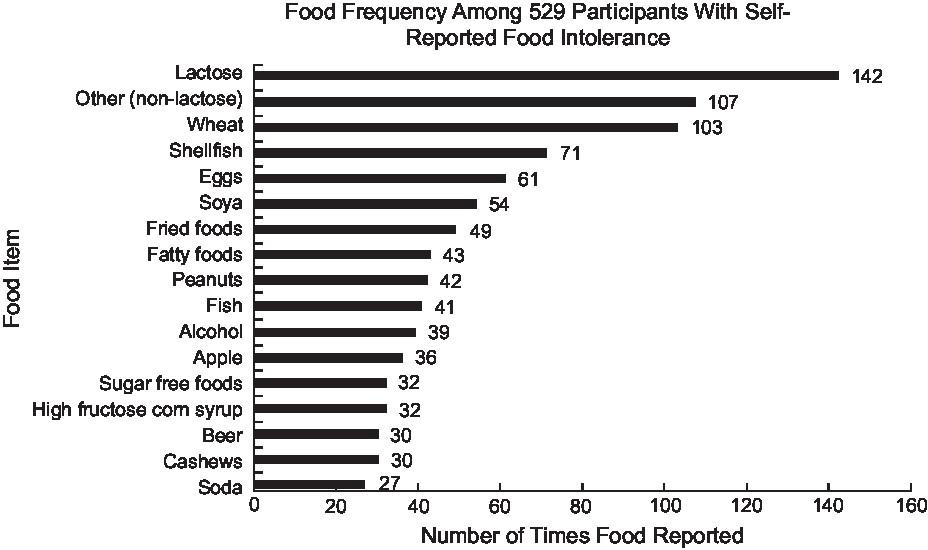
Fig. 1 Food frequency among 529 participants with self-reported food intolerance
Discussion
In our study, the prevalence of self-reported food intolerance among US-based internet-user adults was 24·8 %. Over a quarter of those with a food intolerance listed lactose as the culprit food; there were many individuals who acknowledged an intolerance to milk or dairy either with or without other food intolerances. Higher rates of food intolerance were reported in younger individuals, females, non-Caucasians and in respondents with increased prescription medication use. Not surprisingly, we found lactose intolerance was common as a majority of individuals, particularly ethnic minorities, are lactase non-persisters; however, not all who produce less of the enzyme manifest symptoms as dose, dilution, gut transit, colonic microbiota and sensitivity to fermentation products all play a role in symptom manifestation or lack thereof. It is notable that the lactose intolerance rate in our study was found to be lower than prior reports, which may have been due to the survey format requiring lactose-containing foods to be written in as a response.
Strengths of this study include its large sample size, use of quality control methods and diverse geographic coverage. Participant age ranged from 18 to 79 years. More than 25 % of the population was non-Caucasian, and 9·1 % were Hispanic. All fifty states and the District of Columbia were represented.
Study limitations include its survey-based nature. This design assessed self-reporting of food intolerance which could not be confirmed by a health professional. The self-reported paradigm employed in our study means that selection bias is a concern, which could manifest as over-reporting of food intolerance. Additionally, no formal definition for food intolerance was provided so results may encompass non-gastrointestinal adverse reactions to foods such as anaphylaxis, oral allergy syndrome and others. However, the primary study objective was to estimate the prevalence of perceived food intolerance as defined by the individual among a large nationwide sample of US-based adults. This sample may not be fully representative of the US population as we had many respondents between the late 20s and early 40s. While this may capture a common demographic for internet users, these data may not be generalisable to the population as a whole; however, a majority of US adults have internet access and mTurk has been shown to be at least as representative of the US population as traditional subject pools. Our survey may have captured individuals diagnosed with irritable bowel syndrome, as the rate in the US is approximately 5–9·9 %, as well as healthy individuals in the general public(Reference Lovell and Ford19). Additionally, we asked both about foods and food components (high-fructose corn syrup) or cooking methods (fried foods) which may have provided information on food preparation and ingredients as well as specific foods themselves, but this mix of items is often found on food-related questionnaires in the literature.
The questions asked and answers received are useful in informing future survey development. In designing a more detailed survey, it will be important to ask participants what the term food intolerance means to them and the specific nature of their symptoms. It may be important to define the term for survey takers in order to be more specific as opposed to sensitive. Severity measurements and impact on quality of life will be key to decipher. Inquiring about reproducible reactions and those that led to restricted food intake will provide useful information. Reports of any formal medical evaluation or testing will be of interest to determine how frequently perceived food intolerance is verified or assessed by a medical professional. From a broader perspective, it may also be relevant to consider the role of a changing environment and agricultural or farming practices on the development and prevalence of food intolerance in the general population. It is our hope that these preliminary and exploratory data draw some attention to the issue of food intolerance and informs upcoming research in the area.
Our findings suggest self-perceived food intolerance is common in the US and may affect one in four adults. These perceptions may have important consequences on nutritional adequacy and could play a role in numerous health-related issues including gastrointestinal diseases and symptoms. The nature and severity of food intolerances and their associated health impact warrant further study.
Acknowledgements
Acknowledgements: None. Financial support: Division of Gastroenterology and Hepatology at Indiana University. A.S. is supported by NIH K23DK122015. Conflicts of interest: Authors have no disclosures. Authorship: Study concept and design (C.J.K. and A.S.), data management and conduct of study (M.W.), data interpretation (C.J.K., M.W. and A.S.), administrative support and study coordinator (C.L.), statistical analysis (H.X.), drafting of manuscript (C.J.K.) and critical revisions to manuscript (C.J.K., M.W., C.L., H.X. and A.S.). Ethics of human subject participation: This study was conducted according to the guidelines laid down in the Declaration of Helsinki, and all procedures involving study participants were approved by approved by the Indiana University Institutional Review Board (IRB-1811552678). Consent for study participation was implied if individuals chose to participate after review of the study information sheet. Availability of data and materials: Study data are de-identified and stored on RED-CAP. Consent for publication: We consent to publication of this article.
Supplementary material
For supplementary material accompanying this paper visit https://doi.org/10.1017/S1368980020003298


