


Not only in developed countries, the obesity pandemic and its related secondary diseases are an increasing burden for social care systems, economic productivity and individual quality of life(1). People suffering from overweight and obesity have a higher risk of dying prematurely(2), developing cardiometabolic multimorbidity(Reference Kivimäki, Kuosma and Ferrie3), Alzheimer’s disease(Reference Beyer, Kharabian Masouleh and Huntenburg4) and pancreatic and breast cancer(Reference Schwingshackl, Schwedhelm and Galbete5,Reference Zheng, Guinter and Merchant6) . With its unrelieved growth of about 1 % per year(7), the obesity pandemic puts a serious and increasing burden of direct and indirect costs on social security systems as well as tangible and intangible costs on individuals(1,Reference Konnopka, Dobroschke and Lehnert8) . In contrast, a balanced diet is expected to reduce obesity-induced morbidities and all-cause mortality(Reference Schwingshackl, Bogensberger and Hoffmann9).
Various theoretical approaches have been used to explain diet quality and its health outcomes(Reference Cawley, Ruhm, Pauly, McGuire and Barros10,Reference Muff11) . The two most prominent hypotheses derived from them are the ‘social causation hypothesis’ and the ‘health selection hypothesis’. While the former theorises that manifold socioeconomic, sociodemographic and sociocultural factors drive health outcomes of diets like corpulence, the health selection hypothesis interalia assumes that nutritional health outcomes predict social outcomes. So far, evidence for the relative empirical validity of these seemingly opposing hypotheses is inconclusive and fragmented(Reference Kröger, Pakpahan and Hoffmann12). Moreover, the social causation hypothesis often implicitly assumes a direct deterministic link between diet quality and corpulence. For that reason, most studies testing the social causation hypothesis directly regress nutritional health outcomes on social factors, for example, BMI on socioeconomic status (SES). However, for the identification of the causal nutritional socio-epidemiological mechanisms, this approach oversimplifies, as it disregards the biological causation path regressing health outcomes on diets. Only the inclusion of this path guarantees a comprehensive insight in the causal relationships in a so-called ‘nutrition cycle’ (see Fig. 1), where social factors are hypothesised to predict diet quality (social causation (a)); nutrition impacts corpulence (biological causation (b)); and corpulence affects social outcomes (health selection (c)). This causal spiral in time can be viewed as both intragenerational, explaining intrapersonal life courses, and intergenerational, referring to the (epi)genetic and social inheritance of health chances.
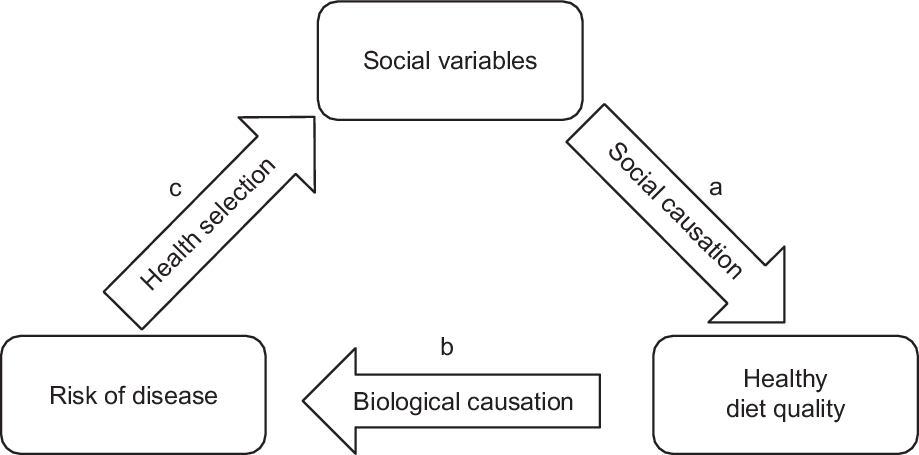
Fig. 1 The nutrition cycle
Social determinants of diet quality (a) are hypothesised to be manifold(Reference Cawley, Ruhm, Pauly, McGuire and Barros10,Reference Fekete and Weyers13,Reference Reisch, Gwozdz, Hirschfelder, Ploeger and Schönberger14) . They range from individual and contextual socioeconomic factors (e.g. SES, employment status, healthy food availability) to sociodemographic factors (e.g. sex, age, migration background) to sociocultural factors (e.g. sex, migration background and regional diet imprints of origin) and other factors (e.g. physical activity and psychological problems)(Reference Fekete and Weyers13). In this vein, social factors affecting nutrition outcomes could also be subsumed to categories such as affordability, availability and accessibility of foods. This so-called ‘triple-A’ model(Reference Reisch, Gwozdz, Hirschfelder, Ploeger and Schönberger14) is a synthesis of the principles of behavioural economics and human–ecological setting approaches(Reference Story, Neumark-Sztainer and French15) to model the dimensions of individual dietary decisions: Affordability comprises both direct costs and opportunity costs of foods. Availability refers to the availability of foods, as well as to the surrounding opportunity structure, and thus to the contextual features of a social space. Finally, accessibility encompasses internalised cultural knowledge and the associated scripts. More specifically, accessibility refers to characteristics like educational background or attainment, as well as to normative attitudes and associated characteristics as regards the socioeconomic and sociocultural attributes of foods(Reference Mader, Rubach and Schaecke16).
Generally, information on key drivers of the ‘nutrition cycle’ is vital for effective explicit and implicit behavioural political interventions targeted at the reduction of obesity prevalence and health promotion(Reference Mertens, Clarys and Mullie17,Reference Solbak, Xu and Ven18) . Yet, causal empirical evidence on the ‘nutrition cycle’ is sparse. So far, there are only six studies that analyse population-based socio-epidemiological panel surveys with measurements of all relevant variables at all points in time for either (a)(Reference Rummo, Guilkey and Ng19,Reference Zagorsky and Smith20) , or (b)(Reference Mertens, Deforche and Mullie21–Reference Cespedes Feliciano, Tinker and Manson23), or (c)(Reference Michaud and van Soest24) and applying panel regression models (see Table 1).
Table 1 Summary of the state of research for the nutrition cycle applying causal inference

FE, fixed effects panel regression; NPS, national panel survey; CAR, complete age range; n, number of subjects; LoC, level of confidence; Avail., Availability; Access., Accessibility; →, no effect; ↗, positive effect; ↘, negative effect; u, u-shaped effect; –, low; o, middle; WC, waist circumference; SES, socioeconomic status; BE, Belgium.
All six presented studies advantageously use panel data applying multiple panel regression models. Nonetheless and besides individual weaknesses, these six studies have some limitations in common: first, five of the studies are based on data from the United States(Reference Rummo, Guilkey and Ng19,Reference Zagorsky and Smith20,Reference Fung, Pan and Hou22–Reference Michaud and van Soest24) ; only one study stems from another country (Belgium)(Reference Mertens, Deforche and Mullie21). Hence, the state of research on the nutrition cycle is geographically restricted to two countries. Second, none of the six studies includes time dummies as confounders that would account for overall time trends (i.e. overall time-varying unobserved heterogeneity). Third, none of the six studies covers the full age range. Fourth and finally, all of the six studies are limited to the analysis of only one of the analytical paths of the nutrition cycle ((a) or (b) or (c)).
Data and methods
Hence, this study aims at overcoming these limitations and acquires a comprehensive insight into the whole nutrition cycle by analysing two German socio-epidemiological survey panel datasets utilising hybrid generalised linear mixed panel regression models: two waves of the German Health Interview and Examination Survey for Children and Adolescents (KiGGS) aged 0–24 years (n 17 640) between 2003 and 2012, and five waves of the German National Nutrition Monitoring (NEMONIT)(25) panel study for 15- to 82-year-olds (n 2610) surveyed between 2005 and 2013. Both KiGGS and NEMONIT datasets consist of random samples of the German population and together cover an age range from 0 to 82 years as well as an observation period of about a decade between 2003 and 2013. KiGGS 0 received ethical approval from the German Federal Data Protection Office and the Ethics Committee of Charité University Medicine(Reference Truthmann, Mensink and Richter26). KiGGS 1 received ethical approval from the Hanover Medical School’s ethics committee and the Federal Commissioner for Data Protection and Freedom of Information(Reference Mauz, Gösswald and Kamtsiuris27). NEMONIT received ethical approval from the German Federal Data Protection Office(Reference Gose, Krems and Heuer28). Written informed consent was obtained in detail from the respondents in all of the three studies(Reference Truthmann, Mensink and Richter26–Reference Gose, Krems and Heuer28).The central characteristics of KiGGS and NEMONIT panels, also with regard to the measurement of central characteristics for this study, are summarised in Table 2. The online Supplemental Tables S1, S2, S3 and S4 in the Supplementary Material show descriptive statistics and measurement descriptions of all variables included in the analyses.
Table 2 Comparison of central data characteristics
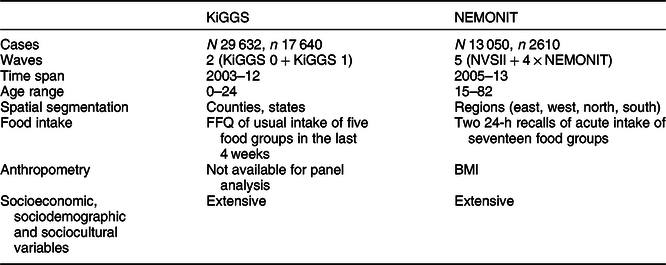
KiGGS, German Health Interview and Examination Survey for Children and Adolescents; NEMONIT, German National Nutrition Monitoring; NVSII, National Nutrition Survey II; ‘n’ refers to the number of individuals, and ‘N’ to the number of observations (‘n’ times the number of years ‘T’); data sources: KiGGS panel from Robert Koch-Institute; NEMONIT from Max Rubner-Institute(25).
Affordability and availability contexts
The comparatively large number of cases and sample points in the KiGGS panel allows a relatively fine-grained spatial segmentation and, therefore, the analysis of effects of affordability and availability contexts on diet quality: County- and state-level data on average disposable income per capita (p.c.) from the Regional Database Germany of the statistical offices of the confederation and the federal states were merged with the KiGGS data. County-level data on the number of retail firms and firms in the food service industry p.c., and on the factory area of trade and industry p.c., were also added from the Regional Database Germany. These three context indicators are used to approximate the variety of healthy food supply, as purchasing power is an important location factor for food retailers. Moreover, the number of firms and sales area are associated with product variety(29).
Food intake
As the concept of ‘healthy nutrition’ is widely disputed and operationalised in manifold ways, in this study we provide a diverse selection of indicators of a healthy diet. The two datasets differ in the measurement of food intake: In the KiGGS panel, the usual intake of only five food groups (fruits, vegetables, juices, sweetened soft drinks and sweets) is measured with a food frequency questionnaire (FFQ) retrospectively for the last 4 weeks(Reference Mensink and Burger30) in both available waves. However, there is no fundamental restriction for the calculation of indicators of intake quality, for example, following the concept of the Healthy Nutrition Score for Kids and Youth (HuSKY; see Kleiser et al. (Reference Kleiser, Mensink and Scheidt-Nave31) for details). HuSKY is a Healthy Eating Index (HEI) specially designed for children and adolescents in accordance with the food group-specific intake recommendations of the Optimised Mixed Diet(Reference Alexy, Clausen and Kersting32,Reference Kersting, Alexy and Clausen33) . In addition, the Healthy Food Diversity (HFD) Index(Reference Drescher, Thiele and Mensink34) can be calculated from the relative recommended intake ratio of amply recommended (here fruits, vegetables and juices) to tolerated (i.e. foods with high energy density (ED) and low nutrient content – here sweetened soft drinks and sweets) food groups according to the Optimised Mixed Diet.
By contrast, in the NEMONIT panel, the acute intake of seventeen food groups of the previous day is surveyed via two 24-h recall telephone interviews(Reference Slimani, Deharveng and Charrondiere35). As the acute food intake varies by weekday and season, all models using NEMONIT diet data control for these variables. The comprehensive diet survey in NEMONIT enables the calculation of various indicators of intake quality. First, an HEI in accordance with the dietary recommendations of ten food groups of the German Nutrition Society (DGE)(Reference Oberritter, Schäbethal and von Ruesten36) could be computed as suggested in Gose et al. (HEI-NVSII, 2016)(Reference Gose, Krems and Heuer28). HEI-NVSII, like other conventional Healthy Eating Indexes, describes intake compliance with dietary guidelines usually on a ratio scale from 0 = ‘no compliance’ to 100 = ‘full compliance’ based on food group-specific recommendations in absolute grams per day. The range of the original HEI-NVSII is 0–110, as the maximum score for fruit and vegetable intake is 15 each instead of 10 for the other food groups included(Reference Gose, Krems and Heuer28). However, this range can be normalised to 0–100. Yet, recommendations in absolute terms depend on, for example, sex, age, body weight and level of physical activity. This introduces substantial assumptions on individual characteristics that could impose risks of producing a methodological artefact. Consequently, we suggest an Optimised HEI-NVSII (O-HEI-NVSII). This is the additive index of compliance with the dietary guidelines of ten food groups based on the sex-specific relative shares of the whole intake (in g/d) on a scale from 0 to 100 taken from Gedrich and Karg(Reference Gedrich, Karg, Oltersdorf and Gedrich37). Thus, O-HEI-NVSII supposedly has the comparative advantage that relative recommendations are only to a relatively small extent prone to individual characteristics. The single prerequisite to compute O-HEI-NVSII is information on the whole daily intake in grams, which is met by NEMONIT, but not by the KiGGS panel. Moreover, HEI are applied to recommendations of macronutrient intake (HEI-MAC)(38) based on relative shares and to guidelines for energy intake (HEI-EN)(39). The HFD index is calculated following Drescher et al. (Reference Drescher, Thiele and Mensink34). Lastly, the average ED in kcal/g is calculated. Owing to the recent discussion about the concept of ED, we compute both the ED of the energetic food intake excluding non-energetic beverages and drinking water (ED1) and the ED of the non-beverage food intake excluding all beverages (ED2)(Reference Drewnowski, Almiron-Roig and Marmonier40,Reference Shrapnel41) .
Anthropometry
The BMI as a measure of corpulence is only available in the NEMONIT panel. Therefore, it is possible to analyse the whole nutrition cycle with NEMONIT, while the social causation path can be analysed for KiGGS. In NEMONIT, the BMI is surveyed as a self-report of body weight and height, while in the NVSII (the first wave of NEMONIT), objective measures were taken, too. However, the self-reported and the objective BMI are correlated very highly (Spearman’s r s = 0·98; Pearson’s r p = 0·99; n 2551), and the distributions are virtually identical (objective measure: mean 25·9, sd 4·8, minimum 15·8, maximum 57·8; self-report: mean 25·4, sd 4·5, minimum 16·0, maximum 56·2; n 2551). The same applies to the underlying measurements of body height and weight. This indicates a high external validity of self-reported BMI.
Social variables
Finally, socioeconomic, sociodemographic and sociocultural variables are surveyed in detail in KiGGS (educational background, parental job position, parental employment status, household size, sex, age and migration background) as well as in NEMONIT (educational attainment, job position, employment status, partnership status, household size, sex and age). All the variables included in the reported models of Tables 3–7 are described in online Supplemental Tables S1–S4 of the Supplementary Information. As the online Supplemental Tables S1 and S3 reveal, diets are not a stable exposition, but underlie considerable variation within subjects over time. The same applies for all other time-varying characteristics shown in online Supplemental Tables S1–S4.
Table 3 KiGGS: generalised mixed-effects regressions: intake quality†
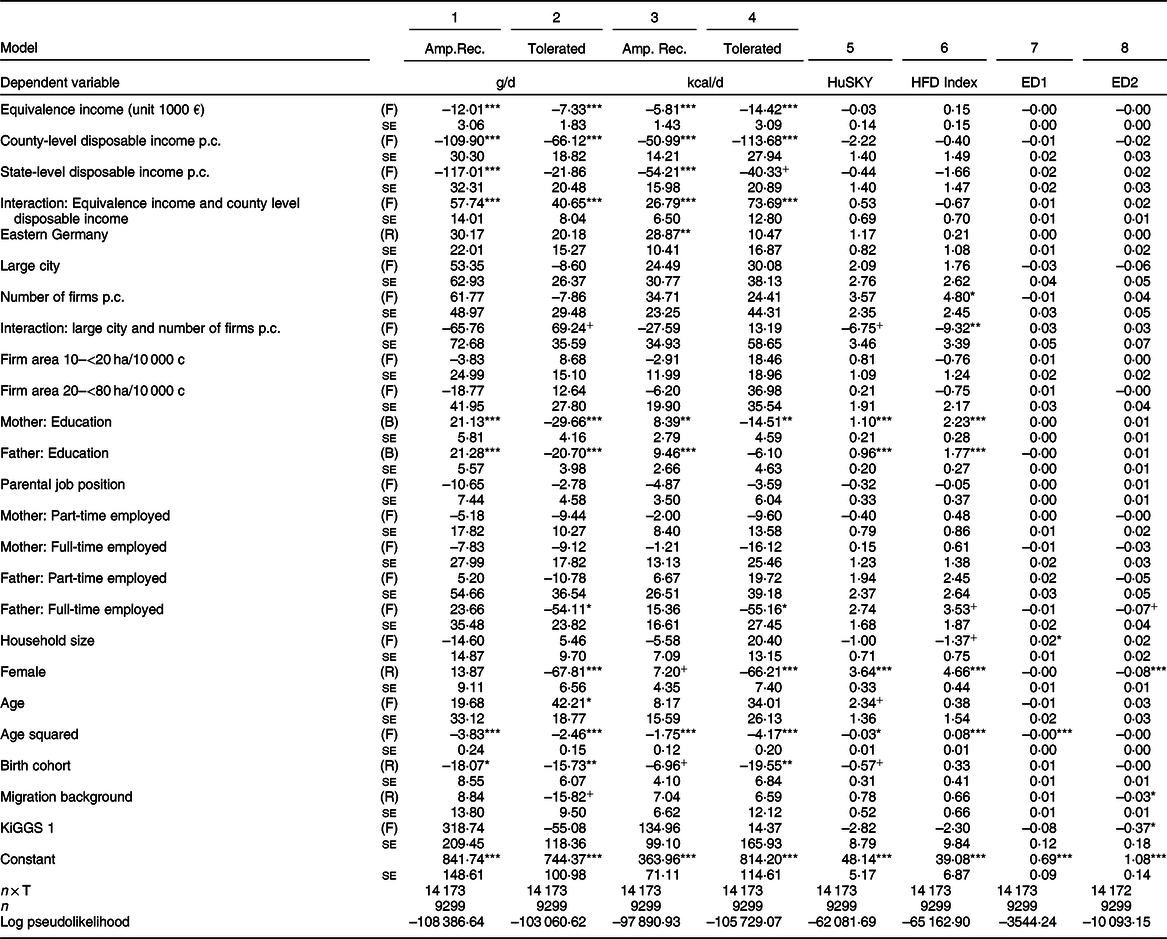
KiGGS, German Health Interview and Examination Survey for Children and Adolescents; amp. rec., amply recommended food group intake (fruits, vegetables and juice); tolerated, tolerated food group intake (sweets and sweetened beverages); HuSKY, Healthy Nutrition Score for Kids and Youth; HFD, Healthy Food Diversity; ED1, energy density (non-beverages and caloric beverages); ED2, energy density (non-beverages only).
+, P < 0·10; *, P < 0·05; **, P < 0·01; ***, P < 0·001.
† Unstandardised regression coefficients with their standard errors. R stands for random, F for fixed and B for between effect. All standard errors are clustered by individual and, therefore, robust with respect to heteroscedasticity and autocorrelation. Data source: KiGGS panel from Robert Koch-Institute.
All in all, the available KiGGS panel only enables the analysis of the social causation path, while all three paths of the nutrition cycle can be analysed with the available NEMONIT panel data. It should be noted that a conceivable alternative for NEMONIT could be the German Health Interview and Examination Survey for Adults (DEGS). However, NEMONIT has more available observation waves than DEGS, and in DEGS, food intake is not measured identically in all waves.
Analytics
Concerning the analytics, fixed effects (FE) panel regression exploits the longitudinal data structure of panels as it only takes variations within the individuals’ life courses into account. Thus, the FE estimator is unbiased in the presence of cross-sectional unobserved heterogeneity affecting both the observed covariates and the outcome(Reference Brüderl, Ludwig, Best and Wolf42,Reference Wooldridge43) . If the strict exogeneity assumption holds, the FE regression adequately estimates unbiased causal effects of the covariates on the outcome(Reference Vaisey and Miles44). For instance, this enables the identification of the effect of ageing on dietary quality while controlling for birth cohort categories or whether an increase in dietary quality induces a decrease in BMI. However, it is still common practice in most of the epidemiological prospective cohort studies not to regress changes in the outcome on changes in the covariates. This practice implicitly assumes that diets are a time-invariant exposition and remain stable over the individuals’ life courses(Reference Mertens, Deforche and Mullie21). This assumption is not empirically valid, as the KiGGS and NEMONIT data as well as Mertens et al. (Reference Mertens, Clarys and Mullie17) demonstrate.
Nevertheless, standard FE models can only estimate the effects for time-varying variables and do not allow the inclusion of time-invariant characteristics. The generalised linear mixed panel regression model (so-called hybrid model)(Reference Allison45,Reference Schunck and Perales46) simultaneously estimates fixed, between and random effects. Thus, the hybrid model enables the inclusion of both time-varying (e.g. income) and time-invariant (e.g. migration background) variables in the same model. As it is true for the FE model, the hybrid model’s FE estimates are unbiased, if the strict exogeneity assumption holds(Reference Vaisey and Miles44). Given the outlined advantages of the hybrid model, it is applied throughout the analyses. The specification of the hybrid model and an overview of the sensitivity analyses performed for all the reported regression results can be found in the supplement.
Results
Overall, the results indicate that sex, education and age explain diet quality. Increases in the newly developed O-HEI-NVSII and in nuts intake reduce BMI, while growing overall energy intake, lemonade, beer, meat and meat product intakes drive corpulence. In turn, developing obesity decreases SES. The results of the analyses for social causation, biological causation and health selection path are explained in more detail below.
Social causation
The social causation path could be analysed for both the KiGGS and NEMONIT panels. As an introspection of Tables 3 and 4 consistently reveals, girls and women generally eat healthier (as measured by HuSKY and HEI) and have more diverse diets (as measured by the HFD Index) than boys and men. Moreover, children and adolescents with parents of high educational attainment have healthier and more diverse diets than peers with low educational background (see Table 3). The same applies to the educational attainment of adults. Furthermore, the dietary diversity of adults decreases with increasing age controlling for 2-year birth cohort categories (see Table 4).
Table 4 German National Nutrition Monitoring (NEMONIT): generalised mixed-effects regressions: intake quality†

O-HEI-NVSII, Optimised Healthy Eating Index (HEI); HEI-MAC, HEI based on macronutrient (MAC) intake recommendations; HEI-EN, HEI based on overall energy (EN) intake recommendations; HFD, Healthy Food Diversity; ED1, energy density (non-beverages and caloric beverages); ED2, energy density (non-beverages only).
+, P < 0·10; *, P < 0·05; **, P < 0·01; ***, P < 0·001.
† Unstandardised regression coefficients with standard errors. R stands for random, F for fixed and B for between effect. All standard errors are clustered by individual and, therefore, robust with respect to heteroscedasticity and autocorrelation. Data source: NEMONIT from Max Rubner-Institute(25).
In addition, in KiGGS, we observe an interaction effect between individual equivalence income and the average disposable county-level income on intake. With increasing individual income and high average disposable income in the county of residence (20 000–38 000 € per year), the intake of tolerated foods rises, while there is no relation for middle county income (15 000–<20 000 € per year) and a negative relation for low county income (10 000–<15 000 € per year) (see Fig. 2). Interestingly, this interaction effect is not statistically significant for the intake of amply recommended food groups (see Fig. 3).

Fig. 2 KiGGS: Predictive margins of equivalence income for tolerated food group intake by county-level disposable income (model 4 of Table 3) with 95 % CI. The figure displays the interaction effect of equivalence income and county-level disposable income on tolerated food intake. Data sources: KiGGS panel from Robert Koch-Institute; country-level disposable income from Regional Database Germany of the statistical offices of the confederation and the federal states
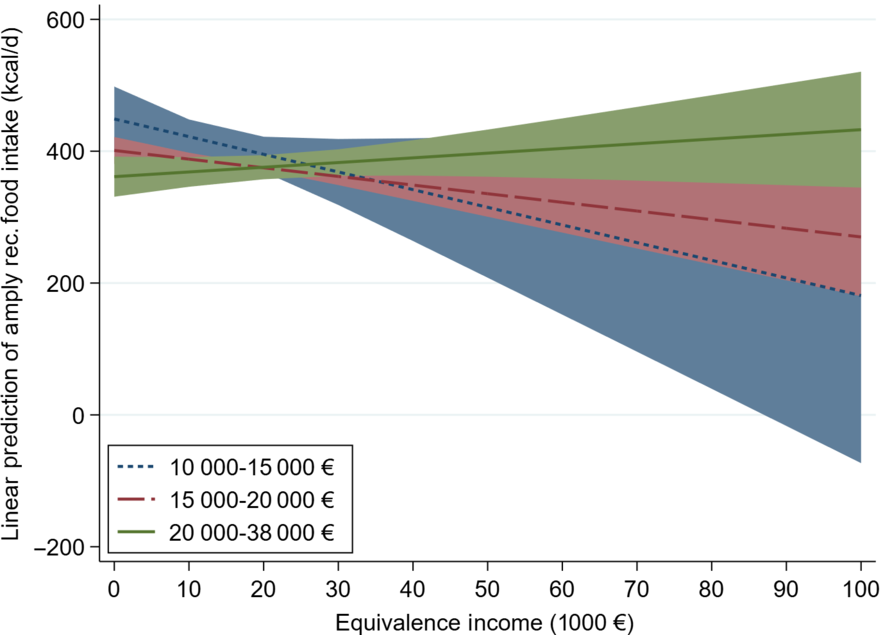
Fig. 3 KiGGS: Predictive margins of equivalence income for amply recommended food group intake by county-level disposable income (model 3 of Table 3) with 95 % CI. The figure displays the interaction effect of equivalence income and county-level disposable income on amply recommended food intake. Data sources: KiGGS panel from Robert Koch-Institute; country-level disposable income from Regional Database Germany of the statistical offices of the confederation and the federal states
For adults in NEMONIT, we found no effect of individual equivalence income on intake. Moreover, adults living in eastern Germany have higher HFD Index values than people living in the rest of Germany, indicating higher food diversity in eastern Germany (see Table 4).
Neither in KiGGS nor in NEMONIT, the triple-A model can explain the ED of diets as measured by ED1, including energetic beverages (see model 7 of Table 3 and model 5 of Table 4). As an introspection of model 8 of Table 3 and model 6 of Table 4 reveals, girls and women have a lower average ED when computed excluding all beverages (ED2).
All other variables included in the models do not substantially and consistently relate to healthy and diverse nutrition comparing the models using different indicators of diet quality (see Tables 3 and 4).
Biological causation
The analysis of the biological causation path (only possible for NEMONIT) reveals that increases in O-HEI-NVSII and nuts intake reduce BMI, while growing overall energy intake, lemonade, beer, meat and meat product intakes increase BMI (see Tables 5 and 6).
Table 5 German National Nutrition Monitoring (NEMONIT): generalised mixed-effects regressions of BMI: 1†
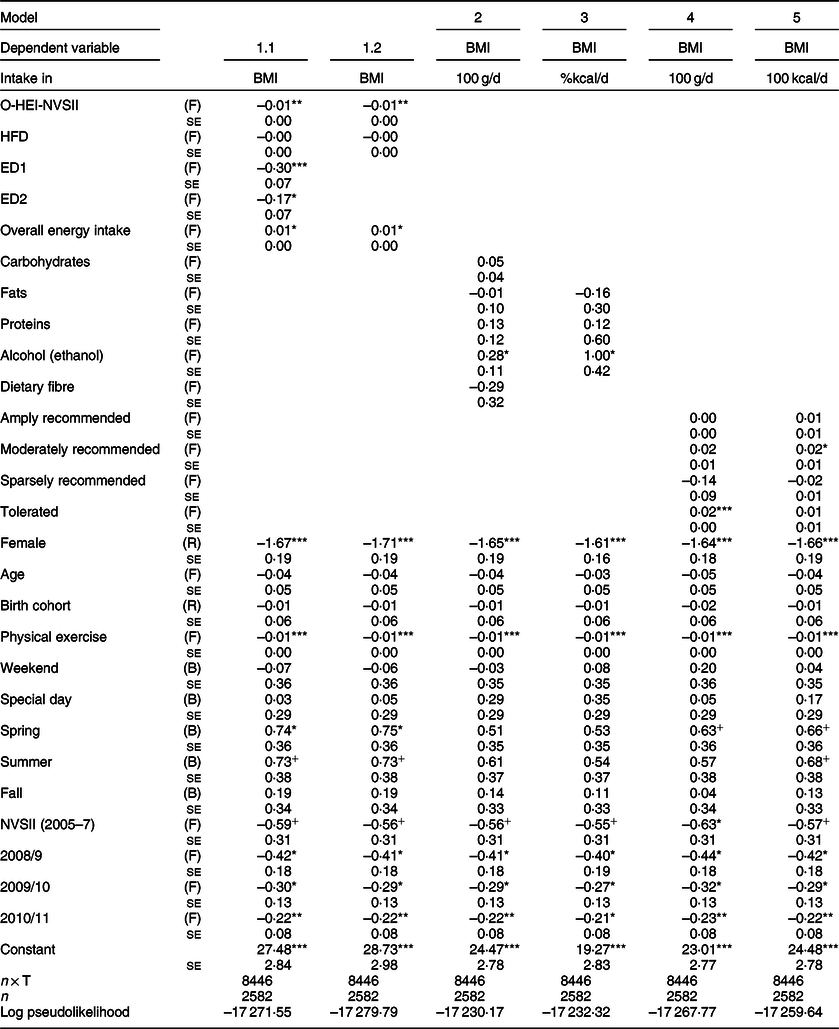
O-HEI-NVSII, Optimised Healthy Eating Index (HEI); HFD, Healthy Food Diversity; ED1, energy density (non-beverages + energetic beverages); ED2, energy density (non-beverages).
+, P < 0·10; *, P < 0·05; **, P < 0·01; ***, P < 0·001.
† Unstandardised regression coefficients with standard errors. R stands for random, F for fixed and B for between effect. All standard errors are clustered by individual and, therefore, robust with respect to heteroscedasticity and autocorrelation. Data source: NEMONIT from Max Rubner-Institute(25).
Table 6 German National Nutrition Monitoring (NEMONIT): generalised mixed-effects regressions of BMI: 2†
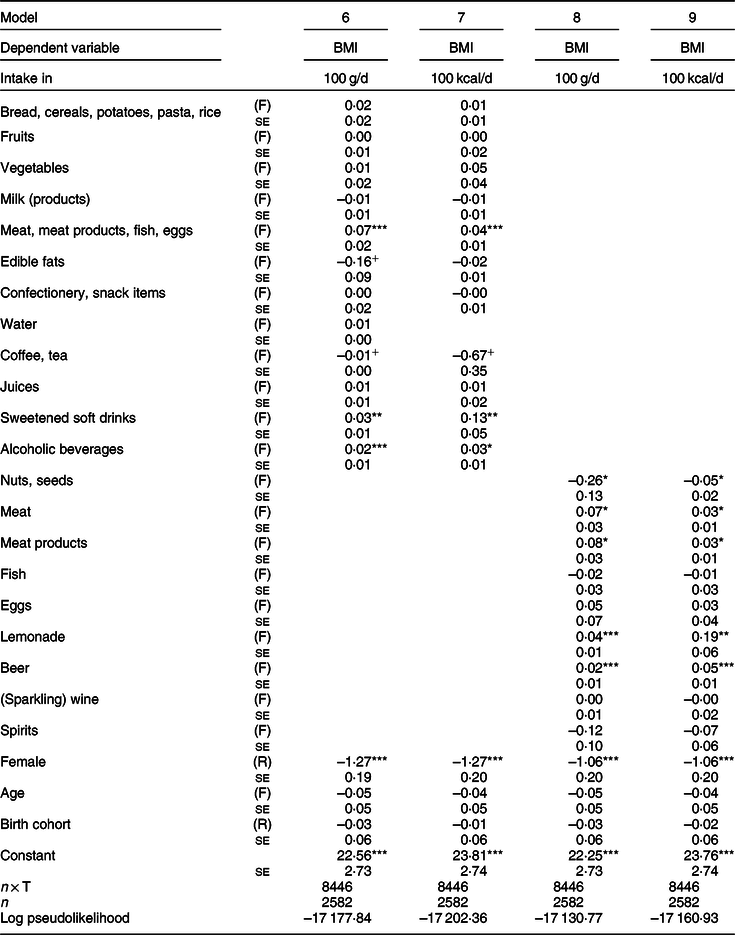
+, P < 0·10; *, P < 0·05; **, P < 0·01; ***, P < 0·001.
† Unstandardised regression coefficients with standard errors. R stands for random, F for fixed and B for between effect. All standard errors are clustered by individual and, therefore, robust with respect to heteroscedasticity and autocorrelation. All models additionally control for physical exercise, observation waves, weekend, special day and the seasons. Models (8) and (9) additionally control for all other food group-specific intake. Data source: NEMONIT from Max Rubner-Institute(25).
Table 7 German National Nutrition Monitoring (NEMONIT): generalised mixed-effects regressions for Germany: socioeconomic status†

+, P < 0·10; *, P < 0·05; **, P < 0·01; ***, P < 0·001.
† Unstandardised regression coefficients with standard errors. R stands for random, F for fixed and B for between effect. All standard errors are clustered by individual and, therefore, robust with respect to heteroscedasticity and autocorrelation. The estimation of a model regressing education on obesity status was not possible because there is little within-variation in educational attainment over time. Data source: NEMONIT from Max Rubner-Institute(25).
As models 1.1 and 1.2 of Table 5 show, a healthier diet decreases BMI. This indicates that O-HEI-NVSII has some predictive validity. Nevertheless, the effect is very small. Per ten index points healthier diet, BMI decreases by 0·10. However, this is not the case for increases in intake diversity, as the HFD Index is not related to BMI in NEMONIT. Most surprisingly at first glance, growing ED yields BMI losses net of overall energy intake, which has a relatively small positive effect on BMI. The effect of ED, including non-beverage food groups and energetic beverages, is around twice as large as the effect of ED, including non-beverage food groups only.
Models 2 and 3 of Table 5 reveal that independent from all other macronutrients, only increases in alcohol consumption increase BMI substantially. As the food group-level analyses of the models 8 and 9 of Table 6 expose, this effect is only attributable to increases in beer consumption controlling for (sparkling) wine, spirits and all other food group-specific intake.
Further detailed influences on BMI can be obtained from the food group-specific models in Table 6: being very energy-dense foods, nuts, in combination with their unique composition of a variety of high-quality nutrients, have various health-promoting effects(Reference Ros47). This study confirms clinical trials that suggest that an increase in nuts consumption yields a decrease in visceral adiposity(Reference Ros47). Moreover, rising intakes of lemonade, meat and meat products ceterisparibus drive corpulence, with the effect of lemonade being six times as high as the effects of meat or meat products each. Changes in the intake of other food groups do not affect BMI as it also applies to the categorisation of food groups (see models 4 and 5 of Table 5). Finally, the models in Tables 5 and 6 also show that women have a lower BMI compared to men and that age does not drive corpulence in the NEMONIT panel.
Health selection
In turn, the analysis of the health selection path (only for NEMONIT) reveals that developing obesity leads to losses in SES (see Table 7). Specifically, developing obesity decreases adults’ job position as well as the associated prestige (model 2). However, developing obesity does not affect equivalence income (model 1). Reporting a good health condition is associated with a higher job position, and women earn less and have lower job positions.
Discussion and conclusion
For the first time, this study acquires a comprehensive causal insight into the nutrition cycle by identifying the social causes of healthy diets and its impacts on obesity and SES. We analyse two German socio-epidemiological panel survey datasets (KiGGS and NEMONIT) covering an age range between 0 and 82 years and a time span between 2003 and 2013. We exploit their longitudinal structure utilising hybrid generalised linear mixed panel regression models. Generally, these models have the advantage of being able to cancel out the influence of changes in unobservables affecting both the observed covariates and the outcome. Thus, these models estimate unbiased causal effects (if strict exogeneity is given)(Reference Vaisey and Miles44). In addition, hybrid models allow the inclusion of time-invariant variables.
Altogether, the results for the social causation path (a) indicate that sex, education and age are able to explain healthy diets of German children, adolescents and adults. Women and people with higher educational attainment/background eat healthier and have a more diverse diet. However, ageing is associated with losses in dietary variety starting with adulthood. This finding is new, since former cross-sectional studies were only able to detect cohort effects. Our analysis of panel data can control for birth cohort and hence identify a genuine effect of ageing. Furthermore, this disconfirms the assumption that in youth, increasing peer influence and diminishing parental control over the offspring’s diet makes it unhealthier and one-sided. This refers to the fact that this conception was based on negative cohort effects spotted in cross-sectional studies(Reference Mader, Rubach and Schaecke16).
For income, we spotted an interaction effect between individual equivalence income and average county-level income on the intake of tolerated foods of children and adolescents. This finding might refer to differential availability structures between amply recommended and tolerated food groups in combination with individual social characteristics that lead to self-selection into rich and poor counties beyond the model at hand. Moreover, we found no direct effect of individual income on dietary quality and variety for both KiGGS and NEMONIT. In sum, these results indicate that affordability matters for healthy diets in KiGGS depending on contextual income only and not for NEMONIT. This expands former studies and generally conforms to the findings by Zagorsky and Smith(Reference Zagorsky and Smith20) who discovered no effect of income on fast-food consumption frequency. Food availability was only possible to approximate in KiGGS due to its relatively high number of subjects and sample points. None of the applied indicators (number of retail firms and firms in the food service industry p.c., factory area of trade and industry p.c.) have a substantial effect on intake in German children and adolescents. Also, moving into a large city with more than 100 000 inhabitants is not associated with changes in intake and diet quality, disconfirming the findings of Zagorsky and Smith(Reference Zagorsky and Smith20).
All other factors included in the models referring to the availability and accessibility of foods are not substantially linked to diets. The effects found in the KiGGS panel analysis differ from the cross-sectional analyses for KiGGS that did find differences between subjects’ diets with respect to employment status, migration background and age(Reference Mader, Rubach and Schaecke16). In sum, the applied triple-A model only had limited predictive power in the German context. Moreover, this study could not include further indicators of affordability (e.g. wealth), availability (e.g. number of food outlets within a distance of 1 km from residence) and accessibility (e.g. nutritional health knowledge). Hence, future studies may focus on extending the model.
With regard to the biological causation path (b), for the first time, we thoroughly investigated the effects of changing dietary quality on BMI using a national socio-epidemiological panel study (NEMONIT). We found that increases in a newly developed Optimised Healthy Eating Index (O-HEI-NVSII), which presumably is less prone to assumptions on individual characteristics, slightly decreases BMI, indicating some predictive validity of O-HEI-NVSII. This also confirms the findings of previous studies(Reference Mertens, Deforche and Mullie21–Reference Cespedes Feliciano, Tinker and Manson23). Moreover, and in accordance with clinical trials(Reference Ros47), growth in nuts intake reduces corpulence, pointing to the health-promoting properties of nuts. Growing lemonade, beer, meat and meat product intakes drive corpulence. The findings on the influence of the intake’s average ED are in contradiction to former research with cross-sectional data(Reference Drewnowski, Almiron-Roig and Marmonier40,Reference Karl and Roberts48) and indicate that, despite its intuitive appeal, the ED hypothesis (more ED translates into more BMI) might be flawed because of a potential misconception of the construct of ED that includes the water content of foods. A high ED does not necessarily mean less volume but also dry food items(Reference Drewnowski, Almiron-Roig and Marmonier40,Reference Shrapnel41) . Hence, high overall ED does not necessarily imply low satiation. What is more, there are food items like nuts that have a weight-lowering effect(Reference Ros47), as this study also demonstrates (see Table 6). In all, future research is vital for further validation of this finding.
As a whole, this panel analysis of the biological causation path identifies dietary predictors of corpulence. However, this study is not capable of eliminating the potential confounding influence of (epi)genetic disposition and composition of the gut’s microbiome(Reference Ley, Turnbaugh and Klein49–Reference Sommer, Moltzau Anderson and Bharti53) and other genetic factors(Reference Cohen-Cline, Lau and Moudon54). Thus, future research that takes account of these factors is essential for the validation of the findings.
In turn, the analysis of the health selection path (c) suggests that developing obesity leads to losses in SES. This might refer to both decreases in productivity(Reference Goettler, Grosse and Sonntag55) and weight stigma(Reference Brewis56) that could explain the association between obesity and SES loss. Future research may delve deeper into analysing this mechanism. Figure 4 summarises the empirical results of our analysis of the nutrition cycle for Germany.
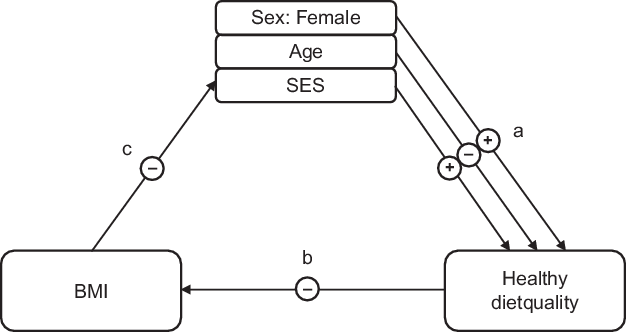
Fig. 4 The nutrition cycle: empirical results for Germany. (a) social causation; (b) biological causation; (c) health selection; +, positive effect; –, negative effect. The results for (a) are based on the panels of the German Health Interview and Examination Survey for Children and Adolescents (KiGGS) and of the German National Nutrition Monitoring (NEMONIT)(25). The results for (b) and (c) are based on NEMONIT only. (a), (b) and (c) apply multiple generalised mixed-effects regressions each
Nevertheless, this analysis has some limitations: First, there is a methodological drawback in the KiGGS panel: the baseline survey used self-administered paper-and-pencil interviews, while in KiGGS 1, all interviews were taken out via telephone. Thus, potential measurement bias cannot be ruled out. However, the KiGGS and NEMONIT analyses substantially lead to the same conclusions. Second, individual intake is surveyed via self-report. Social desirability and limited ability of retrospection might lead to systematic biases especially concerning the descriptive statistics(Reference Hill and Davies57,Reference Westerterp and Goris58) . However, Willett(Reference Willett59) concludes that self-reported diet recall for periods of up to 10 years can be reasonably accurate. Third, panel studies are probably subject to selective attrition. It is plausible that over time, the panel drop-out is selective, for example, leading to an overrepresentation of relatively healthy subjects in the panel sample. The fact that individuals’ health ratings are relatively stable over time might suggest that this is not much of a problem in NEMONIT. In addition, sample selection only leads to bias if both the covariates and the outcome are correlated with self-selection into the sample(Reference Elwert and Winship60). Fourth, the accuracy of BMI in diagnosing obesity in terms of body fat per cent is limited. Hence, future panel studies might utilise more valid – yet more costly – measurements of body fat per cent like bioelectrical impedance analysis(Reference Romero-Corral, Somers and Sierra-Johnson61). Fifth, the analysis is limited to a time span of about a decade covering only a small part of individuals’ life spans. With socio-epidemiological panels getting longer, future studies will also be able to analyse the nutritional effects on mortality.
On balance, this study suggests that health-promoting policies targeted at the reduction of obesity prevalence may be well advised to focus on boys and men, people with low educational attainment level and background, as well as on the promotion of a healthy diet including nuts intake, and the limitation of lemonade, beer, meat and meat product intakes. The WHO and the Organisation for Economic Co-operation and Development also urge the latter. Both the WHO and Organisation for Economic Co-operation and Development recommend a stricter regulation for advertising unhealthy foods(1,62) , and the WHO favours the implementation of a special tax of at least 20 % on sweetened beverages(Reference Spiller, Zühlsdorf and Nitzko63,Reference Spiller, Zühlsdorf and Nitzko64) . Moreover, the obesity-preventing effect of high levels of education suggests that the establishment of nutritional health equity would probably gain from the further development of setting-based health promotion. Especially advancing communal feeding at educational establishments, from day-care centres to schools, and in office canteens is promising to this end(Reference Spiller, Zühlsdorf and Nitzko64,Reference Hawkes, Smith and Jewell65) . Here, imposing mandatory catering standards could be effective(Reference Spiller, Zühlsdorf and Nitzko64). Furthermore, the design of decision architecture (i.e. ‘nudging’) is promising, as it is supposed to be more effective than traditional means of prevention(Reference Kenning and Reisch66–Reference Thorgeirsson and Kawachi68). Nudging measures like the prominent placing of healthy food items in canteens and grocery stores generally do not involve a social gradient in effectivity, as, for example, it is the case with a traffic light-like labelling of foods(Reference Hawkes, Smith and Jewell65,Reference Thorgeirsson and Kawachi68–Reference Glanz, Bader and Iyer70) . Thus, nudging people into healthy diets may guarantee the primary aims of health promotion – individual autonomy of action and equality of opportunity. However, the challenge remains not only to make the healthy choices the easy choices but also to make them the preferred ones(Reference Hawkes, Smith and Jewell65). A promising avenue to attain this goal could be the placing of positive incentives via the implementation of consumer rewards for the purchase of healthy food items, for example, as part of loyalty cards of big grocery retailers(Reference Willett, Rockström and Loken71).
Conclusions
For the first time, this study gains a comprehensive causal insight into the nutrition cycle by identifying the social causes of healthy diets and its impacts on health and wealth in Germany. In all, the results indicate that girls and women, and people with high educational attainment level and background, are less corpulent than boys and men and people with low education. Healthy diets, including nuts intake, promote the reduction of obesity prevalence, while the intake of lemonade, beer, meat and meat products counteracts it. All told, this study advises further research to validate the findings and derive sound recommendations for political action using rigorous panel regression models and more accurate panel data. Many other longitudinal panel studies, especially in Europe and the United States, are still waiting for their longitudinal potentials to be exploited and made fruitful for causal inference.
Acknowledgements
Acknowledgements: S.M. thanks Prof Dr Axel Franzen (Institute of Sociology, University of Bern), Dr Gert Mensink (Robert Koch-Institute Berlin) and two anonymous referees for helpful comments and suggestions, and the Max Rubner-Institute and Dr Gert Mensink for making the datasets available and accessible for analysis. Financial support: This study was funded by the Bavarian State Ministry for Nutrition, Agriculture, and Forestry (StMELF) within the project ‘Nutrition in Bavaria and Its Costs’ (‘Ernährungsverhalten in Bayern und seine Folgekosten’, project number A/15/32) of the Competence Centre of Nutrition (KErn) at the Bavarian State Research Center for Agriculture. NVS II and NEMONIT were funded by the German Federal Ministry of Food, Agriculture and Consumer Protection. Conflict of interest: None. Authorship: S.M. developed the concept of the article, analysed the data and wrote a first draft of the manuscript. M.R., W.S. and C.R. also co-developed the concept of the article and revised the manuscript. I.F. and E.-M.T. also revised the manuscript. Ethics of human subject participation: Not applicable.
Supplementary material
For supplementary material accompanying this article visit https://doi.org/10.1017/S1368980019004877


