


Food insecurity remains a major public health challenge worldwide(1), and it is defined as ‘limited or uncertain availability of nutritionally adequate and safe foods or inability to acquire food in socially acceptable ways’(2). Household food insecurity (HFI) is the application of this concept at the family level, whereby individuals within a household are the main concern(Reference Hamad and Khashroum3). Research has shown that HFI is associated with adverse physical and mental health outcomes among adults and children, particularly women(Reference Maynard, Andrade and Packull-McCormick4,Reference Seligman, Laraia and Kushel5) . HFI has also been linked to inadequate dietary behaviours and increased risk of chronic diseases, such as obesity, heart disease, hypertension and diabetes, among women(Reference Laraia6), which may depend on diet quality(Reference Seligman, Laraia and Kushel5,Reference Parker, Widome and Nettleton7) . In addition, women suffering from HFI are more likely to have mental health problems, such as mood disorders, depression and anxiety(Reference Weaver and Hadley8).
Women remain particularly vulnerable to the adverse nutrition and health outcomes of HFI, and thus require particular attention. First, women in many cultural contexts have limited access to key resources, education, and health services, which minimises their opportunities to earn an income and weakens their role in decision-making and accessing food at the household level(Reference Gittinger, Chernick and Horenstein9). In addition, traditional gender roles enlist women as caregivers responsible for food production and preparation at the household level. In this context, women have been reported to compromise their own dietary intake to ensure the nutrition and health of their children and family members and protect them from the consequences of HFI(Reference Ivers and Cullen10). In fact, studies show that mothers in food-insecure households resort to risky coping strategies, such as limiting portion sizes at meal times, reducing the number of meals per day or skipping meals to ensure that their children are not suffering from hunger(Reference Dammann and Smith11,Reference McIntyre, Tarasuk and Li12) .
Food insecurity has been a well-known cause for undernutrition among vulnerable groups, including women of reproductive age(Reference Weigel, Armijos and Racines13–Reference Pérez-Escamilla, Segall-Corrêa and Kurdian Maranha18); yet in recent decades, the relationship of food insecurity with obesity has become of public health concern. In fact, the paradoxical relationship between HFI and obesity among women has been well documented within high-income countries(Reference Franklin, Jones and Love19–Reference Martin-Fernandez, Caillavet and Lhuissier21); nevertheless, this relationship is less conclusive in low- to-middle- income countries (LMIC)(Reference Farrell, Thow and Abimbola22,Reference Hough and Sosa23) . For example, food-insecure women were at a higher risk of overweight or obesity compared with their food-secure counterparts in countries like Mexico(Reference Morales-Ruán, Méndez-Gómez and Shamah-Levy24,Reference Pérez-Escamilla, Villalpando and Shamah-Levy25) , Brazil(Reference Gubert, Spaniol and Segall-Corrêa26,Reference Schlüssel, Silva and Pérez-Escamilla27) , Korea(Reference Chun, Ryu and Park28), Iran(Reference Ryan-Ibarra, Sanchez-Vaznaugh and Leung29,Reference Rezazadeh, Omidvar and Eini-Zinab30) and Lebanon(Reference Jomaa, Naja and Cheaib14); nevertheless, this was not the case in other countries like Colombia(Reference Isanaka, Mora-Plazas and Lopez-Arana31) and Ecuador(Reference Weigel, Armijos and Racines32). The lack of consistency in results can be attributed to economic, social, cultural and environmental differences among the population groups and settings where these studies were conducted. In addition, dissimilarities in the stages of nutrition transition witnessed by these countries may have also contributed to the mixed evidence. Thus, further research is needed to examine the association between HFI and maternal overweight and obesity within LMIC.
Lebanon represented a unique setting to conduct the current study. It is a middle-income country that has been witnessing a remarkable increase in obesity prevalence among its population, accompanied with a rapid nutrition transition characterised by a high intake of energy-dense foods and beverages that are rich in fat, added sugars and salty foods. This transition is further paired together with the adoption of more sedentary behaviours(Reference Nasreddine, Naja and Chamieh33–Reference Popkin35). Previous national studies have shown that obesity prevalence increased by 50 % among adult women (≥20 years) in slightly over a decade, reaching almost 29 % of women in 2009 compared with 19·3 % in 1997. In parallel, Lebanon is one of the Middle Eastern countries that has undergone decades of political and economic instabilities due to civil war and unrest. Since the start of the Arab Uprising in 2011, the country has also been struggling with the ramifications of the war in Syria and the high influx of refugees to Lebanon (accounting for 30 % of Lebanon’s population of 4·5 millions)(36). These conditions are often believed to have weakened further the fragile economic, political and social systems of the country, threatening to deteriorate the food and nutrition security status of its population, particularly the most vulnerable groups(37–39). Findings from a cross-sectional study conducted in 2015 showed that 42 % of Lebanese households in the Greater Beirut area were experiencing moderate to severe food insecurity. In the same study, Lebanese mothers from food-insecure households were found to have an elevated risk of dietary inadequacy and increased odds of obesity (OR 1·73; 95 % CI 1·02, 2·92) compared with their food-secure counterparts(Reference Jomaa, Naja and Cheaib14).
The current study aimed to further explore the association of HFI with sociodemographic characteristics, anthropometric measures as well as dietary intake and quality measures of Lebanese mothers using data from a national survey conducted among Lebanese households with children (4–18 years old)(Reference Jomaa, Naja and Kharroubi40). More specifically, the objectives of the study were to examine the associations of HFI with the dietary intake of mothers, assessed by food group consumption, energy and macronutrient intakes, and to explore the relationship between HFI and measures of their dietary quality and diversity as well as odds of maternal overweight status using data from a representative sample of Lebanese households with children. We hypothesised that HFI will be associated with lower dietary quality and diversity and with a higher risk of maternal overweight status in Lebanon.
Methods and materials
Study design and population
Data for the current study were drawn from a national cross-sectional survey of Lebanese households with children aged 4–18 years and their mothers, entitled the Lebanese Food and Nutrition Security Survey (L-FANUS). Data were collected in 2014–2015. A two-stage stratified cluster sampling strategy was followed in L-FANUS, whereby the strata were composed of six Lebanese governorates, including 26 districts (Caza). Neighbourhoods within these districts made up the various clusters, whereby neighbourhoods were composed of 100–150 households. The number of neighbourhoods chosen from each district was based on probability proportional to size sampling using data from the Lebanese Central Administration of Statistics(41). Within each neighbourhood, households were selected using a systematic sampling approach. Further details about the sampling framework were presented elsewhere(Reference Jomaa, Naja and Kharroubi40).
For a household to be eligible to be part of L-FANUS, the following inclusion criteria were considered: (i) the household had to include a mother and one of her children aged 4–18 years; (ii) both mother and child had to be Lebanese (with valid Lebanese identification cards); and (iii) they had to be healthy, i.e., participants self-reported they are not suffering from any chronic illness affecting their dietary intake, or taking medications that could affect their nutritional status. Of the 4076 households contacted in the original survey, 3147 accepted to participate in the study (response rate 77 %) and 1221 households met the eligibility criteria. Of these, 1209 completed the interview. For the purpose of the current study, an analysis was conducted on mothers who had complete dietary data only (n 1204).
The original study was ethically approved by the institutional review board at the American University of Beirut. Informed consent and assent were secured from all participants prior to the start of data collection.
Data collection
Face-to-face interviews were conducted with mothers in the household setting by a team of trained field workers (dietitians) lasting approximately 45 min. A multicomponent questionnaire was used to obtain data on demographic, socioeconomic, anthropometric and dietary characteristics of study participants.
Sociodemographic and household food security status
Data on demographic, socioeconomic and household food security characteristics of study participants were collected, including age of mother, number and age of children in the household, education level of mother and her spouse, monthly household income, household food security status, region of residence and crowding index. The latter is a proxy measure of household socioeconomic status (SES) previously used in Lebanon and other Arab settings, providing consistently reliable results(Reference Jomaa, Naja and Kharroubi40,Reference Melki, Beydoun and Khogali42,Reference Naja, Hwalla and Fossian43) . The crowding index was calculated as the total number of household members divided by the total number of rooms in a household (excluding kitchens, bathrooms and balconies)(Reference Melki, Beydoun and Khogali42). Households with less than two persons per room were considered to have a lower crowding index compared with those with two or more persons per room.
The prevalence of HFI among the study sample was assessed using the Arabic-translated Household Food Insecurity Access Scale (HFIAS), a tool that was previously validated in Lebanon with a high internal consistency (Cronbach’s α 0·91) and reliability after being administered twice with an intraclass correlation coefficient of 0·58, P < 0·05(Reference Naja, Hwalla and Fossian43). The use of experience-based food security scales, such as the HFIAS, has been shown to be valid in LMIC worldwide to measure food insecurity at the individual and household levels. Scales to collect the perceptions and experiences of a member of the household to different aspects of food insecurity in this way have been found to be theory-based and suggested to be necessary indicators for monitoring food insecurity and evaluating food security governance at national and global levels(Reference Pérez-Escamilla44). HFIAS, which was used in the current study, consisted of nine occurrence questions reflecting three different domains of food insecurity: (i) anxiety and uncertainty about food supply, (ii) insufficient food quality and (iii) insufficient food intake and its physical consequences. If the respondent answered ‘yes’ to an occurrence question, a follow-up question was asked to determine whether the condition occurred rarely (once or twice), sometimes (three to ten times) or often (more than ten times) in the past 4 weeks(Reference Coates, Swindale and Bilinsky45). As per the HFIAS measurement and indicator guide, we first categorised households into four levels of HFI (access): food-secure, and mildly, moderately or severely food-insecure. A food-secure household experienced none of the food insecurity (access) conditions, or experienced infrequent worry, whereas households were categorised as increasingly food-insecure if they responded affirmatively to more severe conditions and/or had experienced those conditions more frequently(Reference Coates, Swindale and Bilinsky45). HFI was later recoded in our study into two categories: food-secure v. food-insecure (mild, moderate and severe) households.
Dietary intake
Dietary intake of mothers was assessed by trained dietitians using single 24-h dietary recall of the previous day. In case mothers had an unusual dietary intake in the previous day, they were asked to report the dietary intake on any other typical day within that same week. Interviewers followed the Multiple Pass Food Recall five-step approach, developed by the US Department of Agriculture (USDA), when collecting data on food, beverage and snack intake of mothers during the past 24-h period or another typical day during that week. The five steps included (i) the quick food list recall, (ii) the forgotten food list (including alcoholic and non-alcoholic beverages, sweets, savoury snacks, etc.), (ii) time and occasion at which foods were consumed, (iv) the detailed overall cycle and (v) the final probe review of the food consumed(Reference Moshfegh, Rhodes and Baer46). To assist in assessing the portion sizes and amounts of food consumed by the mothers, standard two-dimensional portion size posters, household measures (cups, spoons and plates) and graduated food models were used (Millen and Morgan; Nutrition 279 Consulting Enterprises). In addition, interviewers obtained information relating to the time of each participant’s meal intake, its preparation methods and the brand of food and beverages consumed, if applicable. Dietary information from the 24-h recalls of mothers was used to assess their dietary intake, as food group consumption, diet quality measured by the Healthy Eating Index (HEI) and Minimum Diet Diversity for Women of Reproductive Age (MDD-W).
Food group consumption
All food items reported in 24-h dietary recalls were grouped into sixteen main food groups and thirteen subgroups based on similarity of their nutritional profiles or their culinary usage, and standardised by study authors (see online supplementary material, Supplemental Table S1). Mixed and traditional dishes, such as lasagne, pizza and sandwiches, were first divided into their single food ingredients and then included within their appropriate food group classification. The mean individual daily consumption of each food group and subgroup was calculated and presented in g/d and as percentage of total daily energy intake (%kilojoules/d) and benchmarked with dietary reference intake (DRI) for age and sex.
Energy and macronutrient intake
Daily energy in kilojoules (kJ) and macronutrient intakes of participants were computed from the collected 24-h recalls using the Nutritionist Pro software (version 5·1·0, 2018; Axxya Systems). The food composition database within this software is based on the USDA National Nutrient Database for Standard Reference, Release 27(47), and further expanded by adding locally consumed foods and recipes(Reference Pellet and Shadarevian48). For the analysis of composite and mixed dishes, standardised recipes were added to the Nutritionist Pro software using single food items. Given that there are no gender- or age-specific DRI for Middle Eastern populations, values arising from the analysed data were compared with the US-based DRI for women, as recommended by the Institute of Medicine(49).
Dietary quality and diversity
Two dietary quality measures were calculated for mothers in the current study: HEI and MDD-W.
HEI is a measure of diet quality that assesses conformance to the Dietary Guidelines for Americans (DGA)(Reference Guenther, Casavale and Reedy50), which has been extensively used in the scientific literature as a valuable tool to assess diet quality, independent of quantity. In the current study, HEI-2010 was calculated based on the collected 24-h recalls to assess the diet quality of mothers, and it comprised twelve components: nine adequacy components (including total fruit, whole fruit, total vegetables, greens and beans, whole grains, dairy and total protein foods) and three moderation components (including refined grains, Na and empty energy content). Each of the twelve components was weighted to yield an HEI-2010 total score that has a maximum value of 100, indicating full adherence to DGA, and a minimum value of 0, indicating no adherence to DGA(Reference Guenther, Casavale and Reedy50). According to the HEI-2010 guidelines, scores ≤50 were described as ‘low diet quality’, scores of 51–80 were categorised as ‘moderate’, and scores >80 were considered ‘high’(Reference Koksal, Ermumcu and Mortas51–Reference Snetselaar53). The three HEI categories were further merged in the current study into two categories: low diet quality (HEI ≤ 50) and moderate-to-high diet quality (HEI > 50).
Using the 24-h dietary recalls, MDD-W was calculated following the guide for calculating individual dietary diversity scores that was developed by the Food and Agriculture Organization (FAO) and US Agency for International Development (USAID)’s Food and Nutrition Technical Assistance III Project (FANTA)(54). More specifically, MDD-W refers to a dichotomous indicator of whether or not women (15–49 years of age) have consumed at least five out of ten defined food groups the previous day or night. The proportion of women 15–49 years of age who reach this minimum threshold in a population can be used as a proxy indicator for higher micronutrient adequacy(54). MDD-W was previously noted as a conservative estimate of household nutritional security as well as micronutrient adequacy of a women’s diet(Reference Arimond, Wiesmann and Becquey55). In our study, the food items listed in the 24-h recalls collected per participant were aggregated into ten defined food groups, namely: (i) grains, white roots and tubers and plantains (also known as starchy staples); (ii) pulses (beans, peas, lentils); (iii) nuts and seeds; (iv) dairy; (v) meat, poultry and fish; (vi) eggs; (vii) dark green leafy vegetables; (viii) other vitamin A-rich fruits and vegetables; (ix) other fruits and (10) other vegetables. A single point was allocated to each food group consumed in quantities ≥15 g (approximately 1 tablespoon) over the 24-h period, and a sum total of all points was calculated. The higher the score (ranging from 0 to 10) that was calculated, the higher the dietary diversity of a woman. The validity of MDD-W scores was assessed to show good internal consistency (Cronbach’s α 0·722). Each study participant was later classified as having ‘poor dietary diversity’ if her MDD-W score was <5 (i.e., woman consumed <5 food groups in the previous 24 h), or as having ‘good dietary diversity’ if her MDD-W score was ≥5 (i.e., she consumed ≥5 food groups during the past day).
Anthropometric measures
Anthropometric measurements of mothers (weight and height) were collected by trained dietitians. Measurements were carried out using standard protocols and equipment. Weight was measured to the nearest 0·1 kg in light indoor clothing and with bare feet or stockings using a portable standard calibrated balance (Seca model 877). Height was obtained, without shoes, to the nearest 0·1 cm using a portable stadiometer (Seca, model 294 213). All measurements were taken three times, and the average values were reported. Body Mass Index (BMI) (kg/m2) was calculated by dividing the weight (kg) over the height-squared (m2) (National Institutes of Health, 1998). Mothers were categorised as thin (<18·5 kg/m2), normal (18·5–22·9 kg/m2), overweight (23·0–24·9 kg/m2) or obese (≥25·0 kg/m2) based on the WHO classification(56).
Data analysis
Data were entered and analysed using Stata/se version 12 (StataCorp.). Descriptive statistics were performed and presented as means and se for continuous variables, or as frequencies and percentages for categorical variables. Sampling weights were used to account for the effect of cluster sampling technique used in L-FANUS(Reference Jomaa, Naja and Kharroubi40). These weights were calculated using the following formula(57): 1/(prob 1×prob 2), whereby ‘prob 1’ is the probability of each cluster being sampled and ‘prob 2’ is the probability of each household being sampled in each cluster. For the dietary intake analyses, independent t tests were used to test differences in the mean daily food group consumption and in the mean daily energy and macronutrients’ intakes (in grams per day (g/d) and %kJ per day (%kJ/d) between mothers in food-secure v. food-insecure households. Sociodemographic factors of HFI were explored using simple and multiple logistic regression analyses. The dependent variable in these models was HFI, which was recoded into two categories: (i) food-secure v. (ii) food-insecure (mild, moderate and severe) households. In addition, the relationships between HFI and the odds of maternal overweight status, dietary adequacy and dietary diversity (BMI, diet quality (HEI) and diversity (MDD-W)) were explored independently using simple and multiple logistic regressions. Sociodemographic variables that were found to be significantly associated with the dependent variables were adjusted for in the multiple logistic regression models. Results from the logistic regression models were expressed as OR and adjusted OR (AOR) with 95 % CI. For this analysis, a P-value <0·05 was considered statistically significant.
Results
As presented in Table 1, the mean age of mothers in the study was 39·63 ± 0·32 years. Educational levels of mothers and their spouses were found to be comparable in the current study, with 55·3 % of spouses with intermediate school education or less, and 47·4 % of mothers with a similar educational attainment. Less than a quarter of mothers (24 %) were employed, with the vast majority of their spouses being employed (94 %). Each household had on average three children, and 26 % of households had a crowding index (≥2 persons per room) with 40 % of households having a monthly income <663 USD (minimum wage salary in Lebanon is 450 USD)(58). In addition, 49·3 % of households were found to be food-insecure. In terms of mothers’ anthropometric measures, more than two-thirds of mothers were found to be overweight (BMI ≥ 25 kg/m2), of which 33·3 % were obese (BMI ≥ 30 kg/m2). With regard to the dietary intake of mothers, the average HEI and M-DDS scores were 54·81 ± 0·47 and 3·47 ± 0·15, respectively. Almost two-thirds of mothers had a high HEI score (>50 out of 100), and 38 % of mothers consumed more than the recommended minimum dietary diversity (i.e., MDD-W >5 out of 10); see Table 1.
Table 1 Sociodemographic, anthropometric and dietary characteristics of the study sample (n 1204), 2014–2015*

HEI, Healthy Eating Index; MDD-W, Minimum Diet Diversity for Women of Reproductive Age.
* Continuous variables were presented as means and se, whereas categorical variables were reported as frequencies (n) and proportions (%).
† Frequencies were calculated based on weighted proportions.
‡ 1 USD = 1500 Lebanese pounds.
§ Anthropometric measurements of mothers were categorised based on WHO classification(56).
‖ A woman was classified as having ‘low diet quality’ if she had HEI scores ≤50, or ‘moderate to high diet quality’ if she had HEI scores >50(52).
¶ A woman was classified as having ‘poor dietary diversity’ if she had consumed <5 food groups, or ‘good dietary diversity’ if she had consumed ≥5 food groups the previous day(54).
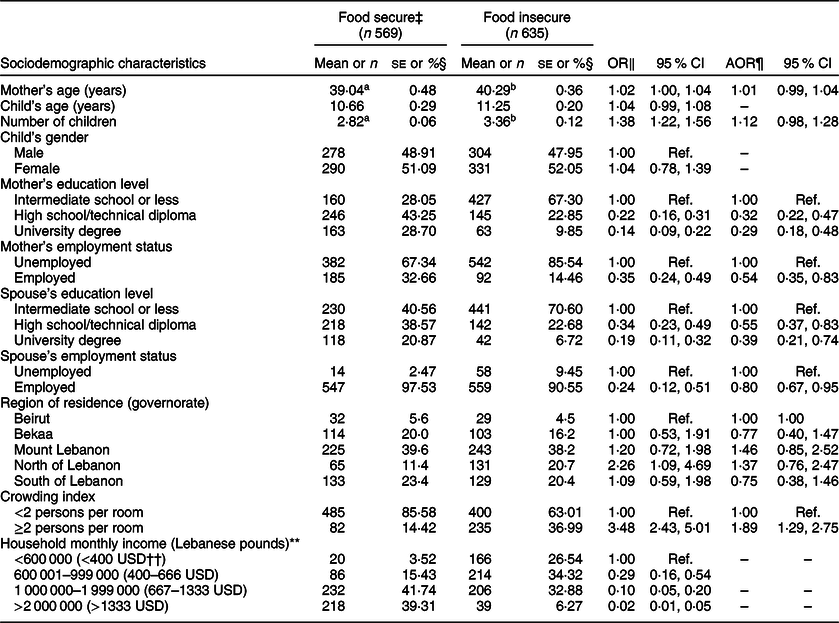
Table 2 also presents the associations between sociodemographic characteristics of mothers in the study sample with the odds of HFI. In the simple logistic regression analyses, the sociodemographic correlates of HFI included mother’s age, number of children, educational attainment, and employment status of mothers and their spouses, as well as household’s region of residence, crowding index, and income. Educational attainment and employment status of mothers and their spouses, together with household crowding index, remained statistically significant with HFI in the multiple logistic regression (see Table 2). It is worth noting that household income was excluded from the multiple logistic regression models, as it was significantly associated with crowding index (P < 0·001). Data from previous studies also support the use of the crowding index, as it is less subject to reporting bias compared with household income(Reference Melki, Beydoun and Khogali42,Reference Turrell59,Reference Galobardes, Shaw and Lawlor60) .
Table 2 Associations of sociodemographic characteristics of mothers with the odds of household food insecurity* in the study sample (n 1204), 2014–2015†
AOR, adjusted OR.
* The food-insecure category included mildly, moderately and severely food-insecure households as per the Household Food Insecurity Access Scale guide(Reference Coates, Swindale and Bilinsky45).
† Continuous variables were presented as means and se, whereas categorical variables were reported as frequencies (n) and proportions (%).
‡ Comparisons of characteristics between food-secure and food-insecure groups were conducted for continuous and categorical variables using independent and χ 2 tests.
§ Frequencies were calculated based on weighted proportions.
‖ OR of the dependent variable (food-insecure v. food-secure households) was presented with 95 % CI using a simple logistic regression.
¶ AOR was presented with 95 % CI using a multiple logistic regression analysis. The model was adjusted for sociodemographic characteristics that were found to be significant correlates of food insecurity (mother’s age, number of children, mother’s and spouse’s education and employment status, region of residence and crowding index), except for income to avoid multicollinearity.
** 1 USD = 1500 Lebanese pounds.
†† This value was slightly lower than the minimum wage in Lebanon of USD 450(Reference Turrell59).
a,bMean values in a row with unlike superscript letters were significantly different (P < 0.05) using independent t test for comparison of sociodemographic characteristics of the study sample.
Multiple logistic regression models showed that households in which mothers and their spouses had higher educational level remained significantly less likely to be food-insecure, even after adjusting for other significant correlates of HFI (P < 0·05). In addition, mothers’ and spouses’ employment status were associated with lower odds of HFI (AOR 0·54, 95 % CI 0·35, 0·83; AOR 0·8, 95 % CI 0·67, 0·95). Households with a crowding index ≥2 persons per room had also significantly higher odds of HFI (AOR 1·89, 95 % CI 1·29, 2·75) compared with households with crowding index <2 person per room.
Table 3 shows the daily food group consumption (g/d, %kJ/d) of mothers by HFI. Overall, the food sources contributing mostly to total daily energy intake (%kJ/d) were grains (27·67 ± 0·68), particularly refined grains (25·28 ± 0·73), followed by added fats and oils (14·96 ± 0·45) and meat-based sources, including meat, poultry and fish (9·97 ± 0·50). Compared with mothers in food-secure households, mothers in food-insecure households had significantly (P < 0·05) lower %kJ/d from vegetables (3·50 ± 0·22 v. 4·28 ± 0·31), starchy vegetables (0·76 ± 0·14 v. 1·38 ± 0·21), nuts (1·40 ± 0·26 v. 2·50 ± 0·35) and alcoholic beverages (0·21 ± 0·08 v. 0·51 ± 0·13). On the other hand, mothers in food-insecure households had significantly (P < 0·05) higher %kJ/d from grains (28·93 ± 0·94 v. 26·46 ± 0·87), refined grains (26·68 ± 0·97 v. 23·91 ± 0·98), chips and salty snacks (8·34 ± 0·99 v. 5·61 ± 0·58), added sugars (2·7 ± 0·20 v. 1·81 ± 0·15) and hot beverages (2·33 ± 0·33 v. 1·60 ± 0·15). Similarly, food group consumption of mothers (in g) differed significantly by HFI status. Mothers in food-insecure households had significantly lower consumption of vegetables, starchy vegetables, nuts and dairy products, specifically milk derivatives (e.g., yoghurt, cheese, sweetened milk), while their consumption of chips and salty snacks was higher than their food-secure counterparts; P < 0·05 (Table 3).
Table 3 Mean daily food group consumption (g, %kJ/d) of mothers by household food insecurity status in the study sample (n 1204)*

a,bMean values in a row with unlike superscript letters were significantly different (P < 0.05) using independent t test for the comparison of mean intakes in g/d.
c,dMean values in a row with unlike superscript letters were significantly different (P < 0.05) using independent t test for the comparison of mean intakes in %kJ/d.
* Continuous variables were presented as means and se, whereas categorical variables were reported as frequencies (n) and proportions (%).
† Milk derivatives include yogurt, strained yoghurt (labneh), cheese, sweetened milk and whipped cream.
‡ Added sugars include table sugar, honey, syrup, jam and molasses.
§ Unsweetened beverages include diet sodas and any beverages made with non-nutritive sweeteners.
Daily energy (kJ/d) and macronutrients’ intakes of mothers (g/d and %kJ/d) were also examined by HFI status (Table 4). Overall, the mean daily energy intake of mothers was 5634·55 ± 133·89 kJ. Mothers consumed, on average, 49·83 ± 0·42 %kJ/d from carbohydrates, 13·43 ± 0·24 %kJ/d from protein and 36·74 ± 0·34 %kJ/d from fat. Significant differences were also observed in mean daily energy and macronutrients’ intakes of mothers by HFI status: compared with mothers from food-secure households, mothers in food-insecure households had significantly lower total daily energy intake and lower macronutrients’ intake (%kJ/d and g/d) from protein, animal protein, total fat and saturated fat, and higher intake of carbohydrates and linoleic acid; P < 0·05. In addition, the proportion of mothers in the study sample meeting the recommended acceptable macronutrient distribution range (AMDR) was also assessed by HFI status. Results showed that a significantly higher proportion of food-insecure mothers were consuming <10% of their total daily kJ/d from proteins (i.e., AMDR for proteins) compared with food-secure mothers (30·7 v. 20·4 %, P < 0·001), whereas a significantly higher proportion of food-secure mothers had fat intake above the AMDR, which is >35% of total daily kJ/d from fats (61·6 v. 54·2 %, respectively; P = 0·0146). There were no significant differences in average percentage daily energy consumption from carbohydrate and sugar between food-secure and food-insecure mothers (see online supplementary material, Supplemental Fig. S1).
Table 4 Mean daily energy and macronutrients’ intakes (g, %kJ/d) of mothers by household food insecurity status in the study sample (n 1204)*
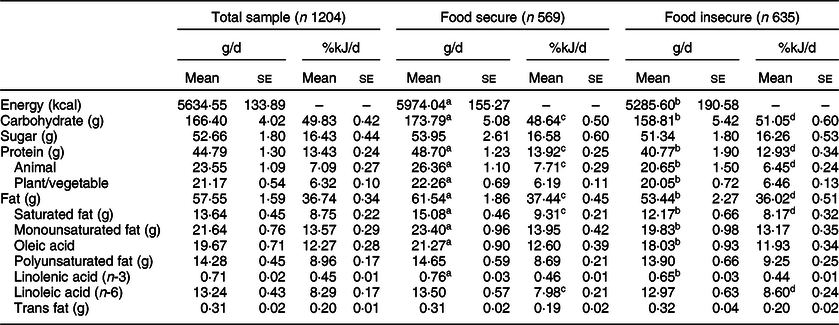
a,bMean values in a row with unlike superscript letters were significantly different (P < 0.05) using independent t test for the comparison of mean intakes in g/d.
c,dMean values in a row with unlike superscript letters were significantly different (P < 0.05) using independent t test for the comparison of mean intakes in %kJ/d.
* Continuous variables were presented as means and se, whereas categorical variables were reported as frequencies (n) and proportions (%).
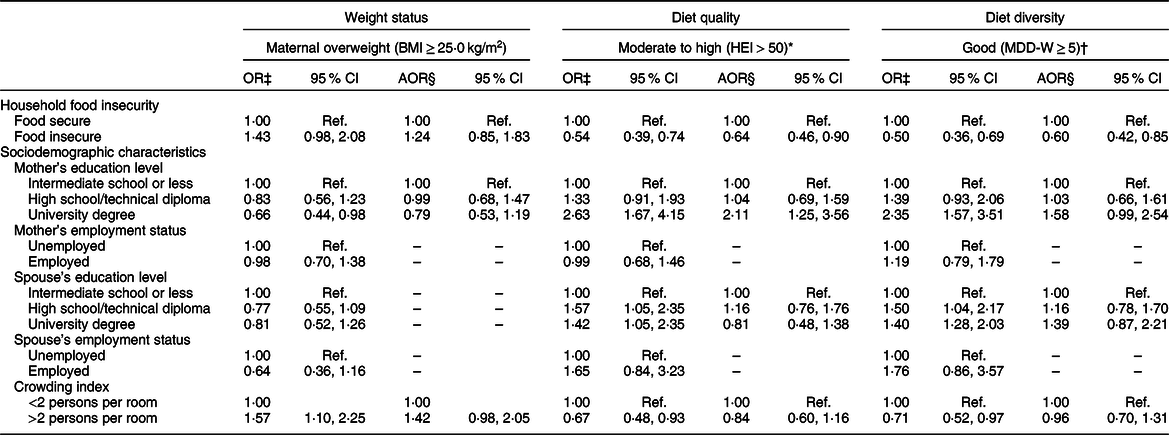
Table 5 presents the associations between HFI status and the odds of overweight and measures of diet quality and diversity (HEI and M-DDS) among mothers in the study sample. Using a simple logistic regression analysis, the association between HFI and maternal overweight status showed a trend that approached significance (OR 1·43, 95 % CI 0·98, 2·08, P = 0·063). However, the relationship was not statistically significant in the adjusted model (OR 1·24, 95 % CI 0·85, 1·83, P = 0·258). On the other hand, the associations between HFI and maternal diet quality and diversity were found to be statistically significant in both simple and multiple logistic regression models. HFI was associated with lower odds of consuming a diet with moderate to high diet quality (HEI > 50) (AOR 0·64, 95 % CI 0·46, 0·90, P = 0·010) and lower odds of consuming the recommended minimum dietary diversity (MDD-W ≥ 5) (AOR 0·6, 95 % CI 0·42, 0·85, P = 0·004), even after adjusting for other significant correlates, including educational attainment of mother and spouse and household crowding index.
Table 5 Associations of household food insecurity with weight status, diet quality and diet diversity among mothers in the study sample (n 1204), 2014–2015
HEI, Healthy Eating Index; MDD-W, Minimum Diet Diversity for Women of Reproductive Age; AOR, adjusted OR.
* A woman was classified as having ‘low diet quality’ if she had HEI scores ≤50, or ‘moderate to high diet quality’ if she had HEI scores >50(52).
† A woman was classified as having ‘poor dietary diversity’ if her MDD-W was <5, referring to consuming <5 food groups the previous day, or as having ‘good dietary diversity’ if she consumed ≥5 food groups the previous day(54).
‡ OR of dependent variables (normal weight v. overweight/obese; low v. moderate to high HEI; and poor v. good MDD-W) was presented with 95 % CI using a simple logistic regression.
§ AOR was presented with 95 % CI using a multiple logistic regression analysis. The model was adjusted for sociodemographic characteristics that were found to be significant correlates of food insecurity (mother’s age, mother’s and spouse’s education and employment status and crowding index, except for income to avoid multicollinearity).
Discussion
The current study aimed to examine the association of HFI with sociodemographic characteristics as well as anthropometric and dietary intake measures among mothers from a nationally representative sample of Lebanese households with children.
Overall, HFI was noted among almost half of the study sample, and it was found to be associated with several sociodemographic variables, including lower educational attainment, unemployment and higher household crowding, a proxy measure for lower SES. Recent studies support these findings, showing that food insecurity has become one of the most prominent challenges that Lebanon’s population is facing. Food insecurity has been affected by the country’s weak political, social, and economic infrastructure post the Lebanese civil war, together with prolonged conflicts and wars in neighbouring countries. With the start of the Syrian war in 2011, the challenge was even further heightened due to the large displacement of refugees to Lebanon, reaching approximately 1·5 million registered individuals(61,62) . In addition, Lebanon has been home to thousands of Palestinian and Iraqi refugees, who have fled wars in their respective countries and have been residing in Lebanon for decades(61,63) . Together, all these factors may have further strained the weak economy of the country and contributed to alarming rates of food insecurity experienced among Lebanese host communities(64,65) , as well as more vulnerable refugees with rates ranging between 62 and 90 %(Reference Ghattas, Sassine and Seyfert66–68). In addition, and consistent with our study findings, poor household income, low educational attainment and unemployment were found to consistently increase the probability of HFI among Lebanese households(Reference Jomaa, Naja and Cheaib14,Reference Sahyoun, Nord and Sassine69) and refugee groups in the country(Reference Jomaa, Naja and Cheaib14,Reference Naja, Hwalla and Fossian43,Reference Ghattas, Sassine and Seyfert67) . Evidence from the global Gallup World Poll (GWP) surveys, including eighteen countries in the Eastern Mediterranean region (such as Lebanon, Palestine, Egypt, Jordan)(Reference Sheikomar, Wambogo and Sahyoun70–Reference Grimaccia and Naccarato72), further highlights that the five common determinants of food insecurity across these countries were low levels of education, low household income, unemployment and weak social networks/low social capital(Reference Smith, Rabbitt and Coleman-Jensen73).
In terms of dietary intake, findings from the current study showed that HFI is associated with compromised maternal dietary quality and diversity. More specifically, an inverse association was observed between HFI and maternal HEI and MDD-W, even after adjusting for demographic and socioeconomic factors. The lower dietary quality and diversity noted among mothers from food-insecure households in our study sample were further supported by their higher intakes of low-nutrient, energy-dense foods, including refined grains, added sugars, chips and salty snacks, and the lower consumption of nutrient-dense vegetables and protein sources (nuts and dairy products) compared with their food-secure counterparts. These results are in accordance with a previous study conducted among urban Lebanese mothers, showing that HFI is associated with a higher risk of maternal dietary inadequacy and micronutrient deficiencies, due to similar poor food consumption patterns adopted by food-insecure mothers(Reference Jomaa, Naja and Cheaib14). HFI has also been characterised with a reduction in food expenditures and food intake, together with more drastic changes in the quality and diversity of foods consumed by Palestinian and Iraqi refugee families in Lebanon(Reference Ghattas, Sassine and Seyfert66,Reference Ghattas, Sassine and Seyfert67) . Although the severity of food insecurity differs between refugees and Lebanese host communities, food-insecure families seem to adopt similar food and non-food coping mechanisms, including reducing the number and quantity of meals consumed, borrowing food, spending savings and others(Reference Jomaa, Naja and Kharroubi40,Reference Ghattas, Sassine and Seyfert67) . It is worth noting that these coping mechanisms are also mostly adopted by food-insecure women, who skip meals or limit their food intake to protect their families and children from food shortage and hunger(Reference Franklin, Jones and Love19). Such dietary adjustments can have serious repercussions not only on the nutritional and health status of women of reproductive age and mothers(Reference Ivers and Cullen10,Reference Shariff and Khor74) , but can also have adverse and long-lasting effects on the health of their children. In fact, food insecurity and malnutrition can have intergenerational effects leading to poor pregnancy outcomes, such as preterm births, low birth weight and higher risk of diseases among infants in the short and long term(Reference Ivers and Cullen10,Reference Laraia, Siega-Riz and Gundersen75–Reference Grilo, Earnshaw and Lewis77) .
Although we hypothesised a positive association between HFI and maternal overweight status (BMI ≥ 25 kg/m2) in our study sample, this association was not found to be statistically significant after adjusting of socioeconomic correlates. These results were different from those reported earlier in the urban setting of Beirut, whereby researchers showed a higher risk of maternal obesity among food-insecure women compared with their food-secure counterparts(Reference Jomaa, Naja and Cheaib14). Indeed, previous studies conducted in LMIC have shown that the association between HFI and overweight and obesity is rather inconsistent and complex(Reference Farrell, Thow and Abimbola22,Reference Hough and Sosa23,Reference Gubert, Spaniol and Segall-Corrêa26,Reference Mohammadi, Omidvar and Harrison78) . Differences across studies can be attributed to environmental and lifestyle factors, including the stage of nutritional transition that a specific region or country is undergoing, which affects the availability and affordability of energy-dense foods. In fact, the affordability of high-energy processed foods was identified as the main mechanism affecting the relationship between FI and obesity in LMIC(Reference Farrell, Thow and Abimbola22,Reference Brown, Esposito and Fisher79,Reference Finney Rutten, Yaroch and Patrick80) . These factors, including the quantity and diversity of food consumed, spatial-temporal access to nutritious food, as well as sedentary or physical activity behaviours, can all contribute to the risk of weight gain among food-insecure individuals. There may be also other emerging risk factors that need to be further considered when exploring the drivers of obesity in LMIC settings, including chronic psychosocial stressors, environmental pollutants and other physiologic and genetic/epigenetic mechanisms(Reference Ford, Patel and Narayan81). According to WHO, Lebanon is still considered at an early stage of nutrition transition, as it is being characterised by moderate levels of overweight and obesity, in addition to moderate levels of undernutrition and widespread micronutrient deficiencies within specific subpopulations and age groups(Reference Nasreddine, Naja and Chamieh33,82,Reference Hwalla, Al Dhaheri and Radwan83) . Thus, the lack of association between HFI and obesity in the current study may be explained by the early stage of nutrition transition that the country, as a whole, is undergoing. Nevertheless, the accelerated rates of urbanisation and modernisation that Lebanon is witnessing, together with the adoption of more westernised dietary patterns across various population groups in the country, are hypothesised to contribute to an increase in obesity trends, which warrants further attention(Reference Naja, Hwalla and Itani84,Reference Naja, Nasreddine and Itani85) .
Findings from the current study need to be also considered in light of few limitations. First, the design of the study is cross-sectional; thus, causality of the observed associations cannot be concluded. Data for mothers in the current study were also based on a nationally representative sample of Lebanese households (with children 4–18 years old). Thus, results cannot be generalisable to the entire Lebanese population. Another limitation for the study is that the dietary data of mothers was assessed using single 24-h recalls, which may not fully represent their usual dietary intake. Nevertheless, several measures were adopted by the research team to ensure the accuracy of dietary assessment, such as using a standardised dietary instrument for collecting 24-h dietary recalls, namely the five-step USDA multiple-pass 24-h dietary recall method(Reference Moshfegh, Rhodes and Baer46). In addition, trained dietitians carried out data collection, including dietary data assessment and collecting anthropometric measures. They also underwent a 5-d training workshop to ensure the standardisation of data collection protocol. Furthermore, regular meetings and follow-ups were scheduled with dietitians throughout the data collection phase to address any errors or inconsistencies and ensure the validity and reliability of collected data.
Conclusion
Lebanon represented a unique setting to conduct the current study. First, the country is undergoing a rapid nutrition transition with rising overweight and obesity rates among adults, including women. In parallel, Lebanon continues to face major threats to the food and nutrition security of its population with considerable economic, social and political challenges, heightened by the large number of refugees hosted by the country. Our study findings show that HFI was experienced among almost half of the study sample, with correlates of HFI being low educational attainment, unemployment and crowding. In addition, HFI was associated with compromised maternal diet quality and diversity. Thus, public health policies and social welfare programmes are required to alleviate HFI while improving the dietary intake and nutritional status of vulnerable groups, including women. In addition, there is an imminent need for regular monitoring and surveillance of food security at household and individual levels using experience-based scales, while also promoting accountability, transparency and equitable distribution of resources in social protection policies and programmes(Reference Pérez-Escamilla44). These are fundamental elements for good food and nutrition security governance, which are much needed in LMIC and contexts, like Lebanon, undergoing protracted conflicts with a massive displacement of refugees.
Acknowledgements
Acknowledgements: The authors express their sincere gratitude to all study participants and acknowledge the efforts of field workers involved in data collection as part of the original study. In addition, the authors would like to acknowledge Ms. Nada Adra for her assistance with data cleaning and statistical analyses, and Mr. John Russell for technical editing and proofreading the manuscript. Financial support: The current study was funded by the Lebanese National Council for Scientific Research and the University Research Board at the American University of Beirut. The funding organisations had no role in the design, data collection, analysis or writing of this article. Conflict of interest: The authors declare that they have no conflict of interest. Authorship: L.J. and N.H. conducted the original research study; L.J., F.N. and N.H. conceptualised the study design and objectives; L.J. coordinated data collection, entry and analysis; F.N., S.K. and M.D.E. contributed significantly to data analysis and interpretation; L.J. acted as the lead author of the manuscript; and N.H. provided critical review of the manuscript. All authors have read and approved the final manuscript. Ethics of human subject participation: The current study was conducted according to the guidelines laid down in the Declaration of Helsinki, and all procedures involving study participants were approved by the institutional review board at the American University of Beirut (NUT.LJ.3). Written informed consent was obtained from all individual participants included in the study.
Supplementary material
For supplementary material accompanying this paper, visit https://doi.org/10.1017/S1368980020000567


