


High Na intake is a major risk factor for high blood pressure and CVD( Reference O’Donnell, Mente and Rangarajan 1 , Reference Mente, O’Donnell and Rangarajan 2 ). It is estimated that 2·5 million deaths could be prevented each year worldwide if salt consumption were reduced by 6 g/d( Reference He and MacGregor 3 ). Low dietary K intake also contributes to an increase in blood pressure and CVD and stroke( Reference O’Donnell, Mente and Rangarajan 1 ). Intervention studies increasing intake of dietary K or fruit and vegetables (major K food sources) have demonstrated blood pressure-lowering effects in normotensive and hypertensive participants( Reference Whelton, He and Cutler 4 , Reference Geleijnse, Kok and Grobbee 5 ). Previous studies have also indicated that the ratio of Na to K is a more important risk factor for hypertension and CVD than dietary Na or K intake alone( Reference Binia, Jaeger and Hu 6 – Reference Yang, Liu and Kuklina 8 ).
Na intake of Australian adults estimated by urinary Na excretion is consistently reported to be in excess of the suggested dietary target (SDT) of 86 mmol/d for reducing chronic disease( 9 ). Recent national estimates of Na intake from food sources alone indicate 71 % of males and 32 % of females aged >19 years exceeded the previous upper limit of consumption for Na (2300 mg/d). In addition, 64 % of adults in Australia report adding salt to foods during cooking or at the table( 10 ). Therefore, total Na intake is likely to be higher than these figures as they do not include this discretionary Na added to foods during preparation, cooking and at the table( 10 ). The most recent estimate of salt intake in Australia is 9·0–9·9 g/d, which takes account of Na from foods, processing and discretionary salt added to foods( Reference Santos, Webster and Land 11 ).
Few studies have reported K intake of Australian adults. The adequate intake (AI) for K is 97 mmol/d (3800 mg/d) for men and 72 mmol/d (2800 mg/d) for women. The SDT for K is 120 mmol/d (4700 mg/d), which is recommended to reduce risk of high blood pressure and CVD( 9 ). Findings of the few published studies show K intake to be 80–90 % of the SDT( Reference Margerison, Riddell and Wattanapenpaiboon 12 ).
Identifying foods that contribute high proportions of Na to the diet of Australians is an important step towards reducing Na intakes and can aid meal-based approaches to complement food-based dietary recommendations. Currently there are only a few studies that document major food sources contributing to Na intake of Australian adults. Among these, bread and cereals have been found to contribute the greatest proportion of total daily Na intake( Reference Villani, Clifton and Keogh 13 – 15 ); however, these studies are limited by small or convenience samples of adults. Fewer studies have reported food sources of K in Australian adults. Margerison et al.( Reference Margerison, Riddell and Wattanapenpaiboon 12 ) recently reported vegetable products/dishes, breads and cereals and meat products/dishes as major contributors to K intake in a sample of older Australian adults. Identifying major food sources of Na and K is important for cardiovascular health as it could provide targets to inform policy and complement the food-based recommendations of the Australian Dietary Guidelines for adults by providing meal-based diet recommendations( 16 ).
Recent interest in dietary and meal pattern research has emerged as a potentially useful way to better understand the ways in which foods are consumed in real life and can aid interpretation of food-based dietary guidelines and assist populations in achieving dietary targets (such as the Australian Guide to Healthy Eating)( 16 ). Meal and snack patterns may affect the development of several chronic diseases( Reference Fabry, Fodor and Hejl 17 , Reference Wirfalt, Hedblad and Gullberg 18 ) with a potential mechanism being impaired vascular function following exposure to individual meals with high Na and low K content( Reference Dickinson, Clifton and Keogh 19 – Reference Blanch, Clifton and Petersen 22 ). There are few previous studies that have reported the food sources and distribution of Na and K consumption across meal time and between-meal time occasions. Young people are reported to consume more Na from snack foods compared with meals( Reference Macdiarmid, Loe and Craig 23 , Reference Kerr, Mccrorie and Rennie 24 ). Margerison et al. reported that the lunch meal contributes the greatest proportion of Na intake among older adults (34 % of daily Na intake)( Reference Margerison, Riddell and Wattanapenpaiboon 12 ). No other previous studies have reported Na and K intakes and food sources at different eating occasions.
Therefore, to address this gap, we conducted a secondary data analysis of the National Nutrition and Physical Activity Survey (NNPAS) 2011–12 component of the Australian Health Survey (AHS) 2011–13( 10 ) to examine dietary Na and K intakes at meal times in Australian adults and identify the contribution of major food sources to Na and K at different eating occasions.
Methods
Study population
The present study is a secondary analysis of the AHS 2011–13( 10 ), which is the largest and most comprehensive health survey conducted in Australia. The data used in the present study were collected during the NNPAS 2011–12, one of four components of the AHS 2011–13, and provided information relating to dietary intakes (via two 24 h dietary recalls at least 8 d apart, using computer-assisted interview instruments). Details of the survey methods have been published by the Australian Bureau of Statistics in the Australian Health Survey Users’ Guide 2011–13( 25 ).
Permission was obtained from the Australian Bureau of Statistics to access the basic confidentialised unit record file, released on 13 November 2014, to enable data analysis. Males and females aged 18–84 years for whom measured height, weight and age were reported (n 7818) were included in the analysis.
Data from the first 24 h dietary recall conducted at the face-to-face interview were used to estimate nutrient and food intakes in the present analysis. The 24 h dietary recall was conducted by trained interviewers using a computer-assisted interview system, the Automated Multiple-Pass Method( Reference Moshfegh, Rhodes and Baer 26 ), to ensure consistent and complete data collection. One day of data can be used as an estimate of the mean of the usual intake distribution in the population, whereas the usual intake of an individual would have required more than one day.
Eating occasions and food classification
The AUSNUT 2011–13 database contains fifty-one nutrient values for all foods and beverages reported in the 24 h dietary recalls in the NNPAS( 27 ). The AUSNUT database was specifically developed for use with the AHS. A key consideration is that the Na content of some home-prepared foods may be underestimated. This is because salt added during cooking has not been accounted for in recipes used in the database( 28 ). Therefore the estimates of daily Na intake presented here are likely underestimated and differ from the values of total daily Na intake that have been estimated drawing on a combination 24 h urinary Na excretion and 24 h recall data( Reference Santos, Webster and Land 11 ).
The NNPAS 2011–12 identified thirteen separate eating occasions for the consumption of foods and beverages. Eating occasions were classified as ‘meal time’, which comprises the three typical daily meals of breakfast (includes breakfast and brunch), lunch and dinner, and ‘between-meal time’ (includes supper, morning tea, afternoon tea, snack, beverage/drink, extended consumption and other). Foods and beverages that were consumed on an occasion not determined were not classified as either meal time or between-meal time foods and beverages, and hence are excluded from eating occasion analyses (101 of 212 235 food/beverage items consumed). However, the nutrients from these foods and beverages have been included in estimations of daily Na, K and energy intakes. The proportion of Na intake from foods and beverages in the present study is reported at the 3-digit code (sub-major food group) level.
To standardise intakes for comparisons, Na and K densities, defined as mg/MJ energy intake, were calculated.
Statistical analysis
The statistical software package Stata version 10 was used in the data analysis. Since NNPAS 2011–12 was conducted using a stratified multistage area sampling of private dwellings, sampling weights were applied when producing estimates to compensate for unequal probability of selection of the sampled person, non-response, and non-coverage. Variance and test statistics were estimated by the replicate weights technique and included the use of sixty replicate weights provided in the data set. These replicate weights were generated by the Australian Bureau of Statistics under the delete-one-group jack-knife method. Descriptive statistics are presented as means with their standard errors. ANOVA was used to test the difference between groups and a P value of <0·05 was set to establish statistical significance. Percentage of Na from each food group was calculated as: (sum of Na from food group (mg)/total sum of Na from all foods (mg)) × 100( Reference Krebs-Smith, Kott and Guenther 29 ). Ratio of Na to K was calculated as:
 $${\rm Na}\,\colon\,{\rm K}{\,\equals\,}{{{{{\rm Na}\,{\rm intake}\,\left( {{\rm mg}} \right)} \mathord{\left/ {\vphantom {{{\rm Na}\,{\rm intake}\,\left( {{\rm mg}} \right)} {23}}} \right. \kern-\nulldelimiterspace} {23}}} \over {{{{\rm K}\,{\rm intake}\,\left( {{\rm mg}} \right)} \mathord{\left/ {\vphantom {{{\rm K}\,{\rm intake}\,\left( {{\rm mg}} \right)} {39}}} \right. \kern-\nulldelimiterspace} {39}}}},$$
where 1 mmol Na=23 mg Na and 1 mmol K=39 mg K.
Estimates include Na naturally present in foods as well as Na added during processing, but exclude the ‘discretionary salt’ added by consumers in home-prepared foods or ‘at the table’. Na from supplements and medications is also excluded.
Results
Demographic characteristics of this nationally representative sample of Australian adults aged 18–84 years, according to quintile of Na intake, are illustrated in Table 1. Males consumed more Na, K and energy than females. Higher Na and K intakes were associated with younger age (both genders), and with higher body weight (females only). Mean Na density was not significantly different between males and females (males 285·0 (se 2·4) mg/MJ v. females 290·5 (se 3·0) mg/MJ; P=0·174). Mean K density was lower among males (333·4 (se 2·4) mg/MJ) compared with females (363·1 (se 2·6) mg/MJ; P<0·001). Na:K was higher among males than females (males 1·65 (se 0·02) v. females 1·54 (se 0·02); P=0·002) and was significantly different across quintiles of Na intake (P<0·001). Na density and Na:K were lower, and K density higher, in older adults compared with younger adults (P<0·005).
Table 1 Baseline characteristics by quintile of sodium intake and gender among a nationally representative sample of Australian adults aged 18–84 years with known height and weight (n 7818), Australian Health Survey (2011–13)
se estimated by the delete-one-group jack-knife replicate weights method.
Sodium and potassium at meal and between-meal eating occasions
Overall, main meals contributed 81 % of mean daily Na intake among all adults. The eating occasion contributing the greatest amount of Na on the day of the survey was dinner (33 % of total daily Na intake), followed by lunch (31 %), snacks (19 %) and breakfast (16 %; Fig. 1). There were no statistically significant gender differences in percentage of daily Na intake at any eating occasion (Fig. 2). There was a significant trend observed across age groups for proportions of Na intake from meal times compared with snacks (Table 2) that indicates younger adults consume a greater proportion of total Na from foods consumed between meals than older adults.
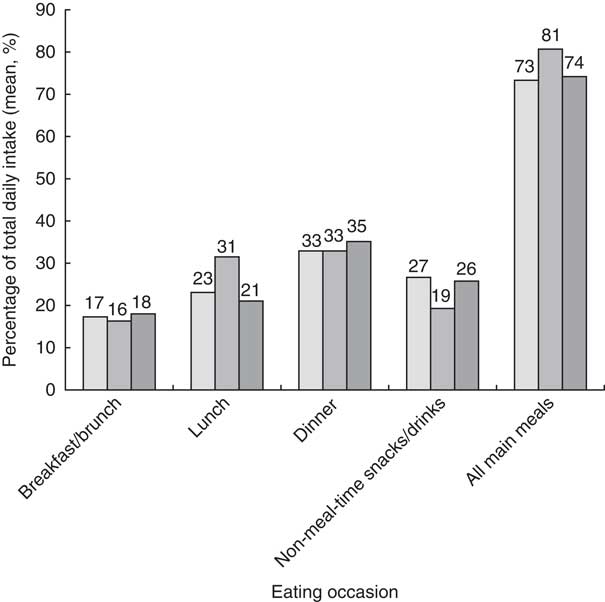
Fig. 1 Contribution to total daily energy (including dietary fibre; ![]() ), sodium (
), sodium (![]() ) and potassium (
) and potassium (![]() ) intakes from meals/snacks among a nationally representative sample of Australian adults aged 18–84 years with known height and weight (n 7818), Australian Health Survey (2011–13)
) intakes from meals/snacks among a nationally representative sample of Australian adults aged 18–84 years with known height and weight (n 7818), Australian Health Survey (2011–13)
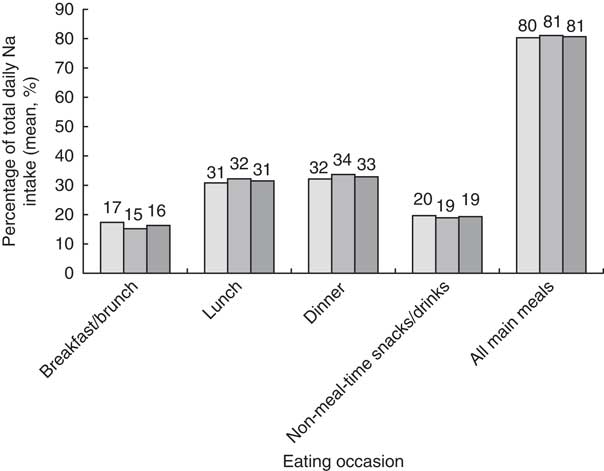
Fig. 2 Contribution to total sodium intake from meals/snacks, overall (![]() ) and according to gender (
) and according to gender (![]() , males;
, males; ![]() , females), among a nationally representative sample of Australian adults aged 18–84 years with known height and weight (n 7818), Australian Health Survey (2011–13)
, females), among a nationally representative sample of Australian adults aged 18–84 years with known height and weight (n 7818), Australian Health Survey (2011–13)
Table 2 Sodium intake from meals/snacks, according to age group, among a nationally representative sample of Australian adults aged 18–84 years with known height and weight (n 7818), Australian Health Survey (2011–13)
Main meals contributed 74 % of mean daily K intake among all adults (Fig. 1). The greatest contribution to K on the day of the survey was dinner (35 % of total daily K intake), followed by snacks (26 %), lunch (21 %) and breakfast (18 %).
The Na and K densities at each eating occasion are presented in Fig. 3. Total mean density was 288 mg/MJ per d for Na and 348 mg/MJ per d for K (Fig. 3). The greatest Na density at meal occasions was lunch (379 mg/MJ), followed by dinner (306 mg/MJ), breakfast (231 mg/MJ) and snacks (200 mg/MJ). K density was greatest for snacks (396 mg/MJ), followed by dinner (377 mg/MJ), breakfast (355 mg/MJ) and lunch (299 mg/MJ).
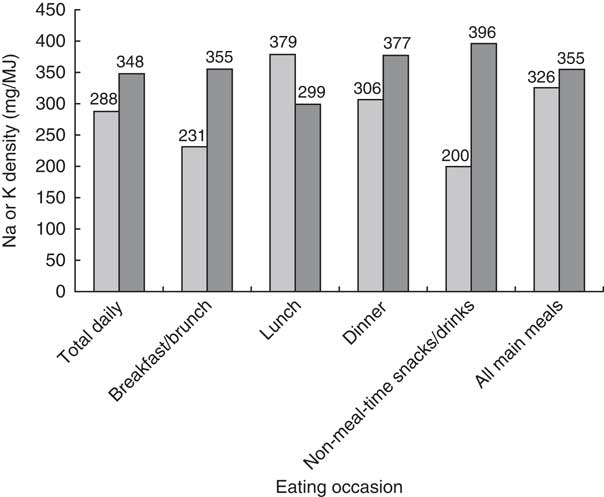
Fig. 3 Sodium density (![]() ) and potassium density (
) and potassium density (![]() ) of each meal/snack among a nationally representative sample of Australian adults aged 18–84 years with known height and weight (n 7818), Australian Health Survey (2011–13)
) of each meal/snack among a nationally representative sample of Australian adults aged 18–84 years with known height and weight (n 7818), Australian Health Survey (2011–13)
Top food group sources of sodium and potassium
The food group mixed dishes where cereal is the major ingredient contributed the greatest proportion of total daily Na intake (14·6 %) with savoury pasta/noodle and sauce dishes contributing most (22·4 %) followed by burgers (19·0 %), pizza (16·1 %), sandwiches and filled rolls (15·3 %). Potatoes contributed the greatest proportion of total daily K intake (221·6 mg; 7·5 %).
Top food group sources of sodium and potassium at meal and between-meal eating occasions
The top sources of Na differed at each of the specified eating occasions, as summarised in the online supplementary material, Supplemental Table 1. Breads and cereals contributed most Na at lunch (17·3 %), mixed dishes where cereal is the major ingredient at dinner (21·4 %) and cakes, muffins, scones, cake-type desserts (9·8 %) at snack times.
Major contributors to Na intake at breakfast were regular breads and bread rolls (24·0 %), breakfast cereals (11·0 %) and processed meat (10·7 %). At lunch, the major contributors were regular breads and bread rolls (17·3 %), mixed dishes where cereal is the major ingredient 17·1 %), processed meat (8·1 %), cheese (5·1 %), pastries (4·9 %), and gravies and savoury sauces (4·4 %). Mixed dishes where cereal is the major ingredient also contributed the greatest proportion of Na at dinner (21·4 %), followed by gravies and savoury sauces (8·3 %), mixed dishes where poultry or feathered game is the major component (6·6–5·7 %), sausages/frankfurts and saveloys (5·3 %), regular breads and rolls (5·3 %), and soup (5·1 %).
At the defined between-meal time occasion, cake, muffins, scones and cake-type desserts contributed the greatest proportion of Na intake (9·8 %), followed by regular breads and bread rolls (6·9 %), mixed dishes where cereal is the major ingredient (6·8 %), water (5·7 %) and cheese (4·6 %).
Top food sources of K intake also differed across various meal times. The top food group sources of K at each of the meal times were dairy milk (cow, sheep goat) at breakfast (108·1 mg; 20·5 %), mixed dishes where cereal is the major ingredient at lunch (66·7 mg; 10·9 %), potatoes at dinner (159·9 mg; 15·2 %), and coffee and coffee substitutes at between-meal eating occasions (107 mg; 13·9 %).
The other major food sources of K intake at breakfast were breakfast cereals (74·2 mg; 14·1 %), coffee and coffee substitutes (37·1 mg; 7·0 %), and fruit and vegetable juices and drinks (35·9 mg; 10·7 %). At lunch, the major contributors were mixed dishes where cereal is the major ingredient (66·7 mg; 10·9 %), potatoes (46·8 mg; 7·6 %), regular breads and bread rolls (44·3 mg; 7·2 %), dishes where vegetable is the major component (33·1 mg; 5·4 %) and poultry and feathered game (28·4 mg; 4·6 %), and beef, sheep, pork, unprocessed (27·9 mg; 4·6 %). Potatoes contributed the greatest proportion of K at dinner (159·9 mg; 15·2 %), followed by mixed dishes where cereal is the major ingredient (111·9 mg; 10·7 %), beef, sheep, pork, unprocessed (93·9 mg; 9·0 %), mixed dishes where beef, sheep, pork or mammalian game is the major component (66·3 mg; 6·3 %), mixed dishes where poultry or feathered game is the major ingredient (56·5 mg; 5·4 %), and poultry and feathered game (51·8 mg; 4·9 %).
At the defined snack/between-meal time occasion, coffee and coffee substitutes contributed the greatest proportion of K intake (107·0 mg; 13·9 % of K at snack time), followed by regular dairy milk (cow, sheep and goat; 81·2 mg; 10·6 %), beers (40·8 mg; 5·3 %), tropical and subtropical fruit (38·7 mg; 5·0 %), and fruit and vegetable juice and drinks (38·0 mg; 5·0 %).
Discussion
The present paper has reported the major food group contributors to Na and K intakes in a nationally representative sample of Australian adults. The food sources of Na and K according to meal and between-meal eating occasions are also reported. It was shown that breads, cereals and mixed dishes were significant contributors to daily intakes of both nutrients, and that major food sources of Na and K differed between defined eating occasions.
Regular breads and bread rolls (plain/unfilled/untopped varieties) contributed the greatest proportion of Na intake in adults (93·5 mg (24·5 % of total Na) and 133·7 mg (17·3 % of total Na) at breakfast and lunch, respectively). This is consistent with other reports that bread contributes substantially to Na intake in Australian adults and in other developed countries( Reference Margerison, Riddell and Wattanapenpaiboon 12 ). As bread is already recognised for the significant contribution it makes to total Na intake, efforts have focused on reducing the Na content with over 50 % of brands in 2012 containing 400 mg Na or less per 100 g in Australia and New Zealand( Reference Dunford, Eyles and Mhurchu 30 ).
At the minor food group level for mixed dishes where cereal is the major ingredient (5-digit AUSNUT code), it is evident that the major contributors to daily Na are takeaway foods such as burgers, pizza and tacos, which contribute to the high proportion of this food group to total daily Na intake. A report previously published by the George Institute documented the range of Na content of commonly consumed takeaway foods( Reference Garcia, Dunford and Sundstrom 31 ). It was reported that takeaway pizza is one of the foods with the highest Na content (three slices containing 2300 mg).
The major contributor to K intake was potatoes. However, cooking methods, which include frying and the addition of table salt, may compromise the nutritional quality of this food. Although fruits and vegetables are identified as good sources of K, neither featured as a major contributor to K intake, other than potato. This reflects the inadequate consumption of these foods, which is supported by the high proportion of Australian adults who do not usually meet national recommendations for fruit (2 servings/d) and vegetables (5 servings/d)( 16 ).
The other major findings are that dinner contributes the greatest proportion of Na to total daily Na intake (31 %) but that Na density is highest at lunch (379 mg/MJ v. dinner 306 mg/MJ), which is consistent with findings previously published in a sample of older Australian adults( Reference Margerison, Riddell and Wattanapenpaiboon 12 ). This reflects the differences in Na density of some of the main food group contributors to the different meal occasions. Lunch is characterised by consumption of dishes like filled sandwiches made with breads/rolls and typical fillings like cheeses and processed meats, spreads and sauces, which are all high-Na foods( Reference Sebastian, Wilkinson Enns and Goldman 32 ). Data from the National Health and Nutrition Examination Survey 2009–10 showed that US adults who reported eating a sandwich on the day of the survey had significantly higher energy and Na intakes compared with individuals who did not eat a sandwich( Reference Sebastian, Wilkinson Enns and Goldman 32 ). The frequent consumption of sandwiches with these typical ingredients and considerable contributions to Na intake means that substituting the higher-Na ingredients with low-Na higher-K ingredients (like vegetables) in sandwiches could significantly reduce Na intakes.
In contrast to Na density, K density was lowest at lunch and highest for between-meal eating occasions (299 v. 396 mg/MJ). This likely reflects coffee consumption incorporating milk at mid-meals whereas lunch typically comprised mixed dishes/cereals. This finding may also indicate low fruit and vegetable consumption at lunchtime, and consequently this presents an opportunity for meal-based advice to improve food choices and nutritional quality of foods consumed at lunches.
Between-meal time Na intake contributed approximately one-fifth (19 %) of total daily Na intake, which is substantially higher than the 11 % that has been reported previously in Australian adults( Reference Margerison, Riddell and Wattanapenpaiboon 12 ). We found that the foods that contributed the greatest proportion of Na intake at between-meal eating occasions were cakes, muffins, scones and cake-type desserts, contributing 9·8 % of total Na intake between meals. Bakery products often use Na to enhance flavour in addition to use of other Na-containing additives such as sodium citrate and raising agents such as sodium bicarbonate( Reference Yee, Sukumaran and Kotha 33 ). A recent Food Standards Australia New Zealand report that sampled the Na content of a range of bakery products found they ranged from an average of 229 mg/100 g for sweet biscuits to 805 mg/100 g for savoury biscuits( 34 ). A recent report documenting progress with the Australian Food and Health Dialogue identified bakery products as a reformulation target( Reference Elliott, Trevena and Sacks 35 ). That report highlighted inaction setting or reaching proposed Na reduction targets for breads, cereals, sauces, processed meats and snack foods( Reference Elliott, Trevena and Sacks 35 ). This highlights the important need for public policy to create a food supply that supports healthier choices and for the food industry to cooperate with this endeavour.
In the present study, the top food contributors to Na intake varied by quintile of Na consumption. Breads and mixed dishes were the highest contributors to Na intake in both the lowest and highest quintiles of Na intake, which likely reflects that these are staple foods in many Australian diets. Among consumers in the highest quintile of Na intake, the major sources of Na were highly processed foods: processed meats, sausages and pastries. Processed foods may also contain higher amounts of saturated fat and sugar than less processed foods( Reference Poti, Mendez and Ng 36 ). Among those in the lowest quintile of Na consumption, the top food sources of Na were less processed foods. The highest consumers of Na were consuming more Na/MJ than the lowest quintile of consumers. This may reflect that these high Na consumers are eating more overall, but indicates their diets are of poorer quality than those consuming lowest amounts of Na who are closest to meeting targets for Na intake to prevent chronic disease.
Another key observation was that younger adults consume a greater proportion of their Na intake at snack times compared with older adults. This is consistent with reports documenting school-aged children consume a greater proportion of Na from snacks compared with meals( Reference Macdiarmid, Loe and Craig 23 , Reference Kerr, Mccrorie and Rennie 24 ). This likely reflects the diet patterns of younger adults: their greater tendency to graze between defined meal occasions during the day/night compared with older people, who tend to consume foods at defined main meal eating occasions( Reference Holmback, Ericson and Gullberg 37 ).
Advice to reduce Na and increase K intake may benefit from approaches based on meal times. Current food-based dietary guidelines (Australian Dietary Guidelines) specify ‘Limit intake of foods and drinks containing added salt’( 16 ). This is inherently difficult for individuals because Na is a commonly used food additive; it is estimated that 75–85 % of dietary Na comes from processed foods( Reference Webster, Dunford and Neal 38 ). Strategies to support dietary guidelines include: ‘Read labels to choose lower sodium options among similar foods’ and ‘Do not add salt to foods in cooking or at the table’( 16 ). Foods that contributed most to Na may not be recognisable to the consumer as high-Na foods, such as bread, cakes, biscuits and pastries. Moreover, these foods do not typically have low-salt or reduced-salt alternatives readily available. Encouraging individuals to read labels to identify lower-Na products may not adequately support an individual to lower Na intake either, with a recent Food Standards Australia New Zealand report finding that 15 % of 363 packaged and takeaway foods in Australia had Na content ≥20 % above the Na content specified on the label, reflecting inaccuracy of information available( 34 ).
Limitations
In determining the average Na content of Australian food products, calculations were based on the foods that the participants had eaten on the day of the survey and nutrient values were obtained from the nutrient composition database AUSNUT 2011–13( 27 ). No laboratory analyses were conducted to determine Na values of food products and reported Na content was used. The AUSNUT 2011–13 set of files reflects the food supply at the time period and may not accurately reflect the nutrient composition of foods if manufacturers have in this period of time modified the Na content of some foods( Reference Dickinson, Clifton and Burrell 20 ). The results may also not be generalisable to other countries with different Na and K content of the food supply or different eating habits. As the data described are based on one 24 h recall, this does not necessarily represent the respondent’s usual dietary intake or eating pattern.
The current study did not include estimates of discretionary Na (Na from salt added at the table or in cooking) or of Na from dietary supplements or medications, so total daily Na intake reported in the current study is likely to be an underestimate of total Na intake given that 64 % of adults in Australia report adding salt to foods during preparation or at the table.
We also recognise the limitations inherent in the 24 h diet recall method for estimating dietary Na intake. The gold standard for estimating dietary Na intake is using 24 h urinary Na excretion. Estimates presented here based on the 24 h recall data are likely to be an underestimate of total daily Na intake, as we have not been able to account for the amount of discretionary Na added to foods and do not have urinary Na excretion data available. In a recent study, Santos et al. used indirect methods to estimate total daily salt intake among the population in Australia and reported this intake as 9·0–9·9 g/d. This is a much higher estimate than the 6·2 g salt/d reported from dietary intake alone from the AHS 2011–12( Reference Santos, Webster and Land 11 ). A recent cross-sectional study of urinary compared with dietary recall methods to estimate Na intake in a US sample reported low correlation and substantial differences between 24 h diet recall and 24 h urinary Na excretion. It was reported that dietary estimates of Na intake were greater than the values estimated by urinary excretion, with the discrepancy (dietary Na – urinary Na) being greater among men (936·8 mg/d) than women (108·3 mg/d) due to measurement error associated with both measurements( Reference Mercado, Cogswell and Valderrama 39 ). Misreporting can also occur by BMI( Reference Moshfegh, Rhodes and Baer 26 , Reference Espeland, Kumanyika and Wilson 40 ). We also used self-reports of eating occasion in the current study to define meal time and between-meal time eating occasions. The accuracy of these self-reported eating patterns is uncertain( Reference Leech, Worsley and Timperio 41 ).
Implications of findings
This information sheds light on the contribution of foods including cakes, biscuits and pastries to Na intakes in Australian adults. It can inform food manufacturers, dietitians/nutritionists and consumers about the importance of improving food choices between meals in order to reduce Na intake and increase K intake.
Conclusion
The present study identified the major food sources of Na and K consumed by Australian adults at meal time and between-meal time eating occasions. The identification of these foods and their intake in the meal time/between-meal time context is important to inform population and individual consumer strategies to reduce Na intake( Reference Leech, Worsley and Timperio 42 ). These findings can contribute to meal-based approaches to complement current dietary guidelines regarding reducing dietary Na intake and increasing dietary K intake.
Acknowledgements
The data sets analysed during the current study are accessible on request to the Australian Bureau of Statistics (http://www.abs.gov.au/australianhealthsurvey). Financial support: This research received no specific grant from any funding agency in the public, commercial or not-for-profit sectors. Conflict of interest: The authors declare that they have no competing interests. Authorship: K.M.D., L.C. and C.J.M. designed the study, interpreted the results and wrote the manuscript. L.C. performed the statistical analyses. All other authors critically revised the manuscript for important intellectual content and approved the final manuscript. Ethics of human subject participation: The Census and Statistics Act 1905 provides ethics approval for the Australian Bureau of Statistics to conduct the household interview components of health surveys.
Supplementary material
To view supplementary material for this article, please visit https://doi.org/10.1017/S1368980017002968


