Diet-related chronic diseases such as cancer, obesity, cardiovascular disease (CVD) and diabetes disproportionately affect Canadian First NationsReference Hanley, Harris, Gittelsohn, Wolever, Saksvig and Zinman(1–Reference Young, Reading, Elias and O’Neil6). Overweight and obesity are more prevalent among First Nations than in the general Canadian populationReference Harris, Zinman, Hanley, Gittelsohn, Hegele, Connelly, Shah and Hux(2, Reference Anand, Yusuf, Jacobs, Davis, Yi, Gerstein, Montague and Lonn7–Reference Self, Birmingham, Elliott, Zhang and Thommasen9). Overall cancer incidence has been increasing among some First NationsReference Gillis, Irvine, Tan, Chiu, Liu and Robson(10) and First Nations cancer patients have a lower survival period compared with the Canadian population in general(11). The prevalence of CVD is almost three times higher among First Nations than in the general Canadian population(11). The public health, social and economic impact of the diabetes epidemic in First Nations is tremendous in terms of high rates of CVD, renal failure and retinopathyReference Shah, Hux and Zinman(5, Reference Young, Reading, Elias and O’Neil6, 11–Reference Ross and Fick14). A diabetes risk factor study conducted in one First Nations community found the age-standardised prevalence of diabetes and impaired glucose tolerance to be 26·1 % and 13·6 %, respectivelyReference Harris, Gittelsohn, Hanley, Barnie, Wolever, Gao, Logan and Zinman(15). In this population, risk factors associated with diabetes included obesity, high fat intake and low fibre intakeReference Harris, Gittelsohn, Hanley, Barnie, Wolever, Gao, Logan and Zinman(15–Reference Wolever, Hamad, Gittelsohn, Gao, Hanley, Harris and Zinman17).
Little is known about the usual diets of adult First Nations. What is known is on the basis of a few cross-sectional studies, mainly focused on childrenReference Whiting and Mackenzie(18–Reference Wolever, Hamad, Gittelsohn, Hanley, Logan, Harris and Zinman22). What information we do have on First Nations indicates variability in the proportion of traditional foods consumed, with elders consuming these foods much more frequently than childrenReference Wolever, Hamad, Gittelsohn, Hanley, Logan, Harris and Zinman(22).
For the past several decades, First Nations, like many indigenous peoples worldwide, have been changing from a locally obtained diet to one centred on manufactured foodsReference Whiting and Mackenzie(18, Reference deGonzague, Receveur, Wedll and Kuhnlein23, Reference Receveur, Boulay and Kuhnlein24). Changes in the First Nations’ diet and lifestyle have accelerated in the last 40–50 years, associated with settlement on reserves and with increasing prevalence of CVD and other chronic diseasesReference Whiting and Mackenzie(18, Reference Dewailly, Blanchet, Gingras, Lemieux and Holub25).
The traditional First Nations’ diet is defined as one containing plant and animal foods harvested from the local environment; these traditional foods are locally called ‘bush foods’ to reflect their origin from the landReference Whiting and Mackenzie(18). Historically, First Nations were hunter–gatherers and had seasonal patterns of food consumption. Traditional foods are still highly valued among aboriginal people for maintaining health and cultural identityReference Gittelsohn, Harris, Burris, Kakegamic, Landman, Sharma, Wolever, Logan, Barnie and Zinman(26).
Exploration of current patterns of food and nutrient intake among First Nations, and their implications for health indicators, require instruments adapted to the setting and the population. Without accurate knowledge of dietary intake it is difficult to track changes in food intake and to develop culturally appropriate dietary interventions for the reduction of chronic diseases.
The present paper describes an assessment of dietary intake using 24 h dietary recalls in eight First Nations populations. The data were used to: (1) highlight foods for a community-based intervention; and (2) develop a quantitative food-frequency questionnaire (QFFQ) for programme evaluation. However, as so few dietary data are available for these populations, we also describe the diet in terms of food, food group and nutrient intakes.
Methods
Settings and subjects
The study was conducted in eight First Nations (Oji-Cree and Ojibway) in north-western Ontario, where there are over 60 First Nations communities with on-reserve populations ranging from 60 to over 2000 people per community. The semi-remote First Nations in the southern part of the region have road access to nearby non-Native towns. In the north, remote First Nations are isolated by the vast boreal forest and numerous lakes and are accessible only by air for about 10 months of the year. Semi-remote First Nations generally do not have supermarkets, schools or nursing stations on the reserve and instead access these services in the nearest non-Native town. Remote First Nations generally have grocery stores, schools through to 8th grade and nursing stations on the reserve.
Subjects for dietary recalls were selected from four remote First Nations communities – with on-reserve populations of 420, 481, 1125 and 2057, and four semi-remote communities – with on reserve populations of 247, 239, 122 and 151(27). In half of the First Nations communities, subjects were sampled randomly from the band membership list and a fieldworker was asked to contact subjects from this list. If someone was unavailable, after up to five attempts at contact, at different times of the day and on at least two different days, the next person on the list was contacted. If someone was deceased or had moved off the reserve another household was chosen from the list. In the remaining First Nations communities, a membership list was not available; therefore a fieldworker was asked to select from people representing the geographical area of the reserve and also to include people from all age decades (19–90 years) and both sexes. For example, the fieldworkers selected people who lived close to the food store as well as those who lived at the edges of the reserve. The fieldworker was informed of the need for the sample to be representative of the population residing on the reserve and was asked not to purposely select relatives and friends. The majority of the reserves had a fairly small population and within a reserve there was little difference in socio-economic status and access to food. Pregnant and lactating women were excluded.
In First Nations communities where the fieldworker randomly selected subjects from the band membership list, an appointment was set up for the nutrition researchers to visit respondents at home. For subjects who were sampled by the fieldworker, the nutrition researchers either asked the respondent to go to the health centre or an appointment was set up for the nutrition researcher to visit them at home. The project was explained in detail and if signed consent was given, an interview was conducted.
To obtain the maximum diversity in diet within the reserve, only one person per household was selected. If two randomly selected subjects lived in the same household, only one was selected and another household was chosen to provide a 24 h recall.
The study was approved by the Johns Hopkins Bloomberg School of Public Health Committee on Human Research, the University of Western Ontario Ethics Review Board and by the councils of the participating bands. Informed consent was obtained from all respondents.
Sources of data
24 h dietary recalls
Twenty-four-hour dietary recall data were collected (one per individual) by two nutrition researchers (one was a PhD, the other a doctoral student) following a standard manual of proceduresFootnote * in August 2003 and August 2004. The 24 h dietary recall systematically sought and recorded information about foods and drinks consumed during the preceding 24 h period. Portion size was assessed using familiar household units such as a bowl of soup, standard units such as a slice of bread, or three-dimensional food models (NASCO Company, www.eNASCO.com) that had been carefully chosen to best estimate the amount consumed. A range of models was carefully selected with the help of the fieldworkers to represent different portion sizes. We obtained bowls, cups, plates and other household utensils that were familiar to the populations. We also obtained packets of local foods such as chips and chocolate bars so the participants could more easily relate their portion to that available in the store, for store-bought foods. The participants had the freedom to report multiple servings or proportions of servings, such as a half, of each model, household utensil or standard unit such as a slice of bread.
Data from each 24 h dietary recall were recorded on dietary assessment forms. An additional list of questions was included to prompt for easily forgotten foods such as sweets and snacks. All data were examined for completeness by the two nutrition researchers before they left the respondents. Recalls covered both weekdays and weekend days. All interviews were conducted in English except for a few with older respondents who only spoke their Native language; a local fieldworker translated in these cases. On completion of the interview the respondents were given CAN$5 to thank them for their time.
Portion weights
To derive portion weights for all the foods reported in the 24 h dietary recalls, a graduate nutrition student (trained by the first author) conducted food weighing for all the portions assessed by household utensils, three-dimensional food models or standard units for which there were no published data. Weights were assessed using an electronic kitchen scale (Aquatronic Baker’s Dream Scale; Salter Houseware Ltd). The average weight was calculated from 10 measurements. For example, 10 pieces of bannock (a type of bread) were weighed from many sources including home-made, and an average weight was obtained.
Development of the QFFQ
The frequency of foods reported in the 24 h dietary recalls was tabulated. Any food or drink item that was consumed by two or more respondents was included in the draft QFFQ with the exception of foods very low in energy and nutrients, such as condiments and spices.
The ordering of the food list and the selection of food models to assess portion sizes were carefully considered for each food item listed on the draft QFFQ with the assistance from the First Nations fieldworkers. To ensure no foods had been omitted that were consumed by the First Nations respondents, blank lines were added to the draft QFFQ for ‘Any other food items consumed’.
To capture more foods that could be omitted due to seasonality, we also included input from community members and a local dietitian. For example, they suggested some animal meats available mostly in the winter months be added to the draft QFFQ.
A draft QFFQ was pilot-tested in a convenience sample of adult First Nations subjects representing both genders and a wide distribution of ages. Five First Nations fieldworkers and a graduate student were trained by the first author for five days on how to administer the instrument and a manual of procedures was developed. To ensure standardisation of the data collection, each interviewer practised multiple draft QFFQs under the supervision of the first author. The draft QFFQ was then refined accordingly. ‘Any other foods’ that were reported in the draft QFFQ were included to produce the final QFFQ.
Analyses of dietary intake
Nutrient intakes of respondents were estimated from the single 24 h dietary recalls. The recalls were coded and entered by a graduate nutrition student and analysed using Nutribase Clinical Nutrition Manager version 5·18 (CyberSoft Inc., Phoenix, AZ, USA). Nutribase Clinical calculates the nutrient intake and food group servings for each subject using values from the Canadian food composition tables (FCT). The Canadian FCT in Nutribase Clinical were updated to include estimated recipes for eight dishes unavailable in the Nutribase Clinical food composition database, based on information provided by community members and a local dietitian. To evaluate the overall quality of the diet, we compared our food group servings with those recommended by the Canadian Food Guide(28).
To determine the major foods contributing to the intake of energy, fat and sugar, and to highlight the foods for intervention, we combined the percentage contribution for similar foods, such as different sodas and different chips. All other data analyses were undertaken using SAS version 9·1 (SAS Institute Inc., Cary, NC, USA).
Results
Dietary intake
A total of 140 subjects were contacted. Among them, 11 subjects either gave outright refusals or did not complete 24 h dietary recalls. Therefore, a total of 129 recalls were obtained (response rate is 92 %): 65 from the remote and 64 from the semi-remote communities. Seven recalls (six men and one woman) were excluded because of extremely high intakes (>20·92 MJ (>5000 kcal)), leaving 47 men and 75 women with mean age of 42 and 44 years, respectively, in the final analyses.
Table 1 presents the mean and median daily energy, macro- and micronutrient intakes of the study sample by gender, in comparison with dietary intake from the Ontario Food Surveys (OFS) of the non-First Nations Canadian population residing in Ontario(29). Both First Nations men and women in our study sample had higher energy intake than non-First Nations in Ontario. The mean percentage energy provided by fat was 34 % for First Nations men and 32 % for First Nations women; higher than that in non-First Nations Canadians in Ontario(29). The percentage of energy from protein appeared similar in our sampled First Nations and Ontario women. Compared with non-First Nations in Ontario, First Nations in our study sample appeared to have lower vitamin intakes except for vitamin B12. Striking differences were seen in the intake of vitamin B12 between First Nations communities participating in this project and non-First Nations in Ontario participating in the OFS (67 μg vs. 6·1 μg in men and 56 μg vs. 4·3 μg in women), which could be attributed to greater consumption of fish such as trout and wild game foods in our sampled First Nations.
Table 1 Mean (and median) daily energy and nutrient intakes in First Nations (FN) men and women

sd, standard deviation.
*The Ontario Food Survey (OFS) which included non-First Nations(29).
†Retinol equivalents.
‡α-Tocopherol equivalents.
Table 2 presents the number of people who reported consuming traditional foods and the 10 most frequently consumed foods overall. Coffee, tea and sugar were each reported by over 80 people (over 60 %). High-fat and high-sugar foods such as chips and sweetened drinks were also frequently reported. Traditional foods were consumed infrequently by our respondents. Bannock (a type of traditional bread), fish and moose meat were the most common traditional foods consumed.
Table 2 Percentage of First Nations respondents who reported consuming traditional foods and the most commonly consumed foods (n = 129)

Table 3 presents the major food sources of energy, fat and sugar derived from the dietary recalls. The greatest contributors to energy were breads, pasta dishes and chips. Fruits and vegetables did not contribute significantly to total energy intake. Added fats such as butter and margarine made up the single largest food group contributing to total fat intake, followed by chicken dishes and chips. The single largest contributor of sugar to the diet was sugar itself, which was commonly added to coffee and tea. Other major sources of sugar included soda and other sweetened beverages. These three items comprised over 45 % of total sugar consumed. The foods reported in the recalls were grouped in a very similar way to those listed in the Appendix.
Table 3 The 10 major food sourcesFootnote * and the percentage contribution of each food to energy, fat and sugar among First Nations men and women (n = 129)

* * The foods reported in the recalls were grouped in a very similar way to those listed in the Appendix.
Table 4 presents the mean number of servings of each food group consumed by First Nations men and women. Both men and women consumed far fewer servings than recommended for dairy, fruits and vegetables, although servings of meat and meat alternatives were consumed above the recommendation.
Table 4 Mean and median daily servings of food groups consumed by First Nations men and women

*The recommended servings are from Canada’s Food Guide(28).
†The recommendation for vegetables and fruits is 5–10 servings in total per day.
Development of the QFFQ
All foods that were reported in the 24 h dietary recalls by two or more respondents were included on the QFFQ, including both store-purchased and traditional foods. Foods that would be promoted as part of the intervention were also added to the QFFQ in order to track changes in consumption pre- and post-intervention. For example, to lower sugar consumption, artificial sweeteners were recommended as additions to tea and coffee. We therefore added artificial sweeteners to the QFFQ. To reduce sugary drink intake, diet sodas and water instead of regular sodas were recommended and these were listed on the QFFQ. To reduce fat consumption, baked chips were recommended rather than fried chips, and were added on the QFFQ, as well as fruits and vegetables that were not reported in the recalls. Lower-fat spreads were added to the QFFQ as they would be promoted rather than butter or margarine.
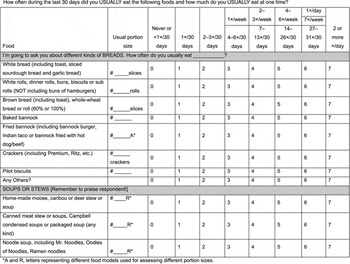
The final instrument has 119 food and drink items and includes seven bread items, five soups or stews, 24 meat- or fish-based dishes, eight rice or pasta dishes, nine fruits, 14 vegetables, four cereals, 18 dairy products, eight sweets, 13 other foods, four beverages and five alcoholic beverages. Frequency of consumption is assessed by eight categories ranging from ‘Never or less than one time in 30 days’ to ‘two or more times a day’. Table 5 lists all items included on the QFFQ. Portion weights were assessed using food models, standard units and familiar household utensils. Forty-eight food items have portion size assessed using a standard units such as a slice of bread, 36 food items are assessed using three-dimensional food models, and 36 using household units such as a bowl or cup. Respondents are asked to recall intake over the last 30 days. A sample page of the QFFQ is given in the Appendix.
Table 5 Food and drink items listed on the First Nations quantitative food-frequency questionnaire

Discussion
Knowledge of food, food group consumption and food sources of nutrients is essential for planning effective nutrition intervention studies. One objective of the current study was to describe the important food sources of energy, fat and sugar, and food and nutrient intakes, for First Nations in north-western Ontario so we could develop an intervention specifically designed to meet local needs. Our study found that the major sources of sugar intake were sodas and other sweetened beverages, and sugar added to tea or coffee. Foods that highly contributed to energy and fat intake were from a variety of food groups such as breads, pastas, chicken dishes, chips and added fats. High popularity and high-volume consumption of these foods explain why they are significant food sources of many nutrients. Fruits and vegetables were not frequently consumed in First Nations communities participating in this project. The mean daily intakes of fruit and vegetable servings were much lower than recommended.
The timing of the nutrition transition in this population is complex, has been going on for decades (centuries for some groups whose treaty arrangements included flour, sugar, tea, lard) and continues today. The shift varies by degree of isolation and age, and is even different between different families within individual communities, but was probably accelerated in the 1960s in this specific region (central sub-Arctic)Reference Young(30). Based on formative research conducted in the participating interviews(31), elders reported consuming primarily traditional foods when they were young, with the exception of commodities such as tea, flour and lard bought from trading posts. More market foods in the diet appeared as community members were forced to settle on their current reserve lands to access services such as schools and electricity, and full-time trapping became more difficult. As highways and airstrips were built in the 1960s and 1970s, an increasing amount of market foods became readily available to community members.
Energy and fat intakes were high in our sampled First Nations. In a study of dietary intakes of 16 aboriginal communities in the Northwest Territories, Receveur et al.Reference Receveur, Boulay and Kuhnlein(24) found that among Dene and Metis populations there was a shift away from traditional foods to market foods, with associated increases in energy, carbohydrate, total fat and saturated fat intakes. Communities with low traditional food intake had approximately 15 % higher total energy, carbohydrate, total fat and saturated fat intakesReference Receveur, Boulay and Kuhnlein(24). In a recent survey across Canada, only 35 % of First Nations adults reported consuming a balanced and nutritious diet always or almost always, while 12 % rarely or never consumed a balanced and nutritious diet(4). Our findings provide additional support to these observed trends. In addition, differences in the median percentage energy provided by fat in both men and women were also observed between our study sample and the general Canadian population in the 2004 Canadian Nutrition Survey (35 % vs. 31·6 % in men, 33 % vs. 32·2 % in women)(32). However, daily median intakes of calcium and vitamin C were much lower in our sampled First Nations compared with men and women in the 2004 Canadian Nutrition Survey(32). Differences in calcium intake may also be due to the fact that we did not biochemically analyse the recipes but obtained the nutrient composition from calculations. It is possible that calcium from bone fragments was not accounted for, and hence our calcium intakes may in fact be lower than the true values consumed. Higher fat intake in First Nations in our study sample compared with both non-First Nations in Ontario and the general Canadian population could be related to a high consumption of added fat such as butter and margarine and snack foods such as chips and popcorn. Our results are also similar to other studies of Native North American dietReference Young(30, Reference Waldram, Herring and Young33) in that the diet is characterised by consumption of many less nutrient-dense foods providing mainly fat and sugars.
FFQs measure usual intake, an advantage over other dietary assessment methods such as short-term recalls and diet recordsReference Willett(34). Obtaining an appropriate food list for a unique population is the most crucial step in the process of developing an FFQReference Shahar, Fraser, Shai and Vardi(35). The foods selected must be commonly consumed and contain significant amounts of nutrients or foods of interestReference Cade, Thompson, Burley and Warm(36–Reference Willett38). Our QFFQ included all foods reported in the 24 h dietary recalls by two or more respondents and any other foods reported by a local dietitian or the community members that may not have been reported due to seasonality. It was also locally adapted by involving First Nations in the development of the instrument, who assisted with composing and ordering of the food list and selecting food models to assess portion sizes. Their input allowed us to appropriately incorporate traditional foods into the instrument. Our final QFFQ does contain foods available at other times of the year, both traditional and non-traditional. The QFFQ will be used to evaluate a nutrition intervention programme and to track changes in the consumption of promoted foods and less healthy food choices such as chips and sodas. As in other studies, portion sizes for the QFFQ were assessed using appropriate food models to aid the participants in describing their usual amount consumedReference Sharma, Cade, Landman and Cruickshank(39).
Development of a locally appropriate dietary assessment instrument is crucial for accurately assessing diet in cultural groupsReference Teufel(40). Smith et al.Reference Smith, Nelson, Hardy, Manahan, Bennett and Knowler(41) undertook a survey of Pima Indians in the Gila River Indian Community in Arizona using both 24 h dietary recalls and an FFQ. The FFQ yielded approximately 30 % higher total energy results than the recalls and suggests that the FFQ may be a more accurate method of estimating energy and nutrient intakes of Pima Indians. Hence, there is a need to develop an FFQ to assess more accurately the diet of First Nations.
A few studies have assessed traditional food intake and food intake in general among Native North Americans and have examined overall dietary quality using 24 h dietary recalls and FFQsReference Batal, Gray-Donald, Kuhnlein and Receveur(42, Reference Bersamin, Luick, Ruppert, Stern and Zidenberg-Cherr43). These studies illustrate the important contribution that traditional foods make to Native North American diets. Our dietary recall results show a low consumption of traditional foods, although data were collected during August in both years and may not have captured traditional foods consumed in other months. These findings agree with those of Wolever et al.Reference Wolever, Hamad, Gittelsohn, Hanley, Logan, Harris and Zinman(22) who found significant traditional food consumption only among the oldest respondents in a remote First Nations community.
Murphy et al.Reference Murphy, Schraer, Thiele, Boyko, Bulkow, Doty and Lanier(44) examined diet using an FFQ in Alaska Natives residing along the Yukon and Kuskokwim rivers who consume seal, walrus and beaver that are not available to our study of north-western Ontario First Nations. Among non-traditional foods, pilot biscuits, white bread, potatoes and rice were more frequently reported in Alaska NativesReference Murphy, Schraer, Thiele, Boyko, Bulkow, Doty and Lanier(44) than in our study on First Nations. This again highlights differences in dietary practices between different Native North American populations and emphasises the need for developing population-specific FFQs.
The dietary data were used to help develop an integrated multilevel intervention strategy to reduce diet- and lifestyle-related risk factors for diabetes in First Nations populations. Components of the intervention that focused on diet were based on identifying and promoting affordable and acceptable healthier alternatives to the foods that contributed the greatest amount of energy, fat and sugar in adults in the seven First Nations. The Zhiiwaapenewin Akino’maagewin: Teaching to Prevent Diabetes (ZATPD) programme was an integrated multi-institutional diabetes prevention programme with school, store and community components. The primary goals of the intervention were to improve dietary choices and physical activity by increasing knowledge, self-efficacy and attitudes about healthier behaviours, as well improving availability or opportunities to perform them. The three components were integrated through five thematic phases lasting six to eight weeks each. For instance, when students were learning about added sugar in beverages, the store component promoted beverages lower in sugar, and in band offices the programme assistant worked to improve the beverage choices offered and conducted taste tests of healthier options. Initial findings show that the intervention was successful in improving knowledge and increased the purchasing of healthy foodsReference Gittelsohn, Harris, Burris, Kakegamic, Landman, Sharma, Wolever, Logan, Barnie and Zinman(26). One intention of working with school, store and health/social services staff was to integrate programme activities with existing activities in order to promote sustainability of the programme after the end of the funded intervention.
The work described has limitations. Our results were based on single 24 h dietary recalls, and the sample is not representative of all Canadian First Nations. The sample for this study was not entirely random, which limits our ability to generalise to other First Nations in the region. On the other hand, our sampling frame was stratified by reserve, gender and age group in order to ensure we had respondents who consumed a range of foods and were from a variety of economic circumstances, characteristics essential for the development of an effective intervention. In light of the enormous cultural and geographic heterogeneity of aboriginal communities in Canada, our QFFQ and our choice of foods for intervention are likely to be more appropriate to the communities in the sub-Arctic boreal forest regions of central Canada rather than all First Nations. It should also be noted that the primary purpose of the project was to identify foods for inclusion on a QFFQ and highlight foods and drinks for intervention, and not to describe nutrient intake. To date, we have not conducted a validation study of the QFFQ; this is planned for next year.
Conclusions
This study developed, for the first time, an up-to-date, culture-specific QFFQ which will enable us to assess the effectiveness of a community-based intervention and track changes in consumption of targeted foods, as well as determine overall food, food group and nutrient intakes in Canadian First Nations in north-western Ontario. This study adds to the limited literature on adult First Nations dietary intake. The data resulting from the 24 h dietary recalls provided strong justification for targeting specific foods for an intervention aimed at reducing risk of diabetes and other chronic diseases in First Nations. This instrument will be used as part of the evaluation strategy for a main trial of the intervention to be implemented in many First Nations communities.
Acknowledgements
The research was supported by an American Diabetes Association Clinical Research grant (7-04-CR-15) and by a grant from the Canadian Institutes for Health Research. We would like to thank the Chief and Council and community members of participating First Nations for their cooperation. We are grateful to the staff and students for their assistance with the project.
Appendix – Sample page of the quantitative food-frequency questionnaire