


Introduction
Nutrition transition includes changes in dietary patterns and nutrient intakes observed as populations go through economic and social development(Reference Popkin1). It has been associated with concomitant increases in obesity and nutrition-related non-communicable diseases (NR-NCDs), which are now among the leading causes of death globally(Reference Naghavi, Abajobir and Abbafati2). In African countries, the risk of NR-NCDs is increasing at a faster rate and at a lower economic threshold than in high-income countries. Changes in dietary behaviours could account, in part, for this increased disease risk(Reference Vorster, Kruger and Margetts3). The generalised patterns of dietary change associated with nutrition transition include increased consumption of fat, particularly vegetable and edible oils, increased added sugar, increased animal-source foods and decreases in cereals and fibre(Reference Popkin1,Reference Popkin and Gordon-Larsen4) , specifically coarse grains, staple cereals and pulses(Reference Hawkes, Harris and Gillespie5). However, the exact nature of changes in dietary behaviours and the foods that drive nutrition transition vary according to the region.
Evidence of how dietary behaviours are changing in urban populations in African countries is lacking, although food balance sheets show that most countries have experienced an increase in the national availability per capita energy, fat, protein and sugar(Reference Steyn and Mchiza6). Ghana and Kenya are two middle-income countries experiencing rapid urbanisation and increasing levels of overweight/obesity and NR-NCDs(Reference Tenkorang, Kuuire and Luginaah7). We selected these two countries as representing different cultural contexts of nutrition transition (East and West Africa), and because both countries are undergoing rapid economic development, urbanisation and increases in obesity prevalence. In Ghana, overweight and obesity in women aged 15–49 years tripled from 13·2 % to 40·1 % between 1993 and 2014(Reference Doku and Neupane8). In Kenya, one-third of women are overweight or obese(9). In Ghana and Kenya, NCDs account for >40 % of total morbidity and are now recognised as pressing public health concerns evidenced by interventions to promote healthy diets(Reference de-Graft Aikins, Addo and Ofei10–12). However, dietary behaviours in urban African populations have not been systematically reviewed in relation to how diets are postulated to change in the context of nutrition transition.
We aimed to assess the strength of evidence of nutrition transition in urban Africa based on the reported changes in dietary behaviours stated in the literature in low- and middle-income countries (LMICs) undergoing transition(Reference Popkin1,Reference Popkin and Gordon-Larsen4,Reference Hawkes, Harris and Gillespie5) . In line with the reported changes with nutrition transition in other studies, we aimed to examine dietary behaviours related to: macronutrient profiles indicating a higher proportion of energy intake from fats and a lower proportion from carbohydrate(Reference Popkin1,Reference Popkin and Gordon-Larsen4) ; a high consumption of animal-source foods, edible oils, energy-dense snack foods, sweetened beverages, processed foods and sugary snacks in the food items consumed(Reference Vorster, Kruger and Margetts3); enhanced dietary diversity(Reference Aurino, Fernandes and Penny13); and less structured dietary practices reflected in more food or meals eaten away from home and an increase in processed, convenience and ‘fast’ foods. The aim of the study was to synthesise evidence of urban dietary behaviours (macronutrients, types of foods, dietary diversity and dietary practices) in two African countries in relation to postulated changes in the context of nutrition transition.
Methods
Review typology
A systematic review of dietary behaviours in populations of urban adolescents and adults living in Ghana and Kenya was undertaken to systematically search for, appraise and synthesise research evidence(Reference Grant and Booth14). The review was conducted in line with the PRISMA statement(Reference Moher, Alessandro and Jennifer15). A meta-analyses was conducted on data from quantitative studies where feasible. The review protocol was registered with Prospero (CRD42017067718).
Inclusion and exclusion criteria
Inclusion criteria for the review were studies of males and females aged 13–18 years (adolescents) or >18 years of age (adults) living in urban areas of Ghana or Kenya with a quantitative primary outcome of diet or dietary behaviours. Diet was defined as food consumption patterns. Dietary behaviours were defined as a combination of eating habits, preferences, choices and feeding-related mannerisms(Reference Stok, Hoffmann and Volkert16). Eligibility criteria for the searches included evidence dating from 1971 to present in line with the concept of epidemiological transition theory(Reference Omran17). Published articles and academic theses available through online repositories (Masters and PhD) in the English language were included.
Exclusion criteria included studies based on a purposively selected specialist sample that was likely to influence dietary behaviours (e.g., long-distance runners, vegetarians, patients with HIV or AIDS) and clinical studies of inpatients. Where studies included a healthy control or comparison group, data from the comparison group were extracted.
Search strategy
We developed a search strategy and conducted searches in six electronic databases: MEDLINE, EMBASE, PsycINFO, CINAHL, ASSIA and Africa Index Medicus (see online supplementary material 1 for example of MEDLINE search strategy). Relevant institutional repositories were searched for grey literature followed by searches in Google Scholar to obtain abstracts and full texts. Institutional online repository searches included nine Kenyan and four Ghanaian universities with nutrition departments offering postgraduate courses (see online supplementary material 2); the UK White Rose collection (Universities of Sheffield, York and Leeds); and those of the top ten UK universities for research on food and nutrition in Africa according to the Web of Science. Hand-searches of reference lists of included literature were carried out alongside data extraction. Citation follow-up was used to identify studies missed by electronic and grey literature searches. Electronic database searches were carried out from 25 to 28 July 2017; grey literature searches were completed by 11 October 2017; and hand-searches and requests to authors for data continued up to 31 January 2018.
Screening
Duplicates were removed before screening. Title and abstract and subsequently full-text items were screened against the inclusion criteria listed above by a team (KB, RP, JT, HO-K). An independent reviewer (ER) checked a 10 % random sample of excluded records at the title-and-abstract and full-text screening stages. Any disagreements were resolved via discussion. If one study led to more than one publication presenting the same data, only one publication record was included for data synthesis and meta-analyses. If publication records presented different data from a single study, all records were included in data synthesis.
Data extraction
Data were extracted using a standardised data extraction spreadsheet in Excel by eight reviewers (ER, RP, KB, HO-K, RAk, RAr, SM, JT). A draft data extraction form was piloted by all extractors, modified following discussion, then finalised. Two reviewers (RP, ER) checked and gave feedback on a sample of data extraction by each assessor to ensure consistency of extraction and recording. Data were extracted on title, author(s), year, study design, study aim, publication type, setting, country (Kenya/Ghana), city, sample characteristics (age, sex, socioeconomic indicators), methods (sample size, sampling strategy, design, method of measurement, data management), outcome measures (type of dietary behaviour studied), analysis and results and study limitations. Where data could not be extracted from the publication, we contacted the authors to request relevant data (e.g., disaggregated data from pooled urban and rural samples, or pooled for more than one country).
Figure 1 presents the framework of dietary behaviours of relevance to nutrition transition. Reported dietary behaviours were divided into nutrient-based and food-based behaviours, then categorised as: (i) energy and macronutrient intake, (ii) food items consumed, (iii) dietary patterns using data reduction techniques (e.g., principal component analysis), (iv) dietary diversity and food variety and (v) dietary practices. Dietary patterns were defined as ‘the quantities, proportions, variety, or combination of different foods, drinks and nutrients in diets, and frequency of habitual consumption’(Reference Reedy, Subar and George18). Dietary practices were defined as the foods consumed (e.g., type of snacks, street foods), where, how and with whom foods were eaten, and where ingredients were purchased(Reference Tuomainen19). Studies often included more than one type of dietary behaviour.

Fig. 1 Framework of dietary behaviours of relevance to nutrition transition
Quality assessment
Each document included in the review was rated using a 14-criterion quality assessment tool(Reference Kmet, Cook and Lee20). This was modified from the original tool by replacing the score for each criterion (0, 1, 2) with a qualitative assessment of high quality/green (low risk of bias), medium quality/yellow or low quality/red (high risk of bias) as Cochrane guidance advises against the use of scores(Reference Higgins and Green21). Quality assessment was conducted by eight assessors working in four teams. The first and second reviewer independently completed a quality assessment rating for each record. Following this, they compared ratings and came to an agreed rating for each criterion. Two assessors (ER and RP) undertook checks of every agreed rating by the review teams. Online supplementary material 3 provides a summary of the quality assessment for each of the fourteen criteria as well as the overall quality assessment for included studies.
The overall quality assessment of each publication (high, medium or low quality) was calculated based on the quality rating for four out of fourteen individual criteria that were of most relevance to the types of studies included (observational, cross-sectional studies) and those that reflected the quality and interpretation of dietary data. These included: criteria 3 ‘Is the method of subject/comparison group selection or source of information/input variables described and appropriate?’; criteria 8 ‘Is the outcome and (if applicable) exposure measure(s) well defined and robust to measurement bias?’; criteria 10 ‘Are the analytic methods described/justified and appropriate?’; and criteria 13 ‘Are results reported in sufficient detail?’ Further details of methods to assign overall quality are provided in online supplementary material 3.
Data synthesis and analysis
Data were grouped and analysed according to the relevant dietary behaviour(s): (i) energy and macronutrient intakes (fat, carbohydrates and protein), (ii) food items consumed, (iii) dietary patterns, (iv) dietary diversity and food variety and (v) dietary practices.
Energy and macronutrient intakes
Data on energy, protein, fat and carbohydrate intakes were extracted for meta-analyses. Mean energy intakes were recorded as kcal/d. The percentage of energy from protein, fat and carbohydrate were either extracted directly or calculated from intakes reported as g/d. Data for male and female samples were retained separately in the meta-analyses where available. Where two records came from the same study, we selected the record that provided the most detailed or more reliable macronutrient intake data(Reference Mbochi, Kuria and Kimiywe22,Reference Steyn, Parker and Nel23) . Intakes were compared to the WHO population nutrient intake goals of carbohydrate, fat and protein for the reduction of risk of NR-NCDs (carbohydrate 55–75 %, fat 15–30 % and protein 10–15 %)(24).
Data synthesis was performed using random-effects meta-analyses to account for the expected heterogeneity between studies, with heterogeneity expressed using the I 2 statistic(Reference Higgins and Thompson25). Total energy intake (kcal/d), stratified by country, was synthesised using the ‘metan’ command in Stata. The percentage of energy consumed was synthesised using the ‘metaprop’ command, incorporating the Freeman–Tukey double arcsine transformation of proportions to stabilise variances(Reference Freeman and Tukey26). The pooled result and 95 % CIs were back-transformed for interpretation, and forest plots were generated. Analyses were performed in Stata MP, version 15.1. A narrative synthesis was conducted for studies reporting macronutrient intakes that could not be included in the meta-analyses.
Food items consumed
A meta-analyses was carried out at the food group (rather than food item) level because heterogeneity between studies was too high at the food item level. To achieve data consistency, a list of 182 food items categorised into eighteen food groups was generated based on the markers of nutrition transition from the literature(Reference Popkin1,Reference Vorster, Kruger and Margetts3,Reference Popkin and Gordon-Larsen4,Reference Amugsi, Lartey and Kimani27–Reference Okutu29) . Additional details on the method of grouping food items for the meta-analyses can be found in online supplementary material 4. The same statistical methods were employed as for macronutrient intakes. Results were not stratified by country due to the low number of studies. Studies excluded from the meta-analyses were reviewed by narrative synthesis.
Dietary patterns, dietary diversity and dietary practices
Data on dietary patterns, dietary diversity and dietary practices were synthesised narratively due to high heterogeneity. Dietary practices were synthesised as: (i) meal patterns and snacking behaviour, (ii) eating out of home and (iii) food provisioning. Eating out of home included: purchase of fast foods, frequency of street food consumption and eating out. Meal patterns were defined as consuming food at the expected three meals a day. Snacks were defined either as food consumed outside of typical meal times or by the authors’ own descriptions. This allowed us to investigate whether there was de-structuration of eating towards a less traditional, unstructured meal pattern.
Results
The search yielded 2973 records. After removal of duplicates, 2715 titles and abstracts were screened (see Fig. 2). Of these, 116 records qualified for full-text screening, and fifty-nine records were excluded at the full-text stage. The remaining records, plus an additional five articles from searches of reference lists, met the inclusion criteria and were included in the review.
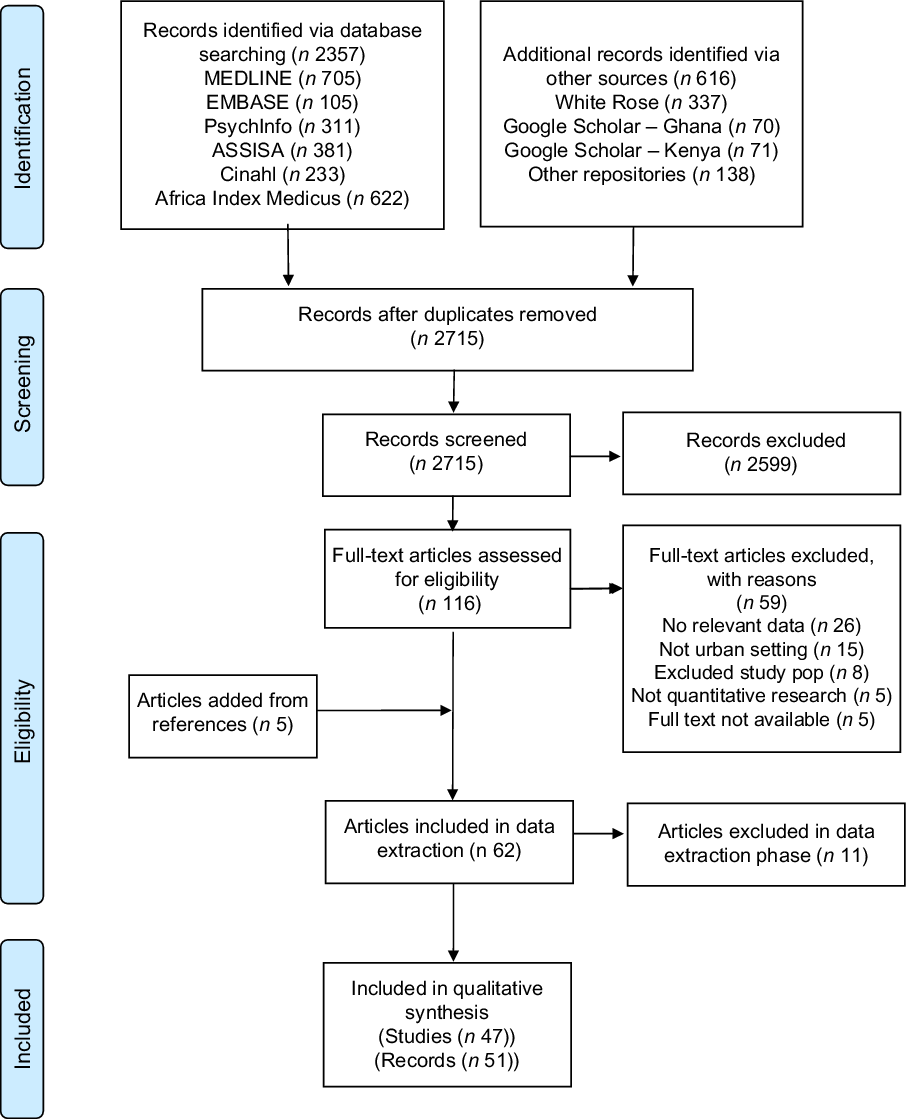
Fig. 2 Flow diagram of study selection process
Description of studies
Fifty-one records were included from forty-seven studies dating from 1988 to 2017: twenty-seven records (twenty-six studies) from Ghana and twenty-four records (twenty-one studies) from Kenya. The records included nineteen theses (eighteen Masters’, one PhD). Most studies included adults only (thirty-five studies); four studies included adolescents only; and eight studies included adults and adolescents(Reference Amugsi, Lartey and Kimani27–Reference Watson, Ngesa and Onyang’o34). Thirty-two studies comprised mixed samples of males and females, while fifteen studies included only females(Reference Mbochi, Kuria and Kimiywe22,Reference Amugsi, Lartey and Kimani27,Reference Nti, Inkumsah and Fleischer35–Reference Kamau-Mbuthia and Elmadfa42) . A total of 12 065 participants and a further 1452 households were included from Ghana; a further 8661 individuals as well as 5074 households were included from Kenya (total 20 726 individuals plus 6526 households). The sample size of participants in individual studies ranged from 19 to 4037. Details of all included studies and participant characteristics are provided in online supplementary material 5.
The earliest included study dated from 1988. From the first three decades of the search period (1971–2000), there were only nine studies from both countries. From 2000 to 2010, there were a further fourteen studies, and post-2010, there were twenty-four studies. The measurement tools used to assess dietary behaviours were FFQs (thirty-four studies)(Reference Mbochi, Kuria and Kimiywe22,Reference Asiedu28–Reference Shell-Duncan and Yung33,Reference Nti, Plahar and Larweh36–Reference Quarshie38,Reference Cornelsen, Alarcon and Häsler41,Reference Abbey43–Reference Wathome65) , food practices questionnaires (seven studies)(Reference Watson, Ngesa and Onyang’o34,Reference Cornelsen, Alarcon and Häsler41,Reference Hiamey, Amuquandoh and Boison50,Reference Thuita, Mwadime and Wang’ombe64,Reference Opare-Obisaw66–Reference Mukasa-Mwanthi68) and 24-h recall (twenty-eight studies)(Reference Mbochi, Kuria and Kimiywe22,Reference Steyn, Parker and Nel23,Reference Amugsi, Lartey and Kimani27,Reference Nkirigacha31,Reference Onyango, Walingo and Othuon32,Reference Nti, Inkumsah and Fleischer35,Reference Nti, Plahar and Larweh36,Reference Tayie39,Reference Dominguez-Salas, Alarcón and Häsler40,Reference Kamau-Mbuthia and Elmadfa42,Reference Agyeman-Nkansah44,Reference Barichella, Akpalu and Cham46,Reference Frank, Kröger and Schulze48,Reference Kerr-Rabbles52,Reference Ofori-Koranteng55,Reference Takyi and Amankwa57,Reference Ethangatta59,Reference Okoth61,Reference Theuri63,Reference Thuita, Mwadime and Wang’ombe64,Reference Kemunto67–Reference Van’t Riet, Den Hartog and Van Staveren72) . One study employed a 7-d food diary(Reference Mboganie-Mwangi and Foeken73). There were twenty-three studies on macronutrient intake, twenty-eight studies on food items consumed, nine studies on dietary diversity and food variety, two on dietary patterns and thirteen on dietary practices (see online supplementary material 5).
Quality assessment summary
Online supplementary material 3 shows a summary of quality assessment for each included record. We assessed thirteen records (25·5 %) as high quality(Reference Mbochi, Kuria and Kimiywe22,Reference Kimani-Murage, Schofield and Wekesah30,Reference Dominguez-Salas, Alarcón and Häsler40,Reference Galbete, Nicolaou and Meeks49,Reference Wu, Guo and Chatterji53,Reference Bloomfield, Mwangi and Chege58, Reference Okoth61–Reference Theuri63, Reference Minicuci, Biritwum and Mensah70, Reference Van’t Riet, Den Hartog and Van Staveren72, Reference Steyn, Parker and Nel74), twenty-five records (49·0 %) were of medium quality(Reference Steyn, Parker and Nel23,Reference Amugsi, Lartey and Kimani27,Reference Okutu29,Reference Nkirigacha31,Reference Onyango, Walingo and Othuon32,Reference Nti, Plahar and Larweh36,Reference Quarshie38,Reference Cornelsen, Alarcon and Häsler41,Reference Kamau-Mbuthia and Elmadfa42,Reference Blay, Astrøm and Haugejorden47,Reference Frank, Kröger and Schulze48,Reference Hiamey, Amuquandoh and Boison50–Reference Kerr-Rabbles52,Reference Sowah56,Reference Takyi and Amankwa57,Reference Ethangatta59,Reference Mbotela60,Reference Wathome65–Reference Kemunto67,Reference Lokko, Lartey and Armar-Klemesu69,Reference Pereko, Setorglo and Owusu71,Reference Mboganie-Mwangi and Foeken73,Reference Mbochi75) and thirteen (25·5 %) were of low quality(Reference Asiedu28,Reference Watson, Ngesa and Onyang’o34,Reference Nti, Inkumsah and Fleischer35,Reference Opare-Obisaw, Fianu and Awadzi37,Reference Tayie39, Reference Abbey43–Reference Barichella, Akpalu and Cham46, Reference Nti, Brown and Danquah54, Reference Ofori-Koranteng55, Reference Thuita, Mwadime and Wang’ombe64, Reference Mukasa-Mwanthi68). Overall, 74·5 % were of high or medium quality, indicative of reliable evidence and low risk of bias.
Summary of dietary behaviours
Macronutrient intakes
Overall summary. Twenty-three studies reported energy and macronutrient intakes: eleven from Ghana and twelve from Kenya. Most studies (nineteen out of twenty-three) employed a 24-h recall method to quantify intakes, and four studies used an FFQ (see online supplementary materia1 5). There were no studies from 1970s or 1980s, five studies from 1990s, and the remainder were from 2000 onwards (eighteen) (Online supplementary material 6).
Meta-analyses. Figures 3(a)–3(d) presents energy and macronutrient intakes by year of study. No trend in intake over time was apparent, and longitudinal analysis was not conducted due to high heterogeneity. Mean energy intake was 1849 kcal/d (95 % CI 1700, 1998) from nine studies in Ghana v 1889 kcal/d (95 % CI 1762, 2017) from six studies in Kenya (Fig. 3(a)). The contribution of carbohydrates to total energy intake was 62·9 % (95 % CI 59·2, 66·6) in Ghana and 59·6 % (95 % CI 55·5, 63·6) in Kenya (Fig. 3(b)). Energy intake from fat was 24·7 % (95 % CI 21·2, 28·3) in Ghana and 25·8 % (95 % CI 22·1, 29·6) in Kenya (Fig. 3(c)). Protein comprised just below 14 % of total energy intake in both countries (Ghana: 13·6 %, 95 % CI 11·8, 15·6; Kenya: 13·8 %, 95 % CI 11·6, 16·0) (Fig. 3(d)). Heterogeneity between studies, as evidenced by the I 2 statistic, was substantial (I 2 > 90 %).

Fig. 3a Total daily energy intake. m = males, f = females, mix = both sexes. * Dagoretti, ** Korogochi. 1 kcal = 4.184 kJ

Fig. 3b Percentage of total energy from carbohydrates. m = males, f = females, mix = both sexes. * Dagoretti, ** Korogochi

Fig. 3c Percentage of total energy from fat. m = males, f = females, mix = both sexes. * Dagoretti, ** Korogochi

Fig. 3d Percentage of total energy from protein. m = males, f = females, mix = both sexes. * Dagoretti, ** Korogochi
Narrative synthesis. Among the studies excluded from the meta-analyses, mean energy intake was 1855 kcal/d (no sd) among working women(Reference Nti, Plahar and Larweh36). Two studies reported assessing dietary intakes but did not present data in a usable format(Reference Mbochi, Kuria and Kimiywe22,Reference Van’t Riet, Den Hartog and Mwangi62) . Mbotela(Reference Mbotela60) reported that 7·8 % of the sample (n 102) consumed ‘adequate’ carbohydrate (author’s definition), 15·6 % consumed ‘adequate’ protein and 5·9 % ‘adequate’ fat. Wathome(Reference Wathome65) reported energy consumptions of 2700 kcal/d (high income), 2500 kcal/d (middle income) and 2400 kcal/d (low income).
Food items consumed
Overall summary. Twenty-eight studies reported food consumption data: seventeen in Ghana(Reference Amugsi, Lartey and Kimani27–Reference Okutu29,Reference Opare-Obisaw, Fianu and Awadzi37,Reference Abbey43–Reference Wu, Guo and Chatterji53,Reference Sowah56,Reference Takyi and Amankwa57) and eleven in Kenya(Reference Mbochi, Kuria and Kimiywe22,Reference Nkirigacha31,Reference Onyango, Walingo and Othuon32,Reference Watson, Ngesa and Onyang’o34,Reference Cornelsen, Alarcon and Häsler41,Reference Bloomfield, Mwangi and Chege58,Reference Ethangatta59,Reference Okoth61,Reference Thuita, Mwadime and Wang’ombe64,Reference Wathome65,Reference Kemunto67) . Most studies (twenty-six out of twenty-eight) used an FFQ to assess food consumption patterns; one study used a 24-h recall; and another one employed a food practices questionnaire. The reporting of food items and methods of data synthesis and coding prior to the meta-analyses is provided in Online supplementary material 5.
Meta-analyses. Data from fifteen studies were included in the meta-analyses: nine from Ghana(Reference Amugsi, Lartey and Kimani27,Reference Asiedu28,Reference Opare-Obisaw, Fianu and Awadzi37,Reference Abbey43–Reference Ansong45,Reference Blay, Astrøm and Haugejorden47,Reference Kerr-Rabbles52,Reference Takyi and Amankwa57) and six from Kenya(Reference Mbochi, Kuria and Kimiywe22,Reference Nkirigacha31,Reference Bloomfield, Mwangi and Chege58,Reference Ethangatta59,Reference Thuita, Mwadime and Wang’ombe64,Reference Kemunto67) . An estimated 68·8 % of the sample consumed animal-source foods (95 % CI 57·9, 78·8) (Fig. 4). Dairy products were consumed most commonly (87·1 %, 95 % CI 68·1, 98·3), followed by red meat (85·9 %, 95 % CI 57·0, 99·8), poultry (69·6 %, 95 % CI 50·0, 86·2), eggs (68·5 %, 95 % CI 36·0, 93·3), fish (46·6 %, 95 % CI 25·2, 68·6) and processed meat (28·0 %, 95 % CI 25·3, 30·9).

Fig. 4 Proportion of sample consuming animal-source foods. m = males; f = females; mix = both sexes; G = Ghana. I 2 not calculated for items with less than four studies
Fruit, vegetables or legumes were consumed by half of the sample (51·6 %, 95 % CI 33·9, 69·0) (Fig. 5). Vegetables, excluding potatoes and starchy roots, were the most commonly consumed (63·7 %, 95 % CI 0·0, 100·0), followed by fruit (55·2 %, 95 % CI 9·8, 95·5), vitamin A-rich dark green leafy vegetables (54·5 %, 95 % CI 31·4, 76·6), fruit and vegetables (53·3 %, 95 % CI 2·8, 99·1), legumes (29·7 %, 95 % CI 28·1, 31·3) and vitamin A-rich fruit and other vegetables (27·2 %, 95 % CI 25·4, 29·1).

Fig. 5 Proportion of sample consuming fruit, vegetables and legumes. m = males; f = females; mix = both sexes; G = Ghana. I 2 not calculated for items with less than four studies
An estimated 29·4 % (95 % CI 20·7, 39·0) of the sample consumed unhealthy food and drink (i.e., vegetable fats (including palm oil), sugar-sweetened beverages (SSBs), cakes and biscuits, chocolate and sweets, alcohol, animal fats) (Fig. 6). These foods and drinks were classed as unhealthy based on their properties of being either energy-dense (fats, cakes, biscuits, chocolates and sweets) or nutrient-poor (alcohol and SSBs). We did not distinguish between vegetable fat and animal fat since this information was not always available and because the percentage of energy from total fat is associated with unhealthy weight gain in LMICs. SSBs were consumed by the highest proportion of the population (39·9 %, 95 % CI 20·6, 61·0), followed by cakes and biscuits (32·6 %, 95 % CI 29·2, 36·0), vegetable fats (23·2 %, 95 % CI 21·0, 25·5) and chocolates and sweets (31·3 %, 95 % CI 27·7, 34·9). No studies reported on the consumption of savoury snacks. Only 14·0 % of the sample consumed alcohol (95 % CI 11·4, 16·8) and 15·0 % animal fats (95 % CI 11·7, 19·0). Heterogeneity between studies, as evidenced by the I 2 statistic, was substantial (I 2 > 90 %).

Fig. 6 Proportion of sample consuming ‘unhealthy’ food items. m = males; f = females; mix = both sexes; G = Ghana. I 2 not calculated for items with less than four studies
Narrative synthesis
Data from thirteen studies could not be pooled for meta-analyses: eight from Ghana(Reference Okutu29,Reference Barichella, Akpalu and Cham46,Reference Frank, Kröger and Schulze48–Reference Jolly, Awuah and Fialor51,Reference Wu, Guo and Chatterji53,Reference Sowah56) and five from Kenya(Reference Onyango, Walingo and Othuon32,Reference Watson, Ngesa and Onyang’o34,Reference Cornelsen, Alarcon and Häsler41,Reference Okoth61,Reference Wathome65) . Of these, two studies examined a single item unrelated to nutrition transition (fermented foods(Reference Watson, Ngesa and Onyang’o34) and groundnut consumption(Reference Jolly, Awuah and Fialor51). One study examined foods consumed in a specific market area(Reference Hiamey, Amuquandoh and Boison50). Data from one study were inaccessible(Reference Onyango, Walingo and Othuon32). The remaining studies are synthesised narratively below.
Animal-source foods
Milk and dairy products
Seven papers reported milk/dairy consumption. In Kenya, milk consumption/purchase per household ranged from 2923 g/week (±2685 g)(Reference Cornelsen, Alarcon and Häsler41) to 7416 g/week (sd not provided)(Reference Wathome65). Per person, 683 g/week (±795 g) of milk was purchased(Reference Cornelsen, Alarcon and Häsler41). Frequency of milk consumption ranged from 1·8(Reference Okoth61) to 14·5 times per week(Reference Wathome65).
In Ghana, one study reported dairy product consumption of 50·1 g/d (95 % CI 47·4, 52·9, equivalent to 350 g/week)(Reference Galbete, Nicolaou and Meeks49). Another study observed almost twice as much milk consumed at 644 g/week per person (±581 g)(Reference Barichella, Akpalu and Cham46), similar to that reported in Kenya. The frequency of consumption in Ghana ranged from zero servings of milk per week(Reference Frank, Kröger and Schulze48) to 0·7 serving of milk/dairy products per week(Reference Okutu29); the same study reported milk/dairy products as least frequently consumed food group(Reference Okutu29).
Red meat
Two studies reported on beef consumption in Kenya(Reference Cornelsen, Alarcon and Häsler41,Reference Wathome65) , and two studies reported on red meat consumption in Ghana(Reference Frank, Kröger and Schulze48,Reference Galbete, Nicolaou and Meeks49) . In Kenya, the average frequency of beef consumption per week per household was five times per week (sd not provided)(Reference Wathome65), and intake was, on average, 66·4 g/week (±125·0) per individual(Reference Cornelsen, Alarcon and Häsler41). Conversely, in Ghana, the frequency of servings of red meat was lower, 1·5 servings per week (IQR 0·5, 3·5)(Reference Frank, Kröger and Schulze48), but reported intake was higher than in Kenya at 45 g/d (±2·2 g)(Reference Galbete, Nicolaou and Meeks49).
Fruit and vegetables
Fruit and vegetable intakes in Ghana were reported by five studies(Reference Okutu29,Reference Frank, Kröger and Schulze48,Reference Galbete, Nicolaou and Meeks49,Reference Wu, Guo and Chatterji53,Reference Sowah56) that were not included in the meta-analyses. One study reported a small proportion of individuals eating five portions of fruit per day (1·3 %) and five portions of vegetables per day (1·1 %)(Reference Sowah56). Another study estimated that over two-thirds (67·1 %, 95 % CI 63·1, 70·9) of the sample did not consume the recommended five servings of fruit and vegetables on average per day(Reference Wu, Guo and Chatterji53). A third study reported 3·5 servings of fruit per week but did not specify serving size(Reference Frank, Kröger and Schulze48). One study found higher intake of vegetables (267·1 ± 4·1 g) than fruits (152·8 ± 7 g)(Reference Galbete, Nicolaou and Meeks49). Likewise, one study found vegetables were consumed more frequently than all other food groups (3·8 times per week; sd not provided)(Reference Okutu29).
Sugar-sweetened beverages
Three studies found that SSBs were consumed more frequently, on average, in Kenya at 2·6 times per week (males 2·66, sd 2·59; females 2·60, sd 2·42)(Reference Okoth61) than in Ghana, where consumption ranged from 1·2(Reference Okutu29) to 1·5 times per week (IQR 0·5–1·5)(Reference Frank, Kröger and Schulze48).
Dietary patterns
Dietary patterns were reported in two studies in urban Ghana(Reference Frank, Kröger and Schulze48,Reference Galbete, Nicolaou and Meeks49) . Galbete et al.(Reference Galbete, Nicolaou and Meeks49) reported that urban Ghanaians had highest median scores on ‘rice, pasta, meat and fish’ patterns compared to rural and European Ghanaians. Diet was characterised by high intakes of dairy, red meat, processed meat, eggs, legumes, rice and pasta, fish, mixed meaty dishes, cakes and sweets and condiments. A second study identified two dietary patterns in urban Ghana(Reference Frank, Kröger and Schulze48): a ‘purchase’ pattern (high intake of sweets, juice, rice, soft drinks, ‘Milo’, eggs, red meat, margarine, cow’s milk, poultry, cucumber, lettuce, carrot and fruits) and a ‘traditional pattern’ (high intake of fruits, plantain, cassava, smoked fish, palm oil, eggplant, green leaves, banku and beans). The purchase pattern was more typical of younger participants of a higher socioeconomic status (SES), whereas the traditional pattern was more typical of older and more deprived participants.
Dietary diversity and food variety
Dietary diversity was reported in eight studies, four in each country. The earliest available information on dietary diversity dated from 2012 (Table 1). Four studies focused on adult women(Reference Amugsi, Lartey and Kimani27,Reference Dominguez-Salas, Alarcón and Häsler40,Reference Kemunto67,Reference Steyn, Parker and Nel74) , one on adult women and adolescent girls(Reference Quarshie38) and one on adolescent girls(Reference Nti, Brown and Danquah54). Data pooling was precluded by different methods of assessment and reporting. The dietary diversity of women based on the nine-point FAO method was marginally higher in Ghana (4·7 ± 1·5)(Reference Amugsi, Lartey and Kimani27) compared to Kenya (4·4 ± 1·1 in Dagoretti, and 4·1 ± 1·4 in Korogocho, both in Nairobi)(Reference Dominguez-Salas, Alarcón and Häsler40). Steyn et al.(Reference Steyn, Parker and Nel74) reported a score of 4·8 (95 % CI 4·6, 4·9) out of nine food groups among women in Kenya using a different assessment tool(Reference Hatloy, Torheim and Oshaug78). In Ghana, household dietary diversity, using the nine-point FAO food groups, was estimated at 6·8 (sd not reported)(Reference Okutu29). Dietary diversity in this sample varied by age, sex, education, occupation of household head, household size and residence of household(Reference Okutu29).
Table 1 Summary of studies reporting dietary diversity and food variety

Other studies reported dietary diversity using different scoring systems. In Kenya, a mean score of 5·2 ± 1·1 was reported based on an eight-point food group system(Reference Thuita, Mwadime and Wang’ombe64), and a score of 7·5 ± 1·4 based on a fourteen-point food group score for Kenyan women(Reference Kemunto67). In Ghana, a mean dietary diversity score of 9·2 ± 2·9 out of a sixteen-point food group score was reported(Reference Quarshie38). In this study, dietary diversity was lower among women (8·31 ± 2·83) than adolescents (10·11 ± 2·76), although the adolescent sample was small (n 13). Also in Ghana, 56 % of adolescents consumed diets with <3 of six food groups(Reference Nti, Brown and Danquah54).
Two studies assessed food variety. In Kenya, the number of foods consumed in the past 24 h from a list of 163 items produced a food variety estimate of 7·8 (95 % CI 7·5, 8·2)(Reference Steyn, Parker and Nel74). In Kenya, more than two-thirds of women in Viwandani and Korogocho consumed diets with >4 food groups(Reference Kimani-Murage, Schofield and Wekesah30).
Dietary practices
Overall thirteen studies reported on dietary practices: eight from Ghana and five from Kenya (Online supplementary material 7). Practices were grouped as meal patterns and snacking, eating outside the home and food provisioning.
Meal patterns and snacking. Seven Ghanaian studies reported on meal patterns(Reference Opare-Obisaw, Fianu and Awadzi37,Reference Ansong45,Reference Barichella, Akpalu and Cham46,Reference Frank, Kröger and Schulze48,Reference Nti, Brown and Danquah54,Reference Ofori-Koranteng55,Reference Opare-Obisaw66) . Of these, five reported structured meals, that is, breakfast, lunch and dinner(Reference Opare-Obisaw, Fianu and Awadzi37,Reference Ansong45,Reference Frank, Kröger and Schulze48,Reference Nti, Brown and Danquah54,Reference Opare-Obisaw66) . In the remaining studies, meal patterns were unclear. One study reported almost all participants ate 2–3 meals per day at weekends (91·5 %) and on weekdays (90·7 %)(Reference Ansong45). In Barichella et al.(Reference Barichella, Akpalu and Cham46), participants consumed on average 2·6 meals per day, but did not specify the types of meals consumed. Data on meal patterns were not available for Kenya.
Three of the seven Ghanaian studies reported on snacking behaviours(Reference Opare-Obisaw, Fianu and Awadzi37,Reference Ansong45,Reference Opare-Obisaw66) . Snacking at least once per day was reported by 83·7 % of respondents(Reference Ansong45); of these, 53·2 % snacked on pastries and beverages with added sugar, 19 % snacked on nuts and roasted corn/plantain, and 11·5 % snacked on fruits. Snacks eaten by university students included fruits, soft drinks, or baked, fried or roasted foods, but provided no further breakdown of food items(Reference Opare-Obisaw66). Among female homemakers in Accra, 28 % of women reported buying snacks from vendors(Reference Opare-Obisaw, Fianu and Awadzi37).
Eating outside the home. Behaviours around eating outside the home were reported in seven studies (Online supplementary material 7): four in Ghana(Reference Opare-Obisaw, Fianu and Awadzi37,Reference Ansong45,Reference Hiamey, Amuquandoh and Boison50,Reference Opare-Obisaw66) , three in Kenya(Reference Kimani-Murage, Schofield and Wekesah30,Reference Van’t Riet, Den Hartog and Mwangi62,Reference Mbochi75) . Only one study, from Ghana, reported on fast-food purchasing(Reference Ansong45), suggesting that 55 % of respondents had purchased or eaten fast food in the last 7 d.
No studies from Kenya reported on fast-food purchasing but referred to local ‘street food’. Street food consumption was reported in three studies, but they were not always explicit about what was consumed (snacks or meals). In two Kenyan studies(Reference Kimani-Murage, Schofield and Wekesah30,Reference Van’t Riet, Den Hartog and Mwangi62) , street foods were consumed by less than a quarter of respondents. In urban slums, 13 % of households purchased street-cooked foods(Reference Kimani-Murage, Schofield and Wekesah30), while a non-slum survey reported 22 % of household members consuming street foods daily(Reference Van’t Riet, Den Hartog and Mwangi62). In Ghana, the frequency of eating street foods ranged from one to twenty-one times in a week(Reference Hiamey, Amuquandoh and Boison50), with men eating street foods more often than women (Online supplementary material 7). Among university students in Ghana, 86 % purchased meals from street vendors; and of these, 47 % did so on a daily basis(Reference Opare-Obisaw66).
For meals purchased and/or eaten outside the home, 65 % of respondents in Kenya ate at least once per day outside the home(Reference Mbochi75), while women in the two lower SES groups ate significantly fewer meals away from home compared to the two upper SES groups(Reference Mbochi75). Among female homemakers, 20 % always purchased breakfast from vendors, 34 % purchased lunch and 20 % purchased supper from vendors(Reference Opare-Obisaw, Fianu and Awadzi37).
Food provisioning. Three studies focused on food provisioning practices(Reference Kimani-Murage, Schofield and Wekesah30,Reference Mukasa-Mwanthi68,Reference Mboganie-Mwangi and Foeken73) . In urban slums of Nairobi, 87 % of households purchased raw food from the market(Reference Kimani-Murage, Schofield and Wekesah30). A study of low SES households in Nairobi reported that urban farmers purchased 67 % of their food from the market and produced 25 % of their own food, compared to non-farmers who purchased 82 % of all household foods(Reference Mboganie-Mwangi and Foeken73).
Discussion
We synthesised evidence of urban dietary behaviours (macronutrients, types of foods, dietary diversity and dietary practices) in two African countries in relation to postulated changes in the context of nutrition transition. This comprehensive search of published studies and grey literature over a period of nearly 50 years reveals how little is known on urban dietary behaviours prior to 2010. No studies reported macronutrient intakes from the 1970s or 1980s. Five studies were available in the 1990s, and the remaining studies were published after 2000. Dietary diversity data were available after 2012. Studies were cross-sectional and included varying population samples with high heterogeneity; hence a meta-analyses of changes in dietary behaviours over time was not conducted. From the forty-seven included studies, there was some evidence of diverse diets, with relatively widespread consumption of unhealthy foods, suggesting that diets may be undergoing nutrition transition at the population level. However, the findings were mixed. This study, therefore, adds evidence of the difficulty of measuring nutrition transition in emerging economies as recently highlighted(Reference Walls, Johnston and Mazalale79). In contrast to the strong evidence of increasing overweight/obesity and NR-NCDs in Ghana and Kenya, the less conclusive evidence of nutrition transition may be partly due to a lack of good-quality, longitudinal, national-level surveys utilising validated tools and well-developed food composition tables in urbanising middle-income countries(Reference Walls, Johnston and Mazalale79). The collation of data from existing longitudinal dietary surveys in LMICs could provide a valuable resource for comparing the timing and rate of nutrition transition of individual countries to a ‘reference’ source.
Meta-analyses of energy and macronutrient intakes showed that mean intakes were within the normal range of WHO-recommended nutrient intake goals for preventing NR-NCDs(80). Protein contributed 13·7 % of energy (recommended range 10–15 %) and carbohydrate contributed 62·9 % of energy in Ghana and 59·6 % in Kenya (recommended range 55–75 %). Fat intake comprised 25·8 % of energy in Kenya and 24·7 % in Ghana, also within the recommended range (15–30 %). Diets were relatively diverse, with mean dietary diversity scores within the mid-range of values, using standardised measurement tools. The consumption of animal-source foods (including dairy, red meat, processed meat, eggs and fish) was widespread in both countries.
Indicators of nutrition transition were apparent in the consumption of unhealthy foods and drinks, particularly SSBs, consumed by around 40 % of the sample. The proportion of population consuming fruit and vegetables was low, consumed by only half of the included population. Dietary patterns in Ghana showed that traditional and modern patterns co-existed, characterised by widespread intakes of processed meat, cakes, sweets, soft drinks and juices.
In countries undergoing nutrition transition, it is assumed that dietary practices of urban dwellers shift towards greater consumption of sugary snacks, processed food and food eaten away from home(Reference Hawkes, Harris and Gillespie5). There is insufficient evidence from this review to draw conclusions on whether people eat a lot of fast foods, street foods or are eating out more often. Few included studies on eating out of home, and only one study reported specifically on fast-food purchasing(Reference Ansong45). Evidence suggests that men(Reference Hiamey, Amuquandoh and Boison50) and those from higher SES groups(Reference Mbochi75) may be more likely to consume food out of home. There was some conflation in the evidence between fast food (as in ‘international’ fast food) and locally produced street food. In the African context, the latter can also involve selling similar types of foods (from a nutritional and/or culinary perspective) as those sold in international fast-food chains. The diversity of food landscape in African cities makes the categorisation of different food outlets a challenge.
Evidence suggests that meal patterns remain structured around the conventional pattern of three meals a day(Reference Opare-Obisaw, Fianu and Awadzi37,Reference Ansong45,Reference Frank, Kröger and Schulze48,Reference Nti, Brown and Danquah54,Reference Opare-Obisaw66) , with foods more likely to be eaten or purchased out of home at breakfast and lunch. There was insufficient evidence to conclude about the extent of snacking and consequences of snacking on eating frequency and impact on the nutritional quality of diets.
Longitudinal evidence of changes in dietary behaviours in the African region is available from the PURE cohort in South Africa. From 2005 to 2010, rapid increases in sugars and SSB consumption have been reported in urban and rural areas, which is associated with increased NCD risk factors(Reference Vorster, Kruger and Wentzel-Viljoen81). The same study, however, observed the beneficial consequences of nutrition transition, with increased vegetables, fruit and milk consumption in most groups(Reference Wentzel-Viljoen, Lee and Laubscher82). This finding underlines the dual transition processes of reduced undernutrition that accompanies greater food availability and economic development, alongside a rapid increase in unhealthy foods and NR-NCDs. Furthermore, nutrition transition can be experienced differently within a population; fruit and vegetable consumption in urban areas may increase among high SES groups but decrease among low SES groups(Reference Hawkes, Harris and Gillespie5). More sensitive indicators of nutrition transition, such as added sugar or saturated fat consumption, were seldom reported in studies in this review, possibly due to a lack of food composition data on these nutrients; hence these could not be assessed. Similarly, the data precluded any breakdown by type of carbohydrate.
Strengths and limitations
The strengths of this review are the inclusion of studies from both grey and published literature, the synthesis of evidence from two middle-income African countries, and the meta-analyses of energy, macronutrient intakes and food items consumed. We also synthesised dietary behaviours in relation to the key indicators of nutrition transition.
Limitations of the review arise from the limited extent of evidence from early periods of urbanisation, with only nine studies dating from 1971 to 2000, and from the high heterogeneity of evidence. This precluded an assessment of changes in dietary behaviours over time. The impact of urbanisation on diet in Africa is thought to have emerged from the mid-1980s onwards(Reference Steyn and Mchiza6), but dietary data from this time are lacking. The reviewed studies focussed on general dietary intakes rather than nutrition transition per se and, therefore, did not necessarily report on the key indicators of transition such as added sugar or saturated fat. One-quarter of included studies were assessed as having a high risk of bias. This was usually due to the absence of detailed methods of dietary assessment and heterogeneity of methods employed in assessment tools and units of measurement. Dietary studies are liable to a range of misreporting biases, and not all data collection methods were standardised or validated; these sources of bias can affect estimates. However, these factors are incorporated into the risk of bias in the quality assessment procedure and the reliability of estimates from meta-analyses, as indicated by high I 2 values. Furthermore, the focus of this review was not on absolute individual dietary intakes but on population-level dietary behaviours and relative intakes. A further limitation is that only narrative syntheses were possible for dietary patterns, dietary diversity and dietary practices. Even within the same dietary practice, different outcome measures were reported, for example, frequency v. types of snacks consumed. The use of STROBE-nut reporting guidelines would improve consistency across studies(Reference Lachat, Hawwash and Ocké83).
Conclusion
This systematic review on the availability, nature and quality of data from two middle-income African countries highlights the paucity of data on dietary behaviours between 1971 and 2000 when rapid urbanisation and early stages of nutrition transition began. Evidence from more recent studies, however, provides an indication of nutrition transition in urban dietary behaviours in these two middle-income African countries. Diets were relatively diverse compared with standardised measures, including a variety of animal-source foods consumed by a high proportion of the population. Meal patterns remained structured around the conventional pattern of three meals per day. There was insufficient evidence to conclude whether patterns of eating out or snacking are shifting. Based on the WHO recommendations on healthy diets containing <10 % of total energy intake from free sugars, unhealthy food and drink consumption was relatively widespread, particularly SSBs that were consumed by 39·9 % of the population. Similarly, based on the WHO recommendation for a healthy diet containing a minimum daily consumption of 400 g or five portions per day of fruit and vegetables (i.e., 100 % of the population consuming fruit and vegetables every day), the proportion of population consuming fruit and vegetables was 51·6 %, which is substantially below recommended intakes. Energy and macronutrient intakes were within the normal range of WHO recommendation. The assessment of dietary changes was hindered by limited evidence from early decades and high heterogeneity between studies. There has been a call for greater information on urban diets, disaggregated by SES(Reference Hawkes, Harris and Gillespie5), and the drivers of unhealthy diets(Reference Hawkes, Harris and Gillespie5). In the global context, the inadequacy of standard dietary assessment instruments and comprehensive food composition tables to assess diets undergoing transition has been highlighted(Reference Walls, Johnston and Mazalale79). In view of a rapid urbanisation underway in many African countries, and the varying stages of economic development of different countries, significant changes in dietary behaviours will be taking place in future. Longitudinal, nationally representative dietary surveys, designed to track changes in dietary behaviours in relation to non-communicable disease risk in urbanising African countries such as Ghana and Kenya, would enable an assessment of the contribution of dietary behaviours to the risk of overweight and obesity and non-communicable diseases. Based on evidence from these two countries, we highlight areas where dietary behaviours may be contributing to increasing overweight and obesity, namely a low proportion of population consuming fruit and vegetables and a widespread consumption of SSBs.
Acknowledgements
Acknowledgements: We gratefully acknowledge Fiona Graham for assistance with formatting documents, and Jedidah Tetteh for assistance with screening and data extraction. Financial support: Medical Research Council, UK (MR/P025153/1). Conflict of interest: None. Authorship: E.K.R., R.P., A.B., R.Ar., R.Ak., S.K.M. and M.H. designed the research; M.H., R.P., E.K.R., A.B., R.Ar., R.Ak., S.K.M., H.O.-K., K.B., C.M. and T.N. extracted and analysed data; E.K.R., R.P., A.B., R.Ar., R.Ak., H.O.-K., C.M., T.N. and M.H. wrote the paper; E.K.R. had primary responsibility for the final content. All authors read and approved the final manuscript. Ethics of human subject participation: This systematic review and synthesis was based on published works and was, therefore, exempt from ethical approval.
Supplementary material
For supplementary material accompanying this paper visit https://doi.org/10.1017/S1368980019004014.


