


Inflammation due to a response to repeated ‘injury’ is involved in the steps of atherosclerosis that lead to plaque rupture and thrombosis( Reference Pearson, Mensah and Alexander 1 ). Evidence also is accumulating on the role of chronic inflammation in cancer( Reference Keibel, Singh and Sharma 2 ), with colon cancer being the most well described( Reference Terzic, Grivennikov and Karin 3 ), as well as in diabetes, asthma, depression, metabolic syndrome and other diseases( Reference Galassetti 4 – Reference Killeen and Skora 6 ). A large body of evidence indicates that diet plays a central role in the regulation of chronic inflammation( Reference Cui, Jin and Singh 7 – Reference Giugliano, Ceriello and Esposito 9 ). The goal in creating the original dietary inflammatory index (DII) in 2009 was to provide a tool that could categorize individuals’ diets on a continuum from maximally anti-inflammatory to maximally pro-inflammatory( Reference Cavicchia, Steck and Hurley 8 ). The original DII was created and validated in the longitudinal data of the SEASONS study with C-reactive protein (CRP). Results showed that the DII, fit as a categorical variable, was able to significantly predict interval changes in CRP( Reference Cavicchia, Steck and Hurley 8 ). Understanding that the literature continues to evolve, and motivated by a perceived need to improve the scoring algorithm developed earlier, the overall goal of the Dietary Inflammatory Index Development and Testing Study was to update the review and abstraction of peer-reviewed journal articles published from 2007 to 2010, and to refine the scoring algorithm to relate individuals’ intakes and the overall inflammatory potential of their diets to a reasonable set of global norms. No attempt to do this was made previously.
Materials and methods
Overview
The original DII was the first attempt to quantify the overall effect of diet on inflammatory potential( Reference Cavicchia, Steck and Hurley 8 ). At that time 2700 articles published through 2007 were screened, and 929 were read and scored in formulating the index( Reference Ockene, Chiriboga and Stanek 10 ). In the original DII, literature review-based scores were multiplied by individuals’ actual intakes of food parameters, with no attempt to relate to any external standard of intake. While on the face appearing to be assumption-free, this approach is sensitive to the units of measurement. For example, μg and mg differ by three orders of magnitude and some parameters, such as vitamin A and β-carotene, had to be divided by 100 and others, such as n-3 and n-6 fatty acids, multiplied by 10 in order to place them in a ‘reasonable’ range so as not to over- or underestimate their influence on the overall score.
The new DII is improved in a number of ways. First, an improved scoring system has been applied to the forty-five ‘food parameters’, consisting of whole foods, nutrients and other bioactive compounds derived from a much larger literature review. Second, eleven food consumption data sets from around the world were identified that represent a range of human dietary intakes that serve as the ‘referent’ population database to provide comparative consumption data for these forty-five food parameters( 11 – Reference Shim and Paik 23 ). Third, a percentile scoring system was devised that serves as the actual values against which individuals’ intakes are multiplied in order to derive each individual's DII score.
Literature review strategy
PubMed® and Ovid® were used to search the National Library of Medicine database from 1950 to 2007 for all peer-reviewed articles published in English that met the criteria of assessing the role of whole foods and dietary constituents on these specific inflammatory markers: IL-1β, IL-4, IL-6, IL-10, TNF-α and CRP( Reference Cavicchia, Steck and Hurley 8 ). After confirming that both search engines produced the same results, a PubMed search was conducted for all peer-reviewed articles published in English from January 2008 to December 2010 to update the inflammatory effect scores (which includes the weight assigned to the quality of study design and number of articles on each food/constituent–inflammatory marker relationship). In the review of these more recent articles the list of constituents was expanded by fifteen. The previous (i.e. published in or before 2007) set was then re-reviewed to ensure that the full parameter list applied to the entire data set.
Based on their established importance in inflammation and, concomitantly, the robustness of the literature concerning them, these inflammatory markers were chosen to be the focus of the search: IL-1β, IL-4, IL-6, IL-10, TNF-α and CRP. Multiple variations of each term were used in order to decrease the probability of missing relevant articles. Similarly, variations in the names of food parameters were used to ensure that no appropriate article was missed (i.e. to achieve the goal of full and complete representation). Next, inflammatory terms were combined using the ‘or’ Boolean Logic option.
Each food parameter was individually combined with the list of inflammatory terms using the ‘and’ option. Based on the abstracts, articles were discarded if they: (i) did not examine one or more food parameter–inflammatory marker relationship; (ii) used the inflammatory marker to stimulate other processes; (iii) used a combination of food parameters as the exposure; (iv) employed intravenous administration of the food parameter; (v) were published after the year 2010; (vi) were reviews (because primary study results were required – although bibliographies were read to ensure that all primary research articles cited in reviews were captured); (vii) examined extreme, non-physiological exposures (such as chronic alcohol exposure, alcohol abuse or ethanol vapour); or (viii) used an analogue of the food parameter. A total of 1943 articles were reviewed and scored.
Scoring algorithm
One of three possible values was assigned to each article based on the effect of the food parameter on inflammation: ‘+1’ was assigned if the effects were pro-inflammatory (significantly increased IL-1β, IL-6, TNF-α or CRP, or decreased IL-4 or IL-10); ‘−1’ if the effects were anti-inflammatory (significantly decreased IL-1β, IL-6, TNF or CRP, or increased IL-4 or IL-10); and ‘0’ if the food parameter did not produce any significant change in the inflammatory marker. In some instances, in a single study, food parameters have been shown to have differential effects; i.e. a food parameter could both decrease and increase inflammatory potential by increasing both pro- and anti-inflammatory markers or by increasing one pro- (or anti-)inflammatory marker while decreasing another. Previously, to deal with these contradictory results the mean effect was computed. Now they are scored separately, giving ‘−1’ to the article for an anti-inflammatory effect and ‘+1’ for a pro-inflammatory effect reported in the same article. Full details of the scoring algorithm are available on request.
Calculation of food parameter-specific raw inflammatory effect scores and food parameter-specific overall inflammatory effect scores
Articles were first weighted by study characteristics (see Table 1). Using these weighted values, the pro- and anti-inflammatory fractions for each food parameter were calculated (see step 3 in Fig. 1). The ‘food parameter-specific overall inflammatory effect score’ was then calculated by: (i) dividing the weighted pro- and anti-inflammatory articles by the total weighted number of articles and (ii) subtracting the anti-inflammatory fraction from the pro-inflammatory fraction (see Fig. 2 for an example of how the score was calculated for saturated fat). A cut-off point of 236, the median of the total weighted number of articles across all of the food parameters, was chosen to indicate an optimally robust pool of literature. All food parameters with a weighted number of articles ≥236 were assigned the full value of the score. Foods and constituents with a weighted number of articles <236 were adjusted as follows: (i) the number of weighted articles was divided by 236; (ii) the fraction was then multiplied by the food parameter-specific raw inflammatory effect score, which resulted in the food parameter-specific overall inflammatory effect score (i.e. for saturated fat: 205/236 = 0·87; 0·87 × 0·429 = 0·373).
Table 1 Study design weights; Dietary Inflammatory Index Development Study, Columbia, SC, USA, 2011–2012

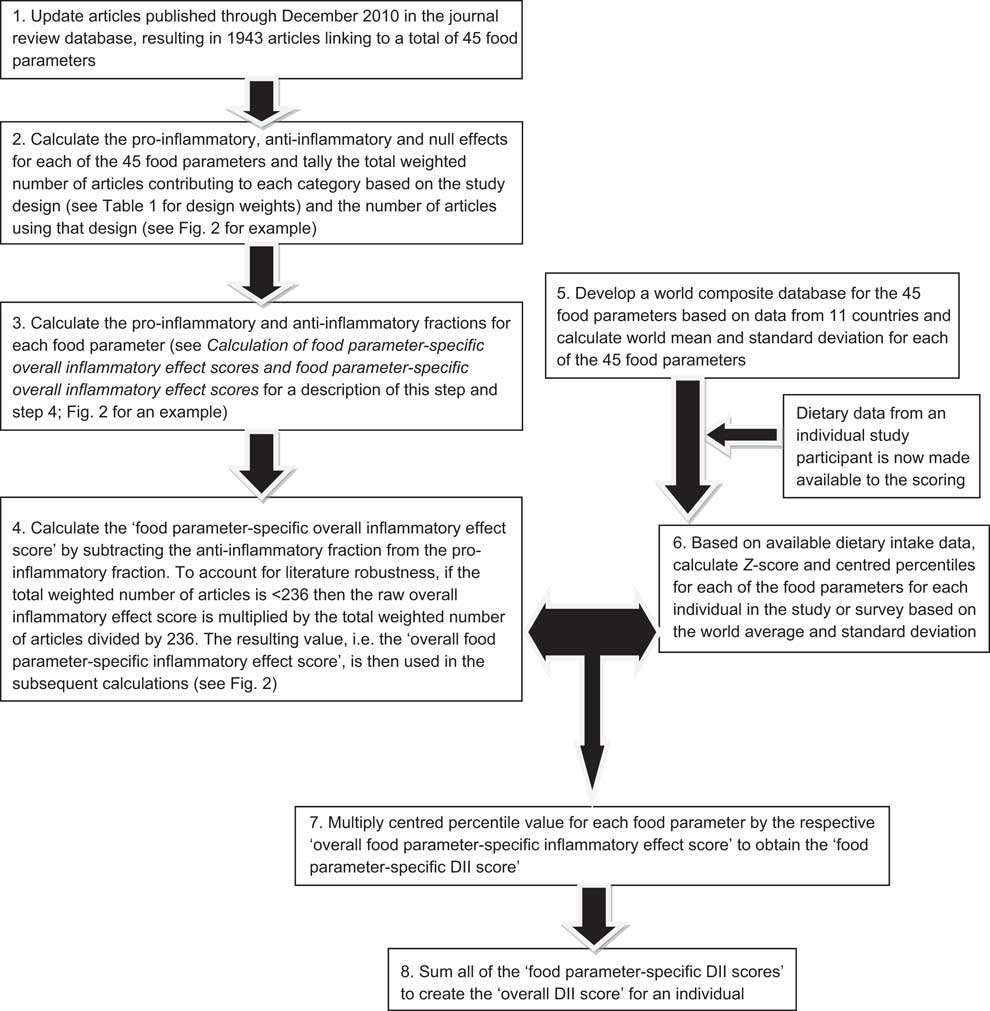
Fig. 1 Sequence of steps in creating the dietary inflammatory index (DII)

Fig. 2 Example of method used for weighting results of research articles; Dietary Inflammatory Index Development and Testing Study, Columbia, SC, USA, 2011–2012. Saturated fat had a total of thirty-five articles, which resulted in 205 weighted. In step 1, articles were multiplied by assigned weights (see Table 1 and Fig. 2). The total anti-inflammatory and pro-inflammatory weight was divided by the total weight for saturated fat. In step 2, the anti-inflammatory fraction was subtracted from the pro-inflammatory fraction
Developing a composite database representing a diversity of diet
To avoid the arbitrariness resulting from simply using raw consumption amounts (with arithmetic manipulations needed to regulate influence), as had been done previously, the current DII was standardized to a representative range of dietary intake based on actual human consumption. This was accomplished by constructing a composite database representing a wide range of diets across diverse populations living in a variety of countries in different regions of the world. Authors of articles reporting on data from nutrition surveys were contacted to request access to complete data sets. A total of eleven such data sets were identified. If data for some food parameters were missing, then the means were either calculated from other data sets or taken from articles that published mean values for these missing parameters. For example, to obtain the data on turmeric, eugenol, rosemary and thyme/oregano consumption for the USA we used the Energy Balance Study data set( 24 ), flavonoid data for Denmark were taken from an article published by Dragsted et al.( Reference Dragsted, Strube and Leth 25 ). All of these data sets had information on all the major macro- and micronutrients, so it was mainly in cases of flavonoids and whole food items that data were taken from other sources (in any event <9 % of all data). In rare instances (i.e. for thyme, saffron, isoflavones, eugenol) where we failed to identify a mean consumption value for a particular food parameter for specific countries, it was left blank for those countries and the overall mean and standard deviation were calculated from the data sets that had information on that food parameter. Some sources, e.g. for New Zealand, provided means separately for males and females; in such cases the two values were averaged.
Dietary information was available for the following countries (and sources): (i) USA – the National Health and Nutrition Examination Survey (NHANES) data set 2007–2008( 11 ) was used to calculate the means for most of the food parameters. For food parameters such as turmeric, thyme, oregano, rosemary and cloves whose data were not available in NHANES, locally available data sets (e.g. the ongoing Energy Balance Study( 24 )) were used to provide data on these parameters. (ii) Australia – mean values were taken from the National Nutrition Survey report of 1999( Reference McLennan and Podger 19 ). (iii) Bahrain – mean values were taken from ‘National Nutrition Survey for Adult Bahrainis aged 19 years and above’ published in 2002( Reference Abdul Wahab, Gharib and Al-Sairafi 12 ). (iv) Denmark – means were taken from an article published by Knudsen et al.( Reference Knudsen, Gille and Nielsen 18 ) in 2011, which used the data from the Danish National Survey of Diet and Physical Activity, and the flavonoid data from an article published by Dragsted et al.( Reference Dragsted, Strube and Leth 25 ). (v) India – means were calculated from the Indian Health Study data set( Reference Ferrucci, Daniel and Kapur 15 ) and from the Mumbai Cohort Study data set (unpublished results from ongoing analyses of Feasibility Study data). (vi) Japan – means were taken from the National Nutrition Survey Report, 2002( Reference Nakamura, Tajima and Yoshiike 20 ); the parameters were in Japanese language, hence help was obtained from a Japanese student to translate it into English. (vii) New Zealand – means were taken from the National Nutrition Survey Report of 1997( 16 , Reference Parnell, Wilson and Russell 22 ). (viii) Taiwan – means were taken from an article published by Pan et al.( Reference Pan, Chang and Chen 21 ), entitled ‘Nutrition and Health Survey in Taiwan (NAHSIT) 1993–1996: dietary nutrient intakes assessed by 24-hour recall’. (ix) South Korea – mean values were taken from an article published by Shim and Paik entitled ‘Reanalysis of 2007 Korean National Health and Nutrition Examination Survey (2007 KNHANES) results by CAN-Pro 3·0 nutrient database’( Reference Shim and Paik 23 ) and for some of the food parameters that were missing in the above article, mean values were provided by Dr Sung Kyun Park at the University of Michigan, who has worked extensively with KNHANES data sets. (x) Mexico – means were taken from an article published by Barquera et al.( Reference Barquera, Hernandez-Barrera and Campos-Nonato 13 ), which used the Mexican National Health and Nutrition Survey (2006) data. (xi) UK – means were taken from the 2004 summary report entitled ‘The National Diet and Nutrition Survey: adults aged 19 to 64 years’( Reference Henderson, Bates and Swan 17 ). For thyme, oregano and rosemary, mean consumption was calculated from the Energy Balance Study database( 24 ) (unpublished results available on request) and the standard deviation was calculated from the same data set based on the consumption among the participants in that study. For eugenol, there were no data on its consumption; hence, its consumption was calculated based on the mean consumption of cloves, i.e. the food source that accounts for 95 % of all eugenol consumed. For tea and coffee, for which limited survey data were available, daily intake was calculated from the per capita intake in these eleven countries( 26 , 27 ).
Because no country had complete data on all twenty-one flavonoids, they were grouped into six main categories based on their biological mechanisms of action. For example, articles on luteolin and apigenin are grouped under the main group as flavones. This reduced the total number of food parameters to forty-five. Flavonoid data for the USA were taken from an article published by Chun et al. in 2007( Reference Chun, Chung and Song 14 ) who used the US Department of Agriculture Flavonoid Database and NHANES 1999–2002 as a referent. For food parameters where data were available only from a single country (e.g. thyme), the standard deviation for that country was used.
Calculation of the dietary inflammatory index
Calculation of the DII is based on dietary intake data that are then linked to the regionally representative world database that provided a robust estimate of a mean and standard deviation for each parameter (see steps 5 and 6 in Fig. 1). These then become the multipliers to express an individual's exposure relative to the ‘standard global mean’ as a Z-score. This is achieved by subtracting the ‘standard mean’ from the amount reported and dividing this value by its standard deviation (means and standard deviations for all of the forty-five parameters are shown in Table 2). To minimize the effect of ‘right skewing’, this value is converted to a percentile score. To achieve a symmetrical distribution with values centred on 0 (null) and bounded between −1 (maximally anti-inflammatory) and +1 (maximally pro-inflammatory), each percentile score is doubled and then ‘1’ is subtracted.
Table 2 Food parameters included in the dietary inflammatory index, inflammatory effect scores, and intake values from the global composite data set; Dietary Inflammatory Index Development Study, Columbia, SC, USA, 2011–2012
RE, retinol equivalents.
*This is referred to as the ‘food parameter-specific raw inflammatory effect score’ in the text and is abbreviated here for ease of presentation. Note that the effect is per unit amount noted for each food parameter.
†This refers to the ‘food parameter-specific overall inflammatory effect score’ accounting for the robustness of the literature, which is considered optimal at the median of 236 articles, and is computed as described in the text and illustrated for saturated fat in Fig. 2.
‡From the world composite database, as described in the text.
The centred percentile value for each food parameter is then multiplied by its respective ‘overall food parameter-specific inflammatory effect score’ to obtain the ‘food parameter-specific DII score’ (step 7 in Fig. 1). Finally, all of the ‘food parameter-specific DII scores’ are summed to create the ‘overall DII score’ for an individual (step 8 in Fig. 1). This approach both ‘anchors’ the individual's exposure to a robust range of dietary patterns in a variety of cultural traditions and obviates completely the problem of non-comparability of units because the Z-scores and percentiles are independent of the units of measurement (i.e. the percentile is the same whether the parameter is expressed in μg or mg).
Comparisons of dietary inflammatory index values across the global database
The DII is designed to be used with dietary data collected from different assessment methods. The ‘deluxe’ method would be an open-ended one providing data on all forty-five dietary parameters – e.g. either 24 h dietary recall interviews or food records. As an example of DII scores obtained across a range of plausible intakes of the forty-five food parameters contributing to the DII, we provide seven scenarios for comparative purposes. These range from the maximum, to the 90th percentile, 75th percentile, median, 25th percentile, 10th percentile and minimum values across the forty-five food parameters that comprise the DII according to their inflammatory potential. For example, to calculate the maximum pro-inflammatory DII we summed the maximum pro-inflammatory score for all food parameters.
As the simulated values of forty-five food parameters in relation to the seven intake scenarios are for illustrative/descriptive purposes only, no formal statistical analyses of the results are conducted.
Results
Table 2 lists the forty-five food parameters, the food parameter-specific raw inflammatory effect scores (based upon the literature review), the food parameter-specific overall inflammatory effect scores based upon the weighting algorithm to take into account the robustness of the evidence, and the global mean consumption values and corresponding standard deviations across the eleven international data sets. For most of the parameters listed the standard deviation falls between 1/4 and 1/2 of the mean. The standard deviation tends to be larger for parameters that are eaten in smaller quantities; with the corollary that the standard deviation of macronutrient intake tends to be smaller relative to mean consumption. This provides strong prima-facie evidence for the need to ‘normalize’ the scoring system in order to reduce skewness. In Table 3, DII values for the seven scenarios ranging from maximally to minimally pro-inflammatory are presented. The scores range from 7·98 (i.e. strongly pro-inflammatory) to −8·87 (i.e. strongly anti-inflammatory).
Table 3 Representative values* of the simulated world dietary inflammatory index (DII); Dietary Inflammatory Index Development Study, Columbia, SC, USA, 2011–2012

*Values representing a range of plausible intakes of the forty-five food parameters contributing to the DII are provided illustrative/comparative purposes.
†Based on the maximal pro-inflammatory DII value for each of the forty-five food parameters.
‡Based on the 90th percentile DII value for each of the forty-five food parameters.
§Based on the 75th percentile DII value for each of the forty-five food parameters.
∥Based on the median DII value for each of the forty-five food parameters.
¶Based on the 25th percentile DII value for each of the forty-five food parameters.
**Based on the 10th percentile DII value for each of the forty-five food parameters.
††Based on the minimal pro-inflammatory (maximum anti-inflammatory) DII value for each of the forty-five food parameters.
Discussion
This population-based DII represents a refined scoring algorithm based on extensive review of the literature from 1950 to 2010, inclusive, and construction of a global referent database. This is the first such index to focus primarily on the inflammatory properties of the diet and links to a global composite food intake database.
Changes made in the scoring algorithm overcome weaknesses identified in the first-generation DII. The extensive literature review on which the scoring is based further increases content validity over what had been published previously( Reference Cavicchia, Steck and Hurley 8 ). Also, the new scoring algorithm avoids the arbitrariness resulting from using raw intake units to develop the DII by first standardizing the intake of food parameters to their corresponding world distributions and then calculating the centred percentiles. This method also dampens the effect of extreme values that otherwise could result in skewness of the DII scores. The scoring algorithm was designed without regard to any particular health- or inflammation-related end point in order to reduce possible bias.
Although the DII assesses diet as a whole, it was created using articles that examined the effect of specific food parameters on inflammation. People do not consume nutrients or even whole foods in isolation; so, while the DII does account for a large number of food parameters, the literature on which it is based tested the specific effects of dietary parameters one at a time. Examining nutrients in relation to disease outcomes can yield weaker relationships compared with food or dietary patterns( Reference Hu 28 ).
The DII is based upon an extensive literature search incorporating cell culture, animal and epidemiological studies on the effect of diet on inflammation. The DII is not limited to micronutrients and macronutrients, but also incorporates commonly consumed bioactive components including flavonoids, spices and tea. The overall score takes into account the whole diet, not just individual nutrients or foods. DII scoring is not dependent on specific population means or recommendations of intake; it is based on results published in the scientific literature. Both of these characteristics distinguish the DII from other indices that are often simple counts of foods that: (i) do not take into account measurable health outcomes from any objective knowledge base, let alone one representing thousands of published results; and (ii) do not relate to any standardized estimate of human dietary intake.
It is encouraging that there was no major change in any food parameter–inflammatory marker relationship between the original DII and the refined version, which benefited from about doubling of the literature available to be reviewed and scored. Because it is dependent on the published literature, there is the possibility that inclusion of significant findings is more likely than null findings. Despite this, slightly under one-third of all associations contributing to the calculation of the DII were null. Because there is a range of intakes represented and it is very resource-intensive to create national data sets, major changes to the world mean intake estimates for the food parameters are not anticipated.
The DII can be used in any nutritional study that has dietary data; in these data sets food parameter intake for each individual participant is standardized to the world mean and standard deviation for his/her respective food parameters (which are derived from the world composite database). These standardized values are converted to centred percentiles which are then multiplied by the ‘overall food parameter-specific inflammatory effect score’ to obtain the ‘food parameter-specific DII score’. ‘Food parameter-specific DII scores’ are then summed to create the ‘overall DII score’ for an individual.
The DII represents a new tool for assessing the inflammatory potential of the diet that can be applied to any population in which dietary data have been collected. The example shown (Table 3) presents results based on the complete list of the forty-five food parameters. Although, in practice, a complete list would be available only from 24 h dietary recall interview-derived or food record data, the DII can be used with dietary data from any source. It also has the potential to be used for evaluating and guiding individuals in setting dietary goals to help decrease levels of inflammation and possibly reduce the risk of certain chronic conditions. Future work should consider how using data from structured assessment instruments (e.g. FFQ and screeners) affects DII estimates and test its utility for predicting chronic disease-related end points in large epidemiological studies.
Acknowledgements
Sources of funding: This work was supported by the South Carolina Statewide Cancer Prevention and Control Program Research Fund. J.R. Hébert was supported by an Established Investigator Award in Cancer Prevention and Control from the Cancer Training Branch of the National Cancer Institute (K05 CA136975). The National Cancer Institute had no role in the design, analysis or writing of this article. Conflicts of interest: All co-authors, N.S., S.E.S., T.G.H., J.R. Hussey and J.R. Hébert, declare no conflicts of interest. Ethics: Ethical approval was not required. Authors’ contributions: N.S. was involved in the design of the DII, analysed data and collaborated with J.R. Hébert in writing the original draft of the paper. S.E.S. was involved in design of the DII and provided critical input in revising drafts of the paper. T.G.H. was involved in the design of the DII, provided statistical and data management expertise and helped in writing the paper. J.R. Hussey was involved in analysing the data, provided high-level statistical expertise and had input in writing the paper. J.R. Hébert devised the initial dietary inflammatory index concept, guided the design of all phases of developing the DII, supervised the analysis of the data and took the lead in writing the paper. Acknowledgements: The authors wish to thank Dr Philip Cavicchia, who had worked on the earlier paper, for providing guidance and support; Dr Sung Kyun Park, who helped with the KNHANES data; and Jaymie Shanahan, who helped with setting up and modifying the article review database.


