


Child and adolescent obesity may track into adulthood, giving rise to many health issues(Reference Grossman, Bibbins-Domingo and Curry1). Great international efforts are underway to control child and adolescent obesity in response to its rapid growth. To accurately define obesity, it is essential to measure excess adiposity(Reference De Lorenzo, Romano and Di Renzo2). Due to the high cost of measuring excess body fat (BF) in clinical settings, the BMI has become a substitute to screen for child and adolescent obesity worldwide. However, it is debatable that BMI is a reliable measure of excessive BF and hence its usefulness of being a tool for obesity screening. Prior studies have used different BMI cut-offs for obesity screening among Chinese children and adolescents, including those recommended by the International Obesity Task Force (IOTF)(Reference Cole and Lobstein3), the WHO(Reference de Onis4) and the Working Group on Obesity in China (WGOC)(5). Given the dynamics of BMI in children from birth to adolescence, age- and sex-specific BMI cut-offs are used to identify children’s weight status.
In 2004, WGOC proposed a definition for childhood obesity based on representative data from the 2000 Chinese National Survey on Students Constitution and Health, and cut-offs were constructed based on the 85th and 95th percentiles of the BMI-for-age growth curve suggested by WHO rather than based on the adverse health outcomes(5). Over the past decades, China’s urbanisation and rapid economic growth have led to the increasing prevalence of child and adolescent obesity, especially in cities. WGOC cut-offs might not be applicable for school-aged children nowadays(Reference Hu, Huang and You6,Reference Liu, Hao and Zhao7) . Previous studies also used other BMI references such as the WHO cut-offs, while the IOTF cut-offs for Asians have long been infrequently used. To the best of our knowledge, no studies have compared the WGOC cut-offs with either the WHO cut-offs or IOTF cut-offs or the three references concurrently.
This study compared the capacity of the three sets of BMI cut-offs suggested by the WHO, IOTF and WGOC to screen for high adiposity, to determine which is most suitable for screening child and adolescent obesity in urban China.
Methods
Participants
A total of 12 426 school students (6750 males and 5676 females) were enrolled in the study, aged 7–17 years from the Longbai community of Minhang District, Shanghai, China. They were selected from one of the thirteen communities in Minhang District by cluster random sampling. Data were collected from 1 November to 31 December in 2017 and were analysed between 15 January and 7 March in 2018. Children and adolescents were eligible for inclusion if they had no disease associated with pathological obesity, or any cardiac, hepatic, kidney, liver or acute/chronic disease. In general, girls begin puberty around 10–11 years and end puberty around 15–17 years, compared with boys at 11–12 and 16–17 years, respectively(Reference Kail and Cavanaugh8,Reference Phillips9) . Therefore, subjects were divided into three age groups (7–10, 11–14 and 15–17 years) which roughly corresponded to pre-pubertal, pubertal and post-pubertal or late-pubertal period.
Body composition assessment
The anthropometric measurements in the study were performed by well-trained nurses or physicians at the Longbai Community Healthcare Center. Before the measures, participants were asked to fast, void and refrain from bathing and vigorous activities for at least 2 h. BF% was estimated by a bioelectrical impedance analysis (BIA) analyser (TANITA BC-420 SMA), which determined total body water by bioelectrical measurement with a high-frequency current (50 Hz, 90 μA); then, each value of BF%, fat mass, fat-free mass, muscle mass and bone mass was calculated by the built-in equations. However, the equations are not provided in official manuals or any literature as they are company confidential (information provided by TANITA Corporation)(Reference Kalra, Mercuri and Anand10,Reference Luque, Escribano and Zaragoza-Jordana11) . The participant was told to stand on the electrodes with both bare feet parallel without bending knees, so that electric current is supplied from the electrodes on the tips of the toes of both feet, and voltage is measured on the heel of both feet. The TANITA BC-420 SMA was designed for children whose feet were too small for the standard devices used for adults(Reference Bammann, Huybrechts and Vicente-Rodriguez12). The BIA methodology and Tanita’s accuracy have been supported by research in the previous study and were validated in assessing body composition in children(Reference Kabiri, Hernandez and Mitchell13–Reference Houtkooper, Lohman and Going15). Compared with other BF% measurements, BIA is the most suitable method or interchangeable with the dual-energy X-ray absorptiometry method for large-scale investigations(Reference Chen, Jiang and Yang16,Reference Achamrah, Colange and Delay17) .
Body fat percentage cut-offs
BF% directly reflects fat accumulation, and it was considered the gold standard for obesity screening. BF% cut-offs for obesity were 25 % for boys aged 7–17 years, 30 % for girls aged 7–14 years and 35 % for girls aged 15–17 years. These BF% cut-offs correspond to moderate obesity as defined by the Chinese Guidelines for the Prevention and Control of Overweight and Obesity Among School-Aged Children (the official guidelines designed for Chinese children and adolescents aged 2–18 years), which are associated with increased risks of cardio-metabolic conditions in previous studies(Reference Williams, Going and Lohman18). They are relatively well matched with adult cut-off values of 25 % for male subjects and 35 % for female subjects. In Japan, another Asian country, the same BF% cut-offs are also recommended for obesity screening in children and adolescents(Reference Javed, Jumean and Murad19). To avoid confusion due to different meanings of the term ‘obesity’, the term ‘high adiposity’ or ‘adiposity’ is sometimes used below to refer to BF%-defined obesity.
BMI cut-offs
Three sets of BMI cut-offs were used to screen for obesity in children and adolescents in the present study, namely the IOTF, WHO and WGOC standards. The IOTF standard was released in 2000, based on data collected between 1963 and 1993 from several large, nationally representative cross-sectional surveys in Brazil, Great Britain, Hong Kong, the Netherlands, Singapore and the USA. Its IOTF BMI cut-offs for overweight and obesity at age 18 years are defined as 25 and 30 kg/m2, and 23 and 27 kg/m2 for Asian children and adolescents, respectively(Reference Cole and Lobstein3). In this paper, we adopted the IOTF cut-offs for Asian populations, and hence all the references to the IOTF cut-offs below refer to Asian cut-offs. The WHO reference (2007 edition) data sets were derived from the Health Examination Survey and the first National Health and Nutrition Examination Survey for the United States between 1963 and 1974(Reference de Onis4). At 19 years, the BMI values at +1 sd are identified as the overweight cut-off for boys and girls and the +2 sd value as the obesity cut-off. These values are equivalent to the overweight and obesity cut-off for adults (>25·0 and >30·0 kg/m2). The WGOC cut-offs were based on BMI growth curves developed by the 2000 Chinese National Survey on Student’s Constitution and Health(5). Child and adolescent overweight and obesity were defined as a BMI at or above the sex-specific 85th and 95th percentiles on the WGOC BMI-for-age growth charts and were smooth transition to the adults cut-offs for overweight (>24·0 kg/m2) and obesity (>28·0 kg/m2) at 18 years.
Statistical analysis
To ensure blinding, two different investigators independently determined individual weight status via BMI and BF% measurements. Microsoft Excel 2019 was used to compile the results into a database, and all statistical analyses were performed using SPSS version 20·0 (IBM). Mean and sd were calculated for continuous variables, and ratios and 95 % CI for categorical variables. The χ 2 tests were used to compare obesity rates among different age groups in girls. The McNemar’s test was used to compare the prevalence of obesity between two sets of BMI cut-offs. Diagnostic accuracy of BMI cut-offs for obesity screening was evaluated by the κ statistic, which assesses the level of agreement between BMI and BF% cut-offs by using the term of the chance agreement(Reference Cohen20). κ values >0·75 represent excellent agreement beyond chance, values <0·40 represent poor agreement beyond chance and values between 0·40 and 0·75 may be taken to represent fair to a good agreement beyond chance(Reference Landis and Koch21,Reference Fleiss22) . Differences between BMI cut-offs on κ values were examined by using z test. Also, the performance of BMI cut-offs was evaluated in terms of sensitivities and specificities, and the McNemar’s test was used to compare sensitivities (Se) and specificities (Sp) between two cut-offs(Reference Newcombe23). All tests were two-sided, and a P value < 0·01 was considered statistically significant.
Results
Characteristics and obesity prevalence
Characteristics of participants and obesity rates by sex and age are presented in Table 1. There were higher rates of obesity estimated by BF% cut-offs than by BMI-based cut-offs (P < 0·001) except for pre-pubertal girls and post-pubertal boys. The prevalence of high adiposity among pubertal girls (20·1 %) was prominently higher than pre-pubertal girls (9·6 %, χ 2 = 192·583; P < 0·001) and post-pubertal girls (8·7 %, χ 2 = 15·466; P < 0·001) and was approximately 2·0–3·9 times than obesity rates estimated via BMI cut-offs (5·2–10·0 %). However, by using BMI cut-offs, no differences in obesity rates between different age subgroups were significant by pairwise comparisons (all P > 0·01) among girls.
Table 1 Characteristics of the study population by sex or age

BF%, body fat percentage; IOTF, International Obesity Task Force; WGOC, Working Group of Obesity in China.
* Presented as mean and sd or ratio and 95 % CI.
† Calculated by BF% cut-offs.
‡ Significant difference from girls aged 11–14 years, P < 0·01 (χ 2 test).
§ Significantly different from BF% cut-offs in the same sex and age group, P < 0·01 (McNemar’s test).
Sensitivity, specificity and agreement
Table 2 shows the sensitivities, specificities and κ values pertaining to the three sets of BMI cut-offs by sex and age. Very high specificities (92·4–100·0 %) in obesity screening were reported by BMI cut-offs, while sensitivities and κ values varied for BMI cut-offs in different sex and age groups. The comparisons of three sets of BMI cut-offs by sensitivity and κ value revealed that the WGOC (se 39·9–84·0 %; κ 0·51–0·79) and WHO (se 25·5–74·5 %; κ 0·35–0·78) cut-offs were no superior to the IOTF (se 47·9–92·4 %; κ 0·58–0·85) cut-offs across all subgroups. Among boys, the WHO cut-offs did not perform as good as the IOTF cut-offs in κ values (0·64 v. 0·74; P < 0·001) and sensitivity (55·8 v. 66·7 %; P < 0·001) during pubertal growth. The sensitivities and κ values of the WGOC cut-offs were lower than that of the IOTF cut-offs (all P < 0·001) except for post-pubertal boys. Among girls, the WHO cut-offs indicated the worst agreement with BF% cut-offs, especially during puberty (se 25·5 %; κ 0·35) and post-puberty (se 32·6 %; κ 0·46). The WGOC cut-offs had lower sensitivities (v. IOTF) in subgroup aged 11–14 years (39·9 v. 47·9 %; P < 0·01) but showing competitive κ values in all age periods. However, all the BMI cut-offs had found poor sensitivities and lower κ values in the pubertal groups, particularly for girls (se 25·5–47·9 %; κ 0·35–0·58). Among pubertal girls, none of the BMI-based cut-offs indicated an excellent agreement with BF% cut-offs, and κ value of the WHO cut-offs (0·35 (95 % CI 0·29, 0·41)) was lower than the other two sets of BMI cut-offs (all P < 0·001), which exhibited poor agreement with BF%.
Table 2 Accuracy of BMI-based cut-offs for obesity* screening

IOTF, International Obesity Task Force; WGOC, Working Group of Obesity in China.
* Calculated using body fat percentage cut-off points of 25 % in all boys, 30 % in girls aged 7–14 years and 35 % in girls aged 15–17 years.
† Significant κ statistic, all κ yielded P < 0·001.
‡ Statistically significant difference in sensitivity from IOTF in the same subgroup, P < 0·01 (McNemar’s test).
§ Statistically significant difference in κ value from IOTF in the same subgroup, P < 0·001 (z test).
High adiposity classified by BMI cut-offs
The population who had high adiposity were classified by BMI cut-offs, which is shown in Table 3. In general, individuals with high adiposity accurately classified as obese (1248, 73·1 % for boys; 400, 67·0 % for girls) by the IOTF cut-offs were more than by other two sets of BMI cut-offs. The WGOC and WHO cut-offs yielded higher misclassification rates, in the worst-case scenario, by categorising 11·2 % of girls with high adiposity as normal and 44·4 % of them as overweight, while the IOTF cut-offs categorised 2·3 % as normal and 30·7 % as overweight. However, all BMI cut-offs did not perform well among the pubertal group, especially for girls with adiposity as they had very low probabilities of being identified as obesity (25·5–47·9 %).
Table 3 Different BMI categories among high adiposity
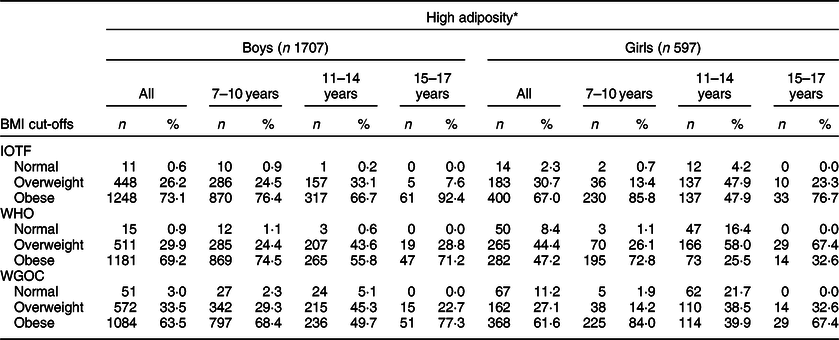
IOTF, International Obesity Task Force; WGOC, Working Group of Obesity in China.
* Defined as body fat percentage cut-off points of 25 % in all boys, 30 % in girls aged 7–14 years and 35 % in girls aged 15–17 years, presented as n and percentages.
High adiposity in overweight children and adolescents
Figure 1 shows the prevalence of high adiposity within different BMI categories. Large numbers of BMI-defined overweight individuals were found with high adiposity; especially during puberty, the prevalence of high adiposity varies from 33·0 to 68·5 % in boys with overweight and 41·6 to 71·0 % in girls with overweight, remaining very high probabilities of being high adiposity in overweight participants. Participants who were overweight classified by the IOTF cut-offs had the lowest ratios of high adiposity (4·2–41·6 %) than by the other BMI cut-offs for each subgroup.

Fig. 1 Prevalence of high adiposity within different BMI categories by age period: (a) 7–10 years, (b) 11–14 years and (c) 15–17 years. IOTF, International Obesity Task Force; WGOC, Working Group on Obesity in China. ![]() , normal;
, normal; ![]() , overweight;
, overweight; ![]() , obese
, obese
Discussion
This study compared the performances of three sets of BMI cut-offs that are applied in Chinese children and adolescents in urban setting. The IOTF and WGOC cut-offs, recommended for Asian and Chinese populations, respectively, were included. Although many studies used different BMI-based cut-offs such as WHO, IOTF and WGOC to describe the prevalence of childhood obesity, a small number of articles have carried out comparative studies among three or four sets of BMI cut-offs and drawn different conclusions for racial/ethnic groups(Reference Shan, Xi and Cheng24–Reference Adom, Kengne and De Villiers29). However, few studies made in-depth work on the performances of various BMI cut-offs and examine whether they differ by sex and age groups. Moreover, no articles engaged in comparing IOTF Asian cut-offs with other BMI references to screen for obesity in Chinese child and adolescent populations. Actually, Asian children and adults tend to have a lower BMI for a given body fatness than other ethnic groups(Reference Deurenberg-Yap, Schmidt and van Staveren30). Therefore, it is necessary to include the IOTF cut-offs for Asians as well.
Performance of BMI in screening obesity is influenced by age and gender
The large sample size enables the study of performance disparities between sex-specific and age-specific groups. The results show that the three different types of BMI-derived cut-offs exhibited different capacities in various sex- and age-specific groups. This calls into question the conclusions from previous studies that evaluated the diagnostic performance of BMI for childhood obesity, but did not classify subjects by age and gender in specific. Our results help explain the contradictory results in previous studies with some reporting higher sensitivity in boys than in girls and others reporting the opposite(Reference Neovius, Linne and Barkeling31–Reference Wickramasinghe, Cleghorn and Edmiston34). Consistent with previous studies, our study revealed higher prevalence of obesity in boys than in girls, indicating that urban boys should be key target of obesity prevention(Reference Song, Wang and Dong35). Our study also found an underestimation of the prevalence of high adiposity among pubertal girls using BMI cut-offs, another group to be concerned in obesity prevention.
Modification of BMI cut-offs for childhood obesity screening should be considered in urban China
The trade-off between sensitivity and specificity should be considered to evaluate the performance of screening standards when there are no significant differences in κ values between various BMI cut-offs. It is well known that interventions at an early age are essential to prevent childhood obesity. For this reason, low cut-offs yielding higher sensitivity are more conducive to primary prevention of child and adolescent obesity. Conversely, high cut-offs yielding lower sensitivity might reduce public awareness of the prevalence of obesity, missing opportunities to institute appropriate lifestyle interventions for mitigating health risks. The way to prioritise the sensitivity was also used in a similar study since the WHO and IOTF (not Asian cut-offs) severely underestimated the obesity rates among Asian children(Reference Liu, Byrne and Kagawa25). In addition, parents in China often equate being overweight or obese with being strong and healthy, which would inevitably exacerbate the negligence of children’s obesity. Therefore, provided they have yielded adequate specificity, cut-offs with higher sensitivity are necessary to improve obesity screening. Based on this premise, the IOTF cut-offs rather than the officially recommended WGOC cut-offs are evidently more suitable for obesity screening in urban Chinese children and adolescents. Apart from different data sources, difference also lies between the IOTF and WGOC cut-offs at 18 years of age; the IOTF cut-offs for obesity are based on country-specific centile curves passing through BMI 27 kg/m2 at the age of 18 years, while those of the WGOC are based on curves passing through BMI 28 kg/m2. This may account for the better obesity screening performance of the IOTF cut-offs observed in our study.
Attach importance to girls whose fatness dynamically increase
BMI is now irreplaceable in most low- to middle-income countries, due to its convenience. Previous studies have attributed high specificity but moderate or low sensitivity to the BMI standards in children and adolescents(Reference Javed, Jumean and Murad19). Not only are there disparities in sensitivity between different BMI cut-offs but also for the same BMI cut-offs, the sensitivity varies between different ages and sexes groups, which has not been previously reported. Our study suggests that none of the BMI-derived cut-offs investigated is adequate for obesity screening in pubertal groups, especially for girls. A possible explanation is that the increases in adiposity may be higher than that indicated by BMI during puberty(Reference McCarthy, Ellis and Cole36–Reference Ruxton, Reilly and Kirk38). Evidently, fat accumulation resumes in both sexes but that it is twice as rapid in pubertal girls(Reference Taylor, Grant and Williams39). We therefore utilised conservative BF% cut-offs in girls (cut-offs for moderate obesity for girls aged 7–17 years according to Chinese guidelines), yet surprisingly the prevalence of BF%-defined obesity is still 100–287 % higher than that determined by the various BMI-derived cut-offs. This suggests that the high prevalence of obesity in pubertal girls should not be solely attributed to physiological fat accumulation. Over half (52·1–74·5 %) of the individuals with high adiposity were misclassified into non-obese groups whatever the BMI cut-offs were used, arising poor agreement between BF% and BMI cut-offs in girls aged 11–14 years. Even using IOTF to classify the girls aged 11–14 years, the highest prevalence (41·6 %) of high adiposity was found in overweight when compared with other age subgroups (4·7–33·0 %). Therefore, more accurate indicators or techniques should be incorporated into obesity screening in girls during puberty.
Notably, the emergence of large numbers of high adiposity among children and adolescents arises with rapid economic growth in China, but only 39·9–84·0 % of them are identified as obese by the WGOC cut-offs. Those findings should not be overlooked, and stronger measures are necessary to control obesity in future, particularly in economically developed cities in China. In addition, previously reported sex disparities in which boys exhibited greater rates of high adiposity than girls are no longer evident during puberty(Reference Zhang, Li and Hawley40). Therefore, attention should be paid to changes in body weight and fat accumulation during growth in both boys and girls. The public health agencies need to initiate innovative weight management and behavioural interventions, especially for girls who are overweight.
Limitations in our study
The current study has some limitations. First, we used BIA to determine BF%, rather than dual-energy X-ray absorptiometry, which is generally regarded as the gold standard modality for measuring BF%(Reference Hung, Chen and Guo41). However, previous studies have shown strong correlations between BIA and dual-energy X-ray absorptiometry, and BIA is more suitable than dual-energy X-ray absorptiometry for use in large population-based studies(Reference Pietrobelli, Andreoli and Cervelli42,Reference Tyrrell, Richards and Hofman43) . Second, our study recommends to lower the cut-offs in order to screen for child and adolescent obesity, but it also gives rise to a possibility that those with normal weight status are labelled as overweight or obesity by this stricter standard, which might have negative psychosocial impact(Reference Sagar and Gupta44).
Conclusion
The IOTF cut-offs for Asian perform better than the cut-offs by WHO and WGOC and should be recommended for child and adolescent obesity screening in urban China. Individuals during puberty need an even more accurate indicator to screen for obesity. The public health agencies should implement appropriate weight management, behavioural and environmental interventions to reduce the obesity prevalence, especially for boys and pubertal girls.
Acknowledgements
Acknowledgements: The authors express gratitude to all the participants of the study and to the staff of Qibao Community Health Service Center of Minhang District. This work was supported by grants-in-aid from The National Natural Science Foundation of China and The Innovation Program of Shanghai Municipal Education Commission. Financial support: This work was supported by the National Natural Science Foundation of China (grant no. 71303156) and the Innovation Program of Shanghai Municipal Education Commission (grant no.14YS019). Conflict of interest: There are no conflicts of interest. Authorship: K.Q. and L.T. conceptualised and designed the study, drafted the initial manuscript, and reviewed and revised the manuscript. Z.L., F.Y., S.G. and X.R. collected data and carried out the initial analyses. Professor H.L. and S.L. reviewed and revised the manuscript. Dr J.Z. and Professor Z.Z. conceptualised and designed the study, coordinated and supervised data collection and critically reviewed the manuscript for important intellectual content. All authors approved the final manuscript as submitted and agree to be accountable for all aspects of the work. Ethics of human subject participation: This study was conducted according to the guidelines laid down in the Declaration of Helsinki, and all procedures involving research study participants were approved by the institutional ethics boards of Shanghai Jiao Tong University, School of Public Health. Written informed consent was obtained from all subjects/patients.


