


The global nutrition transition is often defined as the changes in nutrient consumption that occur when developing populations modernize and urbanize because of economic development and other social and lifestyle changes, leading to changes in the availability and affordability and thus exposure to new foods and products, including more processed and ‘takeaway’ foods( Reference Hawkes 1 , Reference Vorster, Kruger and Margetts 2 ). The resultant changes in nutrient intakes are seen to be part of the epidemiological (health) transition, contributing to an increased risk of non-communicable diseases (NCD)( Reference Hawkes 1 , Reference Vorster, Kruger and Margetts 2 ). South Africa (SA), a low-middle-income country, is in the midst of a health transition characterized by a burden of communicable and non-communicable diseases as well as perinatal, maternal and injury-related disorders( Reference Mayosi, Flisher and Lalloo 3 ). There are sharp increases in overweight, obesity, hypertension, diabetes and CVD in South African populations without substantial improvements of undernutrition in children( Reference Mayosi, Flisher and Lalloo 3 – Reference Shisana, Labadarios and Rehle 5 ). The South African Medical Research Council( Reference Norman, Bradshaw and Schneider 6 ) showed that both under- and overnutrition are risk factors for disability-adjusted life years and mortality in the South African population. This confirms previous research( Reference Vorster, Kruger and Margetts 2 ) that NCD emerged in sub-Saharan Africa at a faster rate and at a lower economic level than in industrialized countries in the past, before the battle against undernutrition has been won, leading to the phenomenon of a double burden of consequences of the coexistence of under- and overnutrition( Reference Vorster, Kruger and Margetts 2 ).
We have previously illustrated that the diet followed by black South Africans in rural areas of the North West Province (NWP) does not meet micronutrient requirements( Reference Vorster, Venter and Kruger 7 – Reference Wentzel-Viljoen, Lee and Laubscher 11 ) and that both rural and urban black populations increased their added sugar intake, especially as sucrose-sweetened beverages, from 2005 to 2010( Reference Vorster, Kruger and Wentzel-Viljoen 12 ). In an effort to address the micronutrient deficiencies in the South African population, the Department of Health (Directorate Nutrition) instituted a mandatory micronutrient fortification of the staples, maize meal and bread flour, in 2003( 13 ) that came into effect in 2004. Data on food intake per se of sub-populations in SA are scarce and a need has been identified to collect and publish food intake data of South Africans( Reference Van Heerden and Schonfeldt 14 ).
To promote and strengthen the observed beneficial nutrition transition changes in micronutrient intakes of the PURE-NWP-SA participants with urbanization and modernization( Reference Wentzel-Viljoen, Lee and Laubscher 11 ), and at the same time to prevent adverse changes in macronutrient intakes, it is necessary to know which foods were responsible for the reported changes in nutrient intakes( Reference Wentzel-Viljoen, Lee and Laubscher 11 ). Knowledge of these changes in food intake can then be applied in appropriate education programmes using the South African food-based dietary guidelines (SAFBDG)( Reference Vorster, Badham and Venter 15 ) to promote optimal nutrition from diets that are adequate regarding micronutrients and at the same time protective against overnutrition and risk of NCD regarding the macronutrients. The purpose of the present paper is therefore to examine and report on the changes in food intakes from 2005 to 2010 in rural and urban black South Africans participating in the Prospective Urban and Rural Epidemiological (PURE-NWP-SA) study.
Methods
The PURE-NWP-SA study: participants and design
The participants were volunteers participating in the PURE-NWP-SA study. The PURE study is an international prospective cohort study tracking changing lifestyles, risk factors and chronic disease in urban and rural areas of seventeen countries in transition( Reference Corsi, Subramanian and Chow 16 , Reference Schutte, Schutte and Huisman 17 ). One of the South African legs of the PURE study is being conducted in a rural and an urban area of the NWP. The baseline study was conducted in 2005 and the first follow-up in 2010. The study design of the PURE-NWP-SA study has been described elsewhere( Reference Vorster, Kruger and Wentzel-Viljoen 12 , Reference Schutte, Schutte and Huisman 17 , Reference Sotunde, Kruger and Wright 18 ). Briefly, participants were recruited from four different sites (two in the rural area, two in the urban area) in the NWP of SA. The study was explained to the individuals and after voluntary and informed consent was obtained the questionnaires were completed. A total of 2010 participants were tested (about 500 in each community) in 2005, of which dietary data were available for 1858 participants. In the 5-year follow-up survey conducted in 2010, 1233 participants were included. Figure 1 provides a summary of the recruitment and follow-up procedures (adapted from Vorster et al.( Reference Vorster, Kruger and Wentzel-Viljoen 12 )).
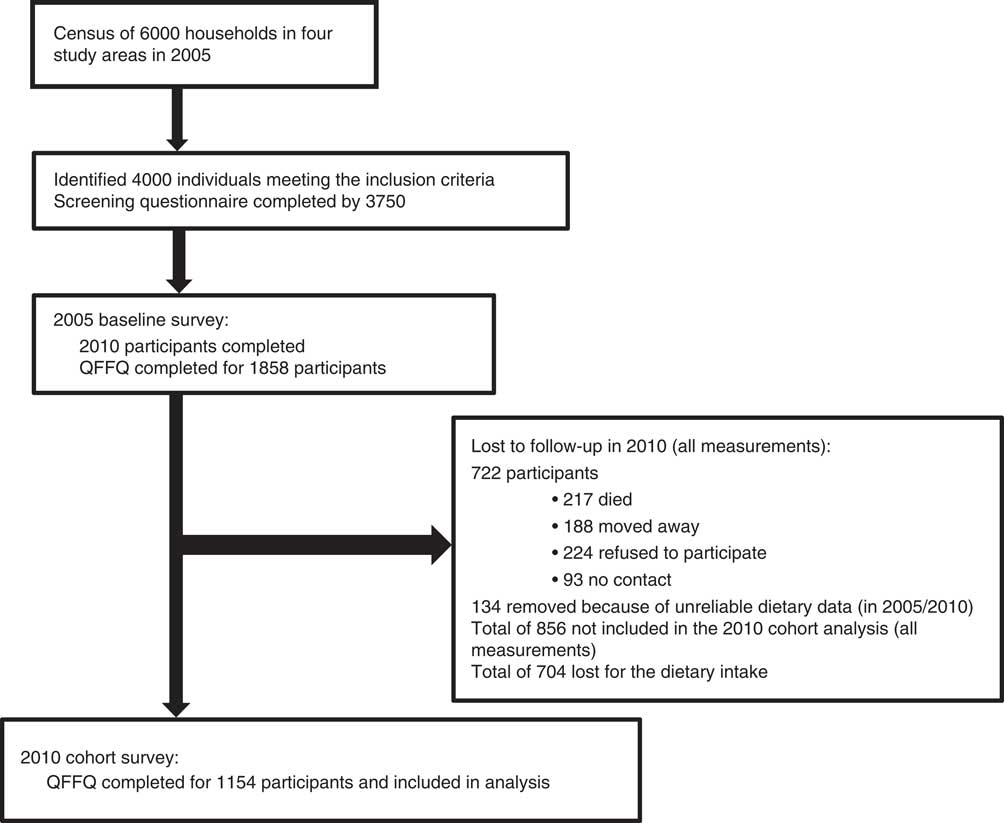
Fig. 1 Participant recruitment and follow-up from years 2005 to 2010 (adapted from Vorster et al.( Reference Vorster, Kruger and Wentzel-Viljoen 12 )). QFFQ, quantified FFQ
Measurements: questionnaires
Standardized structured demographic, socio-economic, lifestyle and physical activity questionnaires of the international PURE study were used( Reference Corsi, Subramanian and Chow 16 ). These questionnaires were adapted for the South African study where necessary. Sixteen volunteer fieldworkers were recruited from the communities where the study was executed and intensively trained to complete the questionnaires at the study sites or participants’ homes. The quantified FFQ (QFFQ) used to collect dietary intake data has been described elsewhere( Reference Wentzel-Viljoen, Lee and Laubscher 11 ). Briefly, a previously validated, culture-sensitive QFFQ was used to obtain dietary intakes covering the previous month( Reference MacIntyre, Venter and Vorster 19 – Reference MacIntyre, Venter and Vorster 22 ). Suitable tools, including a food-portion photograph book( Reference Venter, MacIntyre and Vorster 23 ) specifically developed and tested for this population, were used to quantify amounts and frequencies of foods eaten. The validation of the QFFQ included a comparison of intake results obtained with the questionnaire and with 7 d weighed records in a sample from the same communities participating in this study( Reference MacIntyre, Venter and Vorster 20 ). The food intake divided into seven food groups (milk; meat; fruit; vegetables; maize meal; bread; added sugar), as measured by the QFFQ and the 7 d weighed records, indicated that the QFFQ was valid also for these food groups( Reference MacIntyre, Venter and Vorster 20 ). The quantities of foods reported were converted to weights using standard tables( Reference Langenhoven, Conradie and Wolmarans 24 ). When coding the QFFQ, mixed dishes, not available in the South African food composition tables( Reference Wolmarans, Danster and Dalton 25 ), were split into single ingredients according to recipes collected from the participants or ‘standard’, unpublished recipes obtained from the local communities, especially for traditional dishes such as Potchefstroom cookies, chakalaka (a salad of tinned beans, peppers and tomato) and ting (a fermented maize and/or sorghum porridge).
Food intake: approaches in presenting the data
Food intakes were categorized first into twelve food groups; Table 1 shows examples of the foods in each group, as well as the relevant SAFBDG( Reference Vorster, Badham and Venter 15 , Reference Vorster 26 – Reference Jacobs and Steyn 34 ). Table 1 indicates that, generally, the first seven food groups may be regarded as the ‘healthier’ food groups with positive messages for consumption in the SAFBDG, while the last five groups may be regarded as the ‘less healthy’ choices with recommendations in the SAFBDG to limit intake or to use sparingly. In some food groups, both ‘healthier’ and ‘less healthy choices’ are possible (e.g. freshly cooked lean meat, chicken or fish in recommended quantities as the ‘healthier choice’ v. highly processed meats in larger-than-recommended quantities as the ‘unhealthy choice’). The twelve food groups in Table 1 are therefore based on the SAFBDG which aim to lead to optimum or adequate nutrition, while protecting against the development of risk factors of NCD.
Table 1 The content of the twelve food groups
SAFBDG, South African food-based dietary guideline.
Tables 2 and 3 show median intakes of energy and foods in each of the twelve food groups for men and women in rural and urban areas in both 2005 and 2010. Further groupings of individual food intakes or food group intakes (combinations of foods in grams) are shown in Tables 4 and 5 for those participants (men and women separately) who consumed these particular foods (by at least 5 % of the participants in any group). For example, sunflower oil intake is reported as a single food item, while all yellow vegetables and all green leafy vegetables are grouped together. Faber et al. identified options and methods available to group foods together for analysis purposes( Reference Faber, Wenhold and MacIntyre 35 ). We therefore followed a combination of a food group and an FBDG approach while keeping foods with a low contribution to micronutrient intake (e.g. added sugar) separate. The SAFBDG describe milk intake as a separate guideline and hence our decision to keep it separate from animal protein intake( Reference Vorster, Wentzel-Viljoen and Vermaak 29 ). The sequence of the food items is based on the percentage of consumers among the rural men/women in 2005. In addition, foods (or food groups) that are known to be associated with either a positive or negative health outcome were kept separate to facilitate statistical analysis in future. Tables 6–9 show the contribution of specific foods or food groups to total energy intake.
Table 2 Daily energy intake, energy distribution of macronutrients and intakes of twelve selected food groups of male participants according to rural/urban residence in 2005 and 2010; PURE-NWP-SA study
PURE-NWP-SA, Prospective Urban and Rural Epidemiology in the North West Province of South Africa; P25, 25th percentile; P75, 75th percentile; TE, total energy.
* P value from Wilcoxon signed-rank test for significance of differences between 2005 and 2010 for men.
Table 3 Daily energy intake, energy distribution of macronutrients and intakes of twelve selected food groups of female participants according to rural/urban residence in 2005 and 2010; PURE-NWP-SA study
PURE-NWP-SA, Prospective Urban and Rural Epidemiology in the North West Province of South Africa; P25, 25th percentile; P75, 75th percentile; TE, total energy.
* P value from Wilcoxon signed-rank test for significance of differences between 2005 and 2010 for women.
Table 4 Daily energy intake, energy distribution of macronutrients and food intakes of male consumers according to rural/urban residence in 2005 and 2010; PURE-NWP-SA study

PURE-NWP-SA, Prospective Urban and Rural Epidemiology in the North West Province of South Africa; P25, 25th percentile; P75, 75th percentile; TE, total energy.
* Percentage of consumers.
Table 5 Daily energy intake, energy distribution of macronutrients and food intakes of female consumers according to rural/urban residence in 2005 and 2010; PURE-NWP-SA study
PURE-NWP-SA, Prospective Urban and Rural Epidemiology in the North West Province of South Africa; P25, 25th percentile; P75, 75th percentile; TE, total energy.
* Percentage of consumers.
Table 6 Percentage contribution of twelve food groups to total energy intake for the male participants according to rural/urban residence in 2005 and 2010; PURE-NWP-SA study
PURE-NWP-SA, Prospective Urban and Rural Epidemiology in the North West Province of South Africa; P25, 25th percentile; P75, 75th percentile; TE, total energy.
* Percentage of consumers.
Table 7 Percentage contribution of twelve food groups to total energy intake for the female participants according to rural/urban residence in 2005 and 2010; PURE-NWP-SA study
PURE-NWP-SA, Prospective Urban and Rural Epidemiology in the North West Province of South Africa; P25, 25th percentile; P75, 75th percentile; TE, total energy.
* Percentage of consumers.
Table 8 Percentage contribution to total energy intake of individual food groups eaten by at least 25 % of male participants AND contributing at least 5 % to total energy in 2005 or 2010 according to rural/urban residence; PURE-NWP-SA study

PURE-NWP-SA, Prospective Urban and Rural Epidemiology in the North West Province of South Africa; P25, 25th percentile; P75, 75th percentile; TE, total energy.
* Percentage of consumers.
Table 9 Percentage contribution to total energy intake of individual food groups eaten by at least 25 % of female participants AND contributing at least 5 % to total energy in 2005 or 2010 according to rural/urban residence; PURE-NWP-SA study
PURE-NWP-SA, Prospective Urban and Rural Epidemiology in the North West Province of South Africa; P25, 25th percentile; P75, 75th percentile; TE, total energy.
* Percentage of consumers.
Statistical analyses
As previously reported, participants with energy intakes of ≥30 000 or ≤3000 kJ/d were excluded( Reference Wentzel-Viljoen, Lee and Laubscher 11 , Reference Vorster, Kruger and Wentzel-Viljoen 12 ). The statistical software package Stata version 14 was used for the analysis. Since the food intake data were skewed, results are reported as median and 25th–75th percentile. Wilcoxon’s signed-rank test was used to test for changes in food intakes based on the twelve food groups between 2005 and 2010 for each of the four groups (by gender and study site). To test for significant changes for the individual food items (as it was not always the same individuals who consumed a food item in 2005 and 2010) is a challenge. We used quartile regression (median specifically) to test whether there was a change in the gram intake of a food from 2005 to 2010, between rural and urban, for men and women separately. These are shown in Fig. 2 for the individual food groups consumed by at least 90 % of the participants and contributing at least 10 % to total energy intake (for both genders and in 2005 and 2010), namely: (i) cooked porridge (e.g. maize meal, maltabella, oats); (ii) samp, maize rice, wheat rice, rice, macaroni and spaghetti; (iii) sugar, white and brown; and (iv) bread, rolls, vetkoek.
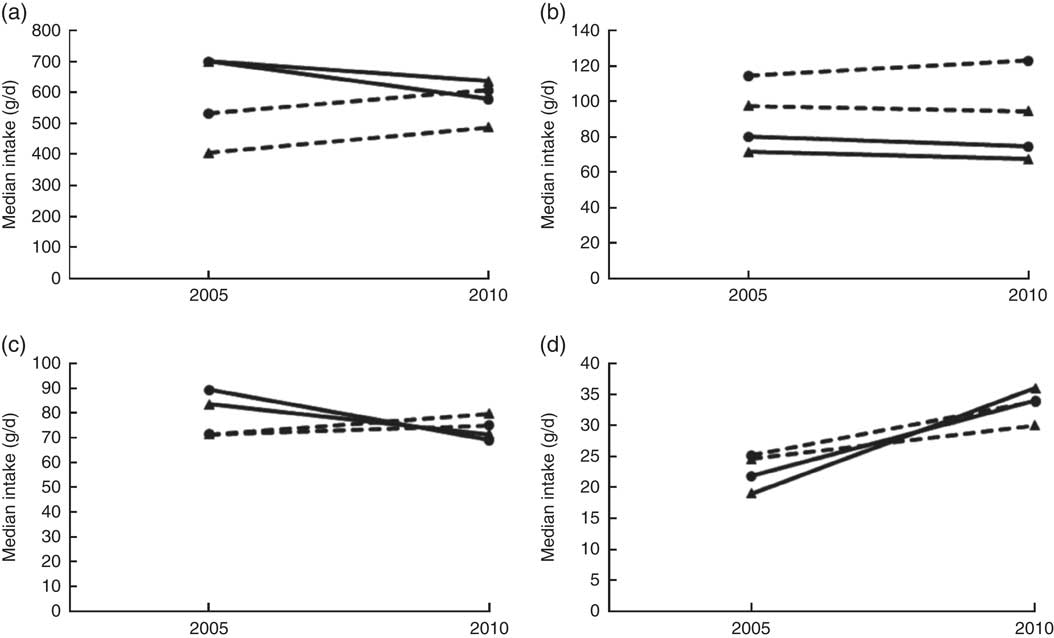
Fig. 2 Changes in the median intakes of four food groups over time (2005 to 2010) by men and women in the PURE-NWP-SA study: (a) cooked porridge; (b) bread and vetkoek; (c) samp, maize and rice; (d) white and brown sugar (![]() , rural men;
, rural men; ![]() , urban men;
, urban men; ![]() , rural women;
, rural women; ![]() , urban women). PURE-NWP-SA, Prospective Urban and Rural Epidemiology in the North West Province of South Africa
, urban women). PURE-NWP-SA, Prospective Urban and Rural Epidemiology in the North West Province of South Africa
We previously reported the baseline mean characteristics in 2005 of the cohort and of those participants lost to follow-up( Reference Wentzel-Viljoen, Lee and Laubscher 11 ), as shown in Table 10. As mentioned, food intakes (grams per day) are reported in Tables 2 to 5. Table 11 presents the percentage of consumers meeting the recommended intakes for fruit and vegetables and milk and milk products in 2005 and 2010 based on the SAFBDG( Reference Naudé 27 , Reference Vorster, Wentzel-Viljoen and Vermaak 29 ).
Table 10 Baseline characteristics in 2005 of participants followed up from 2005 to 2010 (the cohort) compared with subjects lost to follow-up; PURE-NWP-SA study
PURE-NWP-SA, Prospective Urban and Rural Epidemiology in the North West Province of South Africa; P25, 25th percentile; P75, 75th percentile.
* P value for significant differences between subjects followed up in 2010 and those lost to follow-up (χ 2 test for categorical variables; Wilcoxon’s signed-rank test for continuous variables).
Table 11 Percentage of consumers meeting the recommended intake for male and female participants according to rural/urban residence in 2005 and 2010; PURE-NWP-SA study

PURE-NWP-SA, Prospective Urban and Rural Epidemiology in the North West Province of South Africa.
* P value from Wilcoxon signed-rank test for significance of differences between 2005 and 2010 for men/women.
† 1 portion=80 g fruit or vegetables( Reference Naudé 27 ).
‡ 1 portion=200 g milk/yoghurt or 50 g hard cheese( Reference Vorster, Wentzel-Viljoen and Vermaak 29 ).
Results
Comparison of the cohort with those lost from the study
Dietary intake data of 1858 participants were measured in 2005. Table 10 shows the characteristics (in 2005) of the 1154 cohort participants who could be followed up in 2010 compared with the baseline characteristics of the 856 participants (of the total original recruited group of 2010 participants in 2005) lost to follow-up. The latter were slightly (but significantly) younger, with lower BMI, HDL-cholesterol and total energy intake. The percentage of men in the group lost to follow-up was also significantly higher.
Comparison of food intakes in 2005 and 2010
The top rows of Tables 2 to 5 give the energy distribution of total energy intake between protein, fat and carbohydrate. These data illustrate the slight but significant increases in energy from protein and fat and decrease in energy from carbohydrate of all groups over time.
Tables 2 and 3 show that in this 5-year period from 2005 to 2010, rural and urban men and women decreased the contribution of cooked porridge and other starchy staples to total energy intake: for example, rural men and women had a median intake of cooked porridge of 700 g/d in 2005 and decreased their intake to 621 and 650 g/d, respectively, in 2010. The corresponding figures for urban participants increased: urban women consumed 448 g/d in 2005 and 507 g/d in 2010, while urban men consumed 539 g/d in 2005 and 679 g/d in 2010. Given that energy intake of urban women increased from 9·0 to 11·7 MJ/d and that of urban men from 9·9 to 13·7 MJ/d (Tables 2 and 3), this explains the decreased energy contribution of cooked porridge to total energy intake from 36 to 30 % in rural men, and from 26 to 23 % in urban men, from 2005 to 2010 (Table 6). The corresponding figures were a decrease from 40 to 32 % in rural women and from 23 to 18 % in urban women over this 5-year period (Table 7). However, cooked porridge remained the staple with almost all participants consuming it on a daily basis, as shown in Tables 2 to 5. Furthermore, Tables 4 and 5 also emphasize the decrease in consumption of the other starchy staple food group, which includes bread and vetkoek (a deep-fried ‘bun’ made from fortified wheat flour), and especially the smaller contribution these foods made to total energy intake from 2005 to 2010, despite increased energy intakes over this time. The changes were from 22 to 20 % in rural men; from 21 to 20 % in urban men; from 25 to 19 % in rural women; and from 22 to 21 % in urban women (Tables 6 and 7). Therefore, although in both rural and urban participants the actual daily gram intake of starchy foods increased, the percentage contribution of staple foods to total energy intake decreased.
In addition, the change (2005 to 2010) in the gram intake (median) of cooked porridge was different between rural and urban areas for both men and women (men, P=0·017; women, P<0·001). In 2005, both men and women in rural areas consumed larger quantities of cooked porridge than their urban counterparts, while in 2010 it reversed (Fig. 2). For the samp, maize rice, etc. group, the change (2005 to 2010) in median intake was different between rural and urban areas (men, P=0·012; women, P=0·005). In 2005, both men and women in rural areas consumed more than their urban counterparts, while in 2010 it reversed. The median intake in 2005 and 2010 of bread and vetkoek was similar, but both men and women in urban areas consumed significantly more than their rural counterparts (men, 34 g, P=0·001; women, 26 g, P<0·001).
Median vegetable, fruit, fruit juices and legume intakes increased in rural and urban men and women (Tables 2 and 3). However, total amounts consumed were relatively small. For example, median intake of fresh vegetables by rural women in 2010 was only 58 g/d and in urban women 106 g/d.
Median consumption of milk and milk products by rural men increased from 8 to 110 g/d and from 103 to 182 g/d in urban men. The increases in rural women were from 8 to 111 g/d and in urban women from 124 to 170 g/d (Tables 2 and 3).
Foods containing added sugar increased from 25 to 102 g/d in rural men from 2005 to 2010, and from 85 to 141 g/d in urban men over this period (Table 2). In women, the corresponding figures were from 33 to 101 g/d and from 99 to 164 g/d (Table 3). Tables 6 and 7 show that in all groups (except urban women) these figures represent less than 10 % of total energy from added sugar in sugar-containing foods such as baked products, syrups and sweets. These figures could be misleading as this food group includes products like cake that is not only added sugar per se. However, in Tables 4 and 5, white and brown sugar consumption per se are shown (only the sugar added to tea, coffee, porridges, cold drinks, cake, etc.). This added sugar in the diet increased in all groups from 2005 to 2010, being consumed by more than 90 % of all participants in 2005 and 2010. The median intake of sugar increased significantly by 12 g/d for men in rural and urban areas between 2005 and 2010 (P<0·001). For women the change (2005 to 2010) in the median gram intake was different between rural and urban areas (P=0·001). In 2005, women in rural areas consumed less than their urban counterparts, while in 2010 it reversed (Fig. 2). The percentage of consumers in rural areas (men and women) of sugar-added carbonated cold drinks increased dramatically over time.
The intake of foods from animals (excluding milk and milk products) increased significantly from 2005 to 2010: from 48 to 97 g/d in rural men, and from 131 to 191 g/d in urban men (Table 2). In women, the corresponding figures were 45 to 78 g/d for rural women and 120 to 174 g/d for urban women (Table 3). However, Tables 4 and 5 show that of all the animal foods eaten, chicken was the most popular. More participants ate chicken than any other ‘meat’ in 2005 and this continued in 2010. Tables 4 and 5 also show that the changes in rural and urban men and women were essentially the same. Large increases were observed in the percentage of participants consuming processed meat over time in the rural men and women, while the percentage of consumers decreased for the urban groups. However, the quantities remained relatively small with the highest median intake of 21 g/d (urban men in 2010).
From the above it becomes clear that the additional dietary energy in 2010 was provided by both ‘healthier’ and less ‘healthier’ food choices. Table 3, for example, shows that the ‘healthier’ food choices of women in 2010 were increased intakes of fresh vegetables, fresh fruit and juices, and legumes and legume products. The less ‘healthier’ choices were an increased consumption of more products containing sugar and savoury snacks and dishes. In men (Table 4), as in women (Table 5), marked increases in added sugar (sugar added to porridge or coffee and tea) were seen. A beneficial change seen in men (but not in women) was an increased intake of fresh, full-fat milk (Tables 4 and 5).
Another important observation from Tables 2 to 5 is that although the vegetable and fruit intakes in both men and women increased from 2005 to 2010, the total amounts of foods in these groups were relatively modest. For example, in 2010 rural women consumed a median of ~58 g each of vegetables and fruit daily, while the urban women consumed 106 and 164 g of vegetables and fruit daily, respectively. This is still less than the recommendation of at least 400 g/d given in the SAFBDG( Reference Naudé 27 ).
The foods most often consumed included cooked porridge, sunflower oil, starchy grains, sugar, bread, coffee and tea, and some form of vegetables. The only animal protein food consumed by all groups as part of the ‘top ten’ consumed foods was chicken (either home-prepared or bought as fried chicken). Fruit was not part of the ‘top ten’ consumed foods for men, but white-flesh fruit (apples, bananas, pears) were for the urban women in 2005 and 2010 and the rural women in 2010.
Tables 6 and 7 show the percentage contribution to total energy intake of the twelve food groups. Cooked porridge stayed the main source of energy over time for both men and women in the rural and urban areas. The contribution of alcohol to energy intake decreased in all groups over time. Tables 8 and 9 show the percentage contribution to total energy intake of individual foods/food groups eaten by at least 25 % of men and women and contributing at least 5 % to total energy intake. In men (Table 8), only four individual food groups and alcoholic drinks complied with these criteria. In women (Table 9), the same individual food groups and alcoholic drinks met these criteria, as well as maas/sour milk (traditional fermented milk drink). It is noteworthy that the diet of the rural women in 2005 had the smallest variety of foods eaten in meaningful quantities. Table 11 presents the percentage of consumers who met the recommended number of portions according to the SAFBDG for vegetables and fruit as well as milk and milk products. Despite a significant increase from 2005 to 2010 in the number of participants meeting the recommendations and even after an improvement in energy intake, meaning that more foods were eaten in 2010 by rural and urban participants, less than a third of the men and women in urban areas met the recommendation for vegetables and fruit, and only 12·4 % of urban men and 11·5 % of urban women met the recommendation for milk and milk products.
Discussion
Limitations and strengths of the study
The main aim of this part of the PURE-NWP-SA study was to identify the foods and/or food groups responsible for the reported changes in nutrient intakes from 2005 to 2010 of the study participants( Reference Wentzel-Viljoen, Lee and Laubscher 11 ). A limitation of the study is the high proportion of subjects lost to follow-up, as discussed previously( Reference Wentzel-Viljoen, Lee and Laubscher 11 , Reference Vorster, Kruger and Wentzel-Viljoen 12 ). Those lost to follow-up were significantly younger, more males, with a higher percentage of HIV infection, lower BMI, lower waist circumference, lower HDL-cholesterol and lower energy intake than those followed up. The main reasons were migration or death( Reference Wentzel-Viljoen, Lee and Laubscher 11 , Reference Vorster, Kruger and Wentzel-Viljoen 12 ). Another limitation is that grouping of foods into only twelve food groups is tricky. Food products with different nutrient content, especially micronutrients, and weight per portion are grouped together and could be misleading. For example, the milk group contains liquid milk and cheese with well-known differences in quantities usually consumed. However, we continue to do it since we knew that the percentage of participants consuming cheese was relatively small and the portion size was also small. A potential limitation may be in the use of the QFFQ to measure individual dietary intake. However, the QFFQ was applied by well-trained fieldworkers in lengthy individual discussions of which foods were eaten during the previous month, how often, as well as an estimation of serving (portion) sizes. The QFFQ was extensively validated for this population for both individual nutrient and food intakes and as food groups( Reference MacIntyre, Venter and Vorster 19 , Reference MacIntyre, Venter and Vorster 20 , Reference Wentzel-Viljoen, Laubscher and Kruger 21 , Reference MacIntyre, Venter and Vorster 22 ). The same group of researchers and fieldworkers measured intakes in 2005 and 2010.
A major strength of the study is the prospective cohort design, although the period of only 5 years may be regarded as a limitation. However, our publication on nutrient intakes( Reference Wentzel-Viljoen, Lee and Laubscher 11 ) indicated significant differences in intakes during this 5-year period.
The context of nutrient changes in evaluation of changes in food intake
It has been mentioned that we found that the changes in energy and nutrient intakes of these rural and urban women and men from 2005 to 2010 followed the changes described for the nutrition transition in other parts of the world( Reference Hawkes 1 , Reference Wentzel-Viljoen, Lee and Laubscher 11 , Reference Vorster, Kruger and Wentzel-Viljoen 12 ). It is, however, important for developing policies and programmes for specific populations to steer the nutrition transition in a beneficial direction, to know which foods were responsible for positive changes, so that they may be targeted in interventions. Positive changes would be those that improve nutritional status (in this population particularly addressing micronutrient deficiencies), without increasing risk of overweight, obesity and therefore NCD. Briefly, taking the changes in intakes of women as an example, we showed( Reference Wentzel-Viljoen, Lee and Laubscher 11 ) that in 2005 rural women had a median energy intake of 6·2 MJ/d compared with 9·0 MJ/d of urban women, a difference of 45 %. In 2010 this cohort of rural women increased their energy intake to 9·1 MJ/d and the urban women to 11·7 MJ/d, increases of 47 and 30 %, respectively. So, the rural women had an energy intake in 2010 similar to that of the urban women in 2005. Similarly, rural men increased their energy intake from a median of 6·9 MJ/d in 2005 to 9·7 MJ/d in 2010 and urban men from 9·9 to 13·7 MJ/d in the corresponding years (Table 2 and 3).
The changes in distribution of energy between the macronutrients gives a background for evaluating food contributions to changing energy intakes. Urban women had slightly more of their energy as total protein than rural women. Both urban and rural women ingested more of their energy as animal protein sources in 2005, and both rural and urban women decreased plant protein intake from a median of 7·5 and 6·1 % of total energy in 2005 to 6·3 and 5·5 %, respectively, in 2010. The changes in total fat intake are intriguing. In 2005, rural and urban women had respective median intakes of 20·3 and 28·4 % of total energy as fat. In 2010, rural women had a median intake of 22·9 % and urban women 27·7 %. It seems as if the urban women already reached a plateau in 2005, while rural women had only a slight increase in total energy as fat. The differences and changes in saturated and polyunsaturated fats largely mirrored differences and changes of the animal v. plant protein intakes( Reference Wentzel-Viljoen, Lee and Laubscher 11 ).
It seems therefore that the percentage of energy as carbohydrate may reflect the biggest change in the distribution of energy. In 2005, rural women had 66·7 % of their energy as carbohydrate and urban women 55·7 %. In 2010 this changed to 61·7 and 54·1 %, respectively. Again, it seems that while the rural women decreased the total percentage of energy contributed by carbohydrate over the 5 years, the urban women may have reached a plateau or ‘steady state’ already in 2005. However, the percentage of energy provided by added sugar increased in both the rural and urban women, from 6·4 to 8·9 % and from 8·2 to 9·0 %, respectively, from 2005 to 2010. Thus, although total carbohydrate energy decreased, energy from added sugar increased.
The changes observed in rural and urban men largely mirrored what was seen in women, although energy from total fat was even lower in the men( Reference Wentzel-Viljoen, Lee and Laubscher 11 ). Rural men had a median energy intake from fat in 2005 of 17·8 % and of 21·5 % in 2010, while urban men increased their median energy intake from fat from 24·9 to 26·3 %. These values are well below the value of 30 % of energy from fat recommended in the SAFBDG( Reference Smuts and Wolmarans 31 ) and leaves room for increased energy intake from foods rich in α-linoleic and n-3 fatty acids such as plant oils (e.g. sunflower or olive oil) or fish.
Beneficial and detrimental changes in food intake
The results of the analysis of changes in foods eaten clearly showed some beneficial effects over the 5 years (more vegetables and fruit, more milk and milk products, more fish and more foods from animal sources), which will all contribute to improved micronutrient intakes. Unfortunately, these changes were small and did not allow the majority of participants to reach recommended intakes of vegetables, fruit, and milk and milk products. Furthermore, some detrimental changes were observed, especially an increase in added sugar intake, mainly in the form of sugar-sweetened beverages, increased consumption of beer by women and increased intakes of processed meat, savoury snacks and hard margarine (and therefore a higher saturated fat intake), illustrating an emergence of processed foods in the diet, which is of concern. We have previously shown that the increased intakes of added sugar and sucrose-sweetened beverages have a detrimental effect on several risk factors for NCD( Reference Vorster, Kruger and Wentzel-Viljoen 12 ) in this specific population. Furthermore, a study from Sweden showed that a sucrose intake of more than 15 % of energy is associated with an increased risk of a coronary event( Reference Warfa, Drake and Wallström 36 ). Processed meat consumption has been linked to an increased risk of certain types of cancer( Reference Lippi, Mattiuzzi and Cervellin 37 – Reference Stepien, Chajes and Romieu 40 ). Hard margarines contribute to saturated fat intake and are potential sources of trans-fatty acids with known detrimental effects on risk of CVD( Reference Smuts and Wolmarans 31 ). More and more global dietary and food recommendations mention the need for home-prepared meals from fresh ingredients because of the high energy content of processed foods and links to obesity( Reference Monteiro, Levy and Claro 41 ).
Diet variety
There was no evidence of ‘new’ foods eaten in 2010 and the ‘top ten’ consumed foods remained unchanged from 2005 to 2010. (Note: participants were always requested to report foods eaten that were not part of the QFFQ.) However, some products were consumed by a larger percentage of participants in 2010 than in 2005. For example, white-flesh fruit was eaten by 77·6 % of rural women in 2005 and by 88·3 % of them in 2010. Similarly, more men consumed products such as milk, eggs, organ meats, processed meats, hard margarine and cooked starchy vegetables with added fat in 2010 than in 2005.
Dietary staples
The decreased intake of cooked maize porridge and bread may be of concern because of the mandatory fortification of maize meal and bread flour( 13 ) to provide micronutrients. However, the data show that porridges are replaced to a certain extent by micronutrient-rich foods such as vegetables, fruit, milk and animal-origin foods. These trends should be encouraged to increase the total amounts of these foods eaten.
Added sugar
The increased intakes of products containing added sugar by all groups is a real concern that should be addressed. The South African Government is in a process of instituting taxation of sugar-sweetened beverages in an attempt to address the growing public health problem of obesity( Reference Tugendhaft, Manyema and Veerman 42 , Reference Manyema, Veerman and Chola 43 ). Although this tax was introduced on 1 April 2018, it is not certain if it will be an effective mechanism to address obesity in the South African population.
Conclusions
It is concluded that from 2005 to 2010, as part of the nutrition transition, rural and urban men and women in the NWP of SA changed dietary choices that resulted in improved diets, but also in some instances included more products that may increase risks of NCD. These changes were probably based on what were available and affordable to both rural and urban communities. The opening of a large food retail store in the rural community could have contributed to the availability and affordability of less healthy foods. This population needs to be informed on the potential effects of these potential negative dietary changes while encouraging current good practices like the consumption of whole grains, fruit and vegetables, chicken meat and canned fish. It is suggested that nutrition education interventions could assist the adult and adolescent populations in this province to choose their foods eaten based on knowledge of the beneficial and detrimental effects of certain foods and food products. Although this is the first prospective study in SA on a large cohort, the results should be interpreted with caution and not generalized for all the different ethnic groups.
Acknowledgements
Acknowledgements: The authors acknowledge the contribution of the late Professor Annamarie Kruger to the PURE South Africa study. They thank all supporting staff and participants in the PURE study; in particular, from PURE South Africa, the PURE-NWP-SA research team, fieldworkers and office staff in the Africa Unit for Transdisciplinary Health Research and the Centre of Excellence for Nutrition, Faculty of Health Sciences, North-West University, Potchefstroom, South Africa; and from PURE International, S. Yusuf and the PURE project office staff at the Population Health Research Institute, Hamilton Health Sciences and McMaster University, Ontario, Canada. Financial support: This work was supported by the South Africa Netherlands Research Program on Alternatives in Development; the South African National Research Foundation (GUN numbers 2069139 and FA2006040700010); North-West University; the Population Health Research Institute, McMaster University, Canada; and the South African Medical Research Council. Funders were not involved in any aspect of the design, implementation, analysis, or interpretation and written account of the study. Conflict of interest: The authors declare that they have no competing interests. Authorship: E.W.-V. and H.H.V. were responsible for the conception and design, analysis and interpretation of the data and wrote the manuscript. R.L. was responsible for the statistical analysis of the data, made contributions to the interpretation of the data and critically revised the manuscript for important intellectual content. Ethics of human subject participation: The Ethics Committee of the North-West University approved the study (04M10 and NWU-0016-10-A1). The study complied with all applicable requirements of international regulations, including the Helsinki Declaration of 1975 (as revised in 2008). Permission for the study was also obtained from the North-West Provincial Department of Health, local government authorities, and tribal chiefs in the rural areas. Volunteers gave written informed consent. The participants were transported to and from the study sites in both the urban and rural areas. They received lunch on site after blood sampling was completed. The study is registered at ClinicalTrials.gov (ID: NCT03225586; http://www.clinicaltrials.gov).


