


Many epidemiological studies have investigated the association between eating frequency (EF) and adiposity measures, but the results are highly inconsistent with a mixture of inverse( Reference Drummond, Crombie and Cursiter 1 – Reference Smith, Blizzard and McNaughton 7 ), null( Reference Kant, Schatzkin and Graubard 8 – Reference Mills, Perry and Reicks 13 ) and positive( Reference Berteus Forslund, Lindroos and Sjostrom 14 – Reference Murakami and Livingstone 20 ) associations. The associations between EF and food and nutrient intakes are equally inconclusive( Reference Titan, Bingham and Welch 2 , Reference Holmback, Ericson and Gullberg 6 , Reference Smith, Blizzard and McNaughton 7 , Reference Berteus Forslund, Torgerson and Sjostrom 15 , Reference Zizza, Arsiwalla and Ellison 21 – Reference Leech, Worsley and Timperio 23 ). This is an issue that is beset by substantial methodological problems. First, while the assessment of EF has often relied on a series of non-validated, self-report questions( Reference Titan, Bingham and Welch 2 , Reference Marin-Guerrero, Gutierrez-Fisac and Guallar-Castillon 5 – Reference Smith, Blizzard and McNaughton 7 , Reference Berg, Lappas and Wolk 11 , Reference Berteus Forslund, Lindroos and Sjostrom 14 , Reference Berteus Forslund, Torgerson and Sjostrom 15 , Reference van der Heijden, Hu and Rimm 18 , Reference Howarth, Huang and Roberts 19 ), only a few studies have directly assessed EF on the basis of actual dietary habits (using a dietary record or 24 h recall)( Reference Drummond, Crombie and Cursiter 1 , Reference Ma, Bertone and Stanek 4 , Reference Summerbell, Moody and Shanks 9 , Reference Duval, Strychar and Cyr 10 , Reference Murakami and Livingstone 20 ). Second, the association of EF with adiposity measures (as well as dietary intake) may be confounded by possible under-reporting of EF concomitant with the under-reporting of energy intake (EI) by obese or overweight subjects( Reference Zizza, Arsiwalla and Ellison 21 , Reference Zizza and Xu 22 ). In fact, a very limited number of studies( Reference Huang, Roberts and Howarth 16 , Reference Yannakoulia, Melistas and Solomou 17 , Reference Howarth, Huang and Roberts 19 , Reference Murakami and Livingstone 20 ), but not all( Reference Drummond, Crombie and Cursiter 1 , Reference Ruidavets, Bongard and Bataille 3 , Reference Holmback, Ericson and Gullberg 6 , Reference Duval, Strychar and Cyr 10 , Reference Hartline-Grafton, Rose and Johnson 12 , Reference Mills, Perry and Reicks 13 ), suggest that EF is positively, rather than inversely, associated with adiposity measures after accounting for EI reporting bias. Third, interpreting the literature on EF is complicated by the fact that there is no consensus about what constitutes a snack, a meal or an eating occasion. While some researchers have relied on respondents’ self-identification of meals, snacks or eating occasions( Reference Titan, Bingham and Welch 2 , Reference Marin-Guerrero, Gutierrez-Fisac and Guallar-Castillon 5 – Reference Smith, Blizzard and McNaughton 7 , Reference Berg, Lappas and Wolk 11 – Reference Berteus Forslund, Torgerson and Sjostrom 15 , Reference van der Heijden, Hu and Rimm 18 ), others have attempted to use more objective criteria( Reference Drummond, Crombie and Cursiter 1 , Reference Ruidavets, Bongard and Bataille 3 , Reference Ma, Bertone and Stanek 4 , Reference Kant, Schatzkin and Graubard 8 – Reference Duval, Strychar and Cyr 10 , Reference Huang, Roberts and Howarth 16 , Reference Yannakoulia, Melistas and Solomou 17 , Reference Howarth, Huang and Roberts 19 , Reference Murakami and Livingstone 20 ). As a consequence of these methodological limitations, the discrepant findings are not surprising, and severely impede clarification of the impact of EF on diet quality and adiposity status.
More importantly, potentially different effects of meal frequency (MF) and snack frequency (SF) have not been investigated simultaneously using different definitions of meals and snacks. An accurate distinction between meals and snacks is important, because they are hypothesized to have opposite effects on energy balance. A high MF may prevent fat mass deposition, while snacking may contribute to it( Reference Chapelot 24 ). This is also important for the development of science-based recommendations (of snacking) for consumers( Reference Johnson and Anderson 25 ). Moreover, in the absence of a universally accepted definition of meals and snacks, an understanding of the influence of different meal and snack definitions on the associations with diet quality and adiposity may facilitate the interpretation of the existing literature and help establish consensus on the most appropriate research definition for meals and snacks( Reference Leech, Worsley and Timperio 23 ).
The aim of the present cross-sectional study in British adults was to examine the relationship of MF and SF with food and nutrient intakes, diet quality, BMI and waist circumference (WC), by focusing on the confounding of EI misreporting and the use of different definitions of meals and snacks.
Methods
Survey design
The current cross-sectional study was based on the National Diet and Nutrition Survey (NDNS): Adults Aged 19 to 64 Years. Details of the rationale, design and methods of the survey have been described elsewhere( 26 ). Briefly, the sample was randomly selected from 152 randomly selected postal sectors within mainland Great Britain. Eligibility was defined as being aged 19–64 years and not pregnant or breast-feeding. One eligible adult per private household was selected at random. Data collection was conducted from July 2000 to June 2001.
Anthropometric measurements
All anthropometric measurements were performed in duplicate by trained fieldworkers and the mean value of two measurements was used in the analysis. Height (to the nearest 0·1 cm) and weight (to the nearest 0·1 kg) were measured while participants were barefoot and wearing light clothes only. BMI (kg/m2) was calculated as weight (in kilograms) divided by height (in metres) squared. WC was measured at the midpoint between the iliac crest and the lower rib (to the nearest 0·1 cm).
Dietary assessment
Dietary data were collected by a 7 d weighed dietary record. A detailed description of the procedure has been published elsewhere( 26 , Reference Murakami, McCaffrey and Livingstone 27 ). Briefly, each participant was supplied with a set of digital food scales and recording diaries. The participant was given by trained interviewers both written and verbal instructions on how to weigh and record items in the diary. When weighing was not possible (e.g. eating out; 47 % of total food items recorded), the participant was asked to record as much information as possible. Trained interviewers visited the household at least twice during the recording period and checked the completeness of food recording. All the collected diaries were checked by trained nutritionists in terms of coding, recorded weights and descriptions of items consumed. Estimates of daily intakes of foods, energy and selected nutrients were calculated based on the Food Standards Agency nutrient databank( Reference Smithers 28 ), which is based on McCance & Widdowson’s The Composition of Foods series( 29 ) and manufacturers’ data where applicable. For all dietary variables, mean daily values over 7 d were used in the analysis. Values of food and nutrient intakes were energy-adjusted using the density method (i.e. percentage of energy for energy-providing nutrients and amount per 10 MJ of energy for foods and other nutrients).
As measures of diet quality, the Healthy Diet Indicator (HDI) and the Mediterranean Diet Score (MDS) were calculated (see online supplementary material, Supplemental Table 1). The HDI includes six nutrients and one food group (saturated fat, polyunsaturated fat, cholesterol, protein, dietary fibre, fruits and vegetables, and non-milk extrinsic sugars)( Reference Huijbregts, Feskens and Rasanen 30 , Reference Struijk, Beulens and May 31 ). When intake was within the recommended range according to WHO guidelines, a score of 1 was assigned to that component; otherwise, a score of 0 was assigned, with a total score ranging from 0 to 7. Hence, a higher score reflected a healthier dietary pattern. The MDS represents a Mediterranean-type diet and is based on the consumption of nine different components (vegetables; legumes; fruits, nuts and seeds; cereals; fish; ratio of unsaturated to saturated fats; meat; dairy products; and alcohol)( Reference Struijk, Beulens and May 31 , Reference Trichopoulou, Orfanos and Norat 32 ). A score of 1 was assigned to moderate alcohol intake or, depending on the component, intake above or below the sex-specific median. Scores for all nine components were summed and resulted in a total range from 0 to 9, whereby a higher score reflected better adherence to a Mediterranean-type diet.
Table 1 Characteristics of participants; British adults aged 19–64 years (n 1487), National Diet and Nutrition Survey, 2000–2001
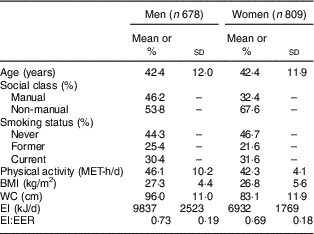
MET, metabolic equivalent of task; WC, waist circumference; EI, energy intake; EER, estimated energy requirement.
Definition of eating frequency, meal frequency and snack frequency
Data from the 7 d dietary record were also used to calculate the average number of eating occasions per day; that is, EF. Eating occasions were defined as any occasion when any food or drink was consumed( Reference Hartline-Grafton, Rose and Johnson 12 , Reference Mills, Perry and Reicks 13 , Reference Yannakoulia, Melistas and Solomou 17 , Reference Murakami and Livingstone 20 ). If two eating occasions occurred in ≤15 min, both events were counted as a single eating occasion; when >15 min separated two eating occasions, these were considered distinct eating occasions( Reference Drummond, Crombie and Cursiter 1 , Reference Ma, Bertone and Stanek 4 , Reference Duval, Strychar and Cyr 10 , Reference Yannakoulia, Melistas and Solomou 17 , Reference Murakami and Livingstone 20 ). EF was calculated based on all eating occasions except for those providing <210 kJ of energy. This calculation method has been used in several previous studies( Reference Ma, Bertone and Stanek 4 , Reference Hartline-Grafton, Rose and Johnson 12 , Reference Mills, Perry and Reicks 13 , Reference Yannakoulia, Melistas and Solomou 17 , Reference Murakami and Livingstone 20 ) and was chosen to avoid giving undue weight to eating occasions that only included water, low-calorie beverages or small quantities of foods. In the present study, the mean contribution of eating occasions providing <210 kJ to total EI was 2·0 (sd 2·2) % in men and 3·1 (sd 3·0) % in women.
All eating occasions were divided into either meals or snacks with the use of two different published definitions: on the basis of (i) contribution to total EI( Reference Ritchie 33 ) and (ii) clock time( Reference Duffey, Pereira and Popkin 34 ). For the first definition( Reference Ritchie 33 ), a meal was defined as any eating episode comprising ≥15 % of total EI, regardless of the time of day or composition of foods or beverages consumed. All other eating episodes were classified as a snack. For each participant, MF and SF determined based on energy contribution were calculated (hereafter referred to as MFenergy% and SFenergy%, respectively). For the second definition( Reference Duffey, Pereira and Popkin 34 ), meals were defined as eating events reported during selected times of the day; that is, 06.00–10.00, 12.00–15.00 and 18.00–21.00 hours. All other eating occasions were considered snacks. For each participant, MF and SF determined based on time were calculated (hereafter referred to as MFtime and SFtime, respectively). It should be noted that no self-definition of eating occasions was included in the NDNS dietary record.
Assessment of non-dietary variables
The socio-economic status of each participant (i.e. occupational social class) was self-reported and categorized as manual or non-manual. Smoking status (never, former or current) was also self-reported. A 7 d physical activity diary was carried out concurrently with the dietary record. A detailed description of the procedure has been published elsewhere( 26 , Reference Murakami, McCaffrey and Livingstone 27 ). Briefly, the participant was shown by trained interviewers how to record the information and was asked to record, to the nearest 10 min, how long they spent doing various activities on that day. Trained interviewers checked the completeness of records at least twice during the recording period. Subsequently, time spent daily in sleep, light-, moderate- and vigorous-intensity activities was computed for each day of recording. The number of hours spent per day on each activity was multiplied by the metabolic equivalent of task (MET) value of that activity (derived from a published table)( Reference Ainsworth, Haskell and Herrmann 35 ) and all MET-h products were summed to produce a total MET-h score for the day. A mean daily value over 7 d was used in the analysis. We calculated each participant’s estimated energy requirement (EER) with the use of equations published from the US Dietary Reference Intakes( 36 ). Physical activity category was determined for each participant based on the physical activity level calculated as total MET-h/d (from the 7 d physical activity diary) divided by 24. As a measure of dietary misreporting, the ratio EI:EER was then calculated. Participants were identified as acceptable reporters, under-reporters or over-reporters of EI based on their EI:EER, according to whether the individual’s ratio was within, below or above the 95 % confidence limits of the expected ratio of 1·0. Based on a published equation( Reference Huang, Roberts and Howarth 16 ), acceptable reporters were defined as having EI:EER in the range 0·665 to 1·335, under-reporters as EI:EER<0·665 and over-reporters as EI:EER >1·335. A detailed description of the procedure has been published elsewhere( Reference Murakami and Livingstone 20 , Reference Murakami, McCaffrey and Livingstone 27 ).
Analytic sample
Of 3704 potentially eligible individuals identified for the study, 2251 (61 % of eligible sample) participated in the survey. For the present analysis, we excluded a total of 736 individuals with missing information on the variables used. We further excluded twenty-eight underweight individuals (BMI<18·5 kg/m2)( 37 ). The final analysis sample comprised 1487 adults aged 19–64 years (678 men and 809 women; 40 % of the eligible sample). Further exclusion of individuals who reported dieting or that illness had affected their eating during the diet recording period (n 397) did not alter the findings of the present study (data not shown); therefore, these participants were included in the analysis.
Statistical analysis
All statistical analyses were performed for men and women separately, using the statistical software package SAS version 9·2. Associations between various measures of MF and SF as well as those of MF and SF with EI:EER and EI were investigated through Pearson correlation analyses. Associations of MF and SF with food and nutrient intakes and measures of diet quality were investigated by linear regression analyses using the PROC REG procedure, with adjustment for age, social class and EI:EER. Linear regression analyses were also performed to explore the associations of MF and SF with BMI and WC. With the use of the PROC REG procedure, we calculated the crude (i.e. model 1) and adjusted (i.e. models 2 and 3) regression coefficients (with se) of variation of BMI and WC by one increase of MF and SF. Potential confounding factors included in the multivariate models (model 2) were age, social class, smoking status, physical activity, and intakes of protein, fat, total sugar, alcohol and dietary fibre. We further included EI:EER as a potential confounding factor (model 3). We decided to adjust for EI:EER in multivariate models, rather than excluding EI under-reporters and over-reporters from the analysis, because the differences in basic characteristics between under-reporters and acceptable reporters observed in the present population( Reference Murakami and Livingstone 20 , Reference Murakami, McCaffrey and Livingstone 27 ) suggested that data exclusion may actually introduce a selection bias. This approach has been used in several previous studies( Reference Jennings, Cassidy and van Sluijs 38 – Reference Kelly, Rennie and Wallace 41 ). MF and SF were analysed continuously after confirming the linearity of relationships using tertile, quartile and quintile categories.
Data have not been weighted to take into account known sociodemographic differences between responders and non-responders, not only because the impact of this adjustment, applied as a weighting factor, for nutritional variables was extremely small and not significant( 26 ) but also because we were only interested in relationships between variables, rather than estimates of prevalence( Reference Murakami and Livingstone 20 , Reference Murakami, McCaffrey and Livingstone 27 ). All reported P values are two-tailed and P values of <0·05 were considered statistically significant.
Results
The mean values of BMI and WC were, respectively, 27·3 kg/m2 and 96·0 cm in men and 26·8 kg/m2 and 83·1 cm in women (Table 1). The percentage of acceptable reporters and under-reporters of EI were 63 % and 37 % in men and 55 % and 45 % in women, respectively (only three men (0·4 %) were classified as over-reporters). In both men and women, compared with acceptable reporters, under-reporters had a lower mean value of age and EI and a higher mean value of physical activity, BMI and WC (data not shown). They were also more likely to be employed in manual occupations and be current smokers (data not shown).
The mean value of MFenergy% was significantly (P<0·0001) lower than that of MFtime in both men (2·29 v. 3·64 times/d) and women (2·28 v. 3·28 times/d; Table 2). While there was no correlation between MFenergy% and MFtime in men, MFenergy% was weakly correlated with MFtime in women. The mean value of SFenergy% was significantly (P<0·0001) higher than that of SFtime in both men (3·32 v. 1·97 times/d) and women (2·56 v. 1·57 times/d). There were strong correlations between both measures of SF in both men and women. While MFenergy% showed an inverse association with EF in men and no association with EF in women, there were strong correlations of MFtime, SFenergy% and SFtime with EF in both sexes. All measures of MF and SF were significantly positively correlated with both EI:EER and EI in both men and women (Table 3).
Table 2 Descriptive statistics of meal frequency, snack frequency and eating frequency; British adults aged 19–64 years (n 1487), National Diet and Nutrition Survey, 2000–2001

MFenergy%, meal frequency (MF) determined based on percentage contribution to total EI; SFenergy%, snack frequency (SF) determined based on percentage contribution to total EI; MFtime, MF determined based on the time consumed; SFtime, SF determined based on the time consumed; EF, eating frequency; EI, energy intake.
* A meal was defined as any eating episode comprising ≥15 % of total EI, regardless of the time of day or composition of foods and beverages consumed; all other eating episodes were classified as a snack.
† Meals were defined as eating events reported during selected times of the day (06.00–10.00, 12.00–15.00 and 18.00–21.00 hours); all other eating occasions were considered snacks.
Table 3 Correlation of meal frequency and snack frequency with EI:EER and EI; British adults aged 19–64 years (n 1487), National Diet and Nutrition Survey, 2000–2001
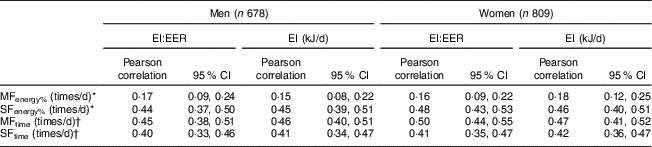
EI, energy intake; EER, estimated energy requirement; MFenergy%, meal frequency (MF) determined based on percentage contribution to total EI; MFtime, MF determined based on the time consumed; SFenergy%, snack frequency (SF) determined based on percentage contribution to total EI; SFtime, SF determined based on the time consumed.
* A meal was defined as any eating episode comprising ≥15 % of total EI, regardless of the time of day or composition of foods and beverages consumed; all other eating episodes were classified as a snack.
† Meals were defined as eating events reported during selected times of the day (06.00–10.00, 12.00–15.00 and 18.00–21.00 hours); all other eating occasions were considered snacks.
Tables 4 and 5 show the associations of MF and SF with dietary characteristics in men and women, respectively. Generally speaking, the associations for MF varied depending on the definition of meals and sex. MFenergy% showed positive associations with cereals, vegetables (only women), fruits (only men), starch and dietary fibre, and inverse associations with alcoholic beverages, meat (only men), confectionery (only men) and non-milk extrinsic sugars. However, MFtime was associated positively with dairy products, confectionery, alcoholic beverages, vegetables (only women), fruits (only women), soft drinks (only women) and non-milk extrinsic sugars, and inversely with cereals, legumes (only men), fish (only men), meat (only women), total, saturated, monounsaturated and polyunsaturated fats, and starch. Dietary fibre was inversely associated with MFtime in men but showed a positive association in women. For measures of diet quality, MFenergy% was positively associated with MDS in both sexes and with HDI in only men, while MFtime showed positive associations with both MDS and HDI in only women. In contrast, both SFenergy% and SFtime were generally associated with unfavourable dietary intake patterns in both sexes, including higher intakes of confectionery, alcoholic beverages, soft drinks (only women) and non-milk extrinsic sugars, and lower intakes of cereals, fish (except for SFenergy% in women), vegetables (except for SFenergy% in women), protein, monounsaturated and polyunsaturated fats, starch and dietary fibre. There were also inverse associations between SFenergy% and SFtime and measures of diet quality in both sexes, except for no association between SFenergy% and HDI in women.
Table 4 Associations of meal frequency and snack frequency with dietary characteristicsFootnote *; British men aged 19–64 years (n 678), National Diet and Nutrition Survey, 2000–2001

MFenergy%, meal frequency (MF) determined based on percentage contribution to total EI; SFenergy%, snack frequency (SF) determined based on percentage contribution to total EI; MFtime, MF determined based on the time consumed; SFtime, SF determined based on the time consumed; EI, energy intake; EER, estimated energy requirement.
* Adjustment was made for age (years, continuous), social class (manual or non-manual) and EI:EER (continuous). Statistically significant P values are presented in bold.
† A meal was defined as any eating episode comprising ≥15 % of total EI, regardless of the time of day or composition of foods and beverages consumed; all other eating episodes were classified as a snack.
‡ Meals were defined as eating events reported during selected times of the day (06.00–10.00, 12.00–15.00 and 18.00–21.00 hours); all other eating occasions were considered snacks.
§ Regression coefficients mean the change of dietary variables with one additional eating occasion per day.
|| Possible score ranging from 0 to 7.
¶ Possible score ranging from 0 to 9.
Table 5 Associations of meal frequency and snack frequency with dietary characteristicsFootnote *; British women aged 19–64 years (n 809), National Diet and Nutrition Survey, 2000–2001

MFenergy%, meal frequency (MF) determined based on percentage contribution to total EI; SFenergy%, snack frequency (SF) determined based on percentage contribution to total EI; MFtime, MF determined based on the time consumed; SFtime, SF determined based on the time consumed; EI, energy intake; EER, estimated energy requirement.
* Adjustment was made for age (years, continuous), social class (manual or non-manual) and EI:EER (continuous). Statistically significant P values are presented in bold.
† A meal was defined as any eating episode comprising ≥15 % of total EI, regardless of the time of day or composition of foods and beverages consumed; all other eating episodes were classified as a snack.
‡ Meals were defined as eating events reported during selected times of the day (06.00–10.00, 12.00–15.00 and 18.00–21.00 hours); all other eating occasions were considered snacks.
§ Regression coefficients mean the change of dietary variables with one additional eating occasion per day.
|| Possible score ranging from 0 to 7.
¶ Possible score ranging from 0 to 9.
The associations of MF and SF with adiposity measures are presented in Table 6. In the univariate analyses (model 1), all measures of MF and SF showed inverse or null associations with BMI and WC in both men and women. Adjustment for age, social class, smoking status, physical activity and intakes of protein, fat, total sugar, alcohol and dietary fibre (model 2) revealed no associations for all measures of MF and SF, except for inverse associations for MFtime in women. Further adjustment for EI:EER (model 3) resulted in positive associations of SFenergy% and SFtime with BMI and WC in both men and women. MFtime was also positively associated with BMI and WC in men only, while MFenergy% showed no associations in both sexes.
Table 6 Associations of meal frequency and snack frequency with adiposity measuresFootnote *; British adults aged 19–64 years (n 1487), National Diet and Nutrition Survey, 2000–2001

MFenergy%, meal frequency (MF) determined based on percentage contribution to total EI; WC, waist circumference; MFtime, MF determined based on the time consumed; SFenergy%, snack frequency (SF) determined based on percentage contribution to total EI; SFtime, SF determined based on the time consumed; EI, energy intake; MET, metabolic equivalents of task; ERR, estimated energy requirement.
* Statistically significant P values are presented in bold.
† Crude model.
‡ Adjusted for age (years, continuous), social class (manual or non-manual), smoking status (never, former, or current), physical activity (MET-h/d, continuous), protein intake (% of energy, continuous), fat intake (% of energy, continuous), total sugar intake (% of energy, continuous), alcohol intake (% of energy, continuous) and dietary fibre intake (g/10 MJ, continuous).
§ Adjusted for variables used in model 2 and EI:EER (continuous).
|| Regression coefficients mean the change of adiposity measures with one additional eating occasion per day.
¶ A meal was defined as any eating episode comprising ≥15 % of total EI, regardless of the time of day or composition of foods and beverages consumed; all other eating episodes were classified as a snack.
** Meals were defined as eating events reported during selected times of the day (06.00–10.00, 12.00–15.00 and 18.00–21.00 hours); all other eating occasions were considered snacks.
Discussion
To our knowledge, the present study is the first to examine associations of different measures of MF and SF with dietary intakes and adiposity indices, after taking into account the confounding of energy misreporting. MFenergy% was associated with favourable dietary intake patterns in both sexes, while MFtime showed positive associations with measures of diet quality in women only. In contrast, SFenergy% and SFtime were generally associated with unfavourable dietary intake patterns in both sexes. For adiposity measures, in the multivariate analyses without taking into account EI:EER, all measures of MF and SF showed null associations with BMI and WC in both sexes, with the exception of inverse associations for MFtime in women. However, after full adjustment including EI:EER, we found positive associations of SFenergy% and SFtime with BMI and WC in both sexes. MFtime was also positively associated with BMI and WC in men. Thus in these analyses, adjustment for EI:EER had a greater impact on the outcomes obtained than did the method of defining meals and snacks. In any case, the present results suggest the different effects of MF and SF on dietary intakes and adiposity measures.
While many epidemiological studies investigating the association between EF (i.e. sum of MF and SF) and dietary intakes and adiposity measures have yielded inconsistent outcomes( Reference Titan, Bingham and Welch 2 , Reference Holmback, Ericson and Gullberg 6 , Reference Smith, Blizzard and McNaughton 7 , Reference Berteus Forslund, Torgerson and Sjostrom 15 , Reference Zizza, Arsiwalla and Ellison 21 – Reference Leech, Worsley and Timperio 23 ), there have been few attempts to investigate the effects of MF and SF separately. For dietary intakes, SF calculated based on self-report was associated with higher intakes of vitamins A, C and E, β-carotene, Mg and K in US elderly people( Reference Zizza, Arsiwalla and Ellison 21 ). SF calculated based on self-report was also associated with a higher score for the Healthy Eating Index in US adults( Reference Zizza and Xu 22 ). Conversely, in Swedish adults, SF assessed by a questionnaire showed positive associations with intakes of confectionery, fat, sugar and alcohol, and inverse associations with intakes of protein and dietary fibre( Reference Berteus Forslund, Torgerson and Sjostrom 15 ). This is consistent with our observation in British adults that SFenergy% and SFtime were associated with unfavourable dietary intake patterns, including higher intakes of soft drinks, confectionery and alcohol, lower intakes of cereals, protein, fat, and dietary fibre, and lower scores of HDI (except for SFenergy% in women) and MDS. These discrepant findings may be, at least partly, explained by differences in the characteristics and lifestyles of the populations, definitions of SF, dietary assessment methods and potential confounding factors considered. While we are unaware of previous studies where the association between MF and dietary intake was examined, we found that in both sexes MFenergy% was associated with favourable dietary intake patterns, including higher intakes of vegetables, fruits and dietary fibre, lower intakes of non-milk extrinsic sugars and alcohol, and higher scores of HDI (only men) and MDS, while MFtime was associated with higher scores of HDI and MDS in women only. These results highlight how the use of different definitions of meals and snacks can impact the outcomes. For adiposity measures, a cross-sectional study in US adults( Reference Howarth, Huang and Roberts 19 ) has shown that after excluding implausible energy reporters, SF, but not MF, as defined mainly based on self-report and energy content, was positively associated with BMI. Despite the use of different definitions of meals and snacks, this is generally consistent with our observation that SFenergy%, SFtime and MFtime (men only), but not MFenergy%, was associated with higher BMI and WC. This seems plausible given the modest positive association of SFenergy%, SFtime and MFtime with EI. On the other hand, MFenergy% was only weakly (but significantly) associated with EI, showing no association with BMI and WC. In any case, the positive association of MF and SF with EI suggests that participants in the present study did not compensate for more frequent eating episodes by reducing the quantity of energy consumed per eating occasion.
In the present study, (the direction of) the association of MF and SF with BMI and WC changed radically after adjustment for EI:EER. Given the positive association of MF and SF with EI:EER and the inverse association of BMI and WC with EI:EER, this may be due to the under-reporting of MF and SF concomitant with the under-reporting of EI by individuals with higher BMI and WC( Reference Murakami and Livingstone 20 ). Thus, the present study highlights the key importance of adjusting for EI misreporting in studies of MF and SF in relation to adiposity measures.
The strengths of our study include the use of objective and published definitions of MF and SF based on detailed dietary information obtained from a 7 d weighed dietary record, measured anthropometric data and the use of an individualized measure of EER to identify EI misreporters. However, there are also several limitations. First, the cross-sectional nature of the study does not permit the assessment of causality owing to the uncertain temporality of the association. Many health organizations, diet books and Internet sites recommend eating small, frequent meals for weight loss. Because of this, overweight and obese individuals may increase their MF, although it is unlikely in the present study that they eat small meals given the positive correlation between MF and EI observed. Alternatively, overweight and obese individuals may simply have reduced their MF and SF in an attempt to lose weight. If so the strength of the positive association between MF and SF and adiposity measures would be underestimated. In any case, only a prospective study taking into account dietary misreporting would provide better understanding of the relationship between MF and SF and adiposity measures.
At present, the only way to obtain unbiased information on energy requirements in free-living settings is to use doubly labelled water as a biomarker( Reference Livingstone and Black 42 ). This technique is expensive and impractical for application to large-scale epidemiological studies. Instead, we calculated EER with the use of published equations( 36 ). In the absence of measured total energy expenditure, these equations with high R 2 values (0·82 for men and 0·79 for women)( 36 ) should serve as the best proxy, although the selection of physical activity category was based on self-report (i.e. 7 d physical activity diary), which may be susceptible to reporting bias.
Another limitation of the present study is the relatively low response rate (61 %), and only 40 % of the eligible sample was included in the present study. The participants included in the present analysis (n 1487) differed somewhat from those excluded from the analysis (n 705–758 depending on variables). Those excluded were more likely to be younger, be in manual occupations and be current smokers (all P<0·05). However, a previous analysis concluded that there was no evidence to suggest serious non-response bias in NDNS( 26 ). Further, although we adjusted for a variety of potential confounding variables, residual confounding could not be ruled out.
Finally, because only EF of meals contributing ≥15 % of total EI (i.e. MFenergy%) showed null associations with BMI and WC (as well as positive associations of MFtime, SFenergy% and SFtime with BMI and WC), the present findings should not be interpreted as conclusive evidence that eating less frequently (e.g. one or two large meals per day) is an effective way to prevent obesity but that higher SF or EF of additional small meals may be a contributing factor to obesity. Nevertheless, oversimplification should be avoided because there is no consensus about what constitutes a snack or a meal. As mentioned above, we could not conduct the present analysis based on self-identification of eating occasions, the most common definition of meals and snacks, because of a lack of information in NDNS. Additionally, MF and SF based on time may be problematic, because eating patterns vary according to lifestyle (e.g. shift workers, individuals who consistently eat their meals at non-traditional times of day) as well as the cultural environment( Reference Johnson and Anderson 25 ). Furthermore, MF and SF based on energy contribution (≥15 % or <15 %) was made on the basis of the US national averages of the distribution of energy from (self-defined) meals compared with (self-defined) snacks (breakfast, ≈16 %; lunch, ≈25 %; dinner, ≈37 %; snacks, ≈22 % from two occasions)( Reference Kant and Graubard 43 ), but this may not be suitable in the present British population. Thus, results may possibly differ on the basis of other definitions. In any case, as research explicitly examining the impact of these different definitions is limited, further research using different definitions of meals and snacks is warranted.
Conclusion
In the current cross-sectional study in British adults, after taking into account the confounding of EI misreporting, MFenergy% was associated with favourable dietary intake patterns in both sexes, while MFtime showed positive associations with measures of diet quality in women only. Conversely, SFenergy% and SFtime were generally associated with unfavourable dietary intake patterns in both sexes. For adiposity measures, we found positive associations of SFenergy% and SFtime with BMI and WC in both sexes, which was not observed when EI:EER was not entered in the model. MFtime was also positively associated with BMI and WC in men. The present results thus suggest the different effects of MF and SF on dietary intake and adiposity measures, as well as the importance of adjustment for EI:EER. Further research, particularly with a prospective design, is needed, taking into account dietary misreporting so that firm conclusions can be drawn with regard to the effect of MF and SF on dietary intakes and adiposity measures.
Acknowledgements
Financial support: This work was supported in part by the Grants-in-Aid for Young Scientists (B) from the Ministry of Education, Culture, Sports, Science and Technology of Japan (K.M., grant number 15K16213). The Ministry of Education, Culture, Sports, Science and Technology of Japan had no role in the design, analysis or writing of this article. Conflict of interest: None. Authorship: K.M. contributed to the concept and design of the study, statistical analysis, data interpretation and manuscript writing. M.B.E.L. critically reviewed the manuscript. Both authors read and approved the final manuscript. Ethics of human subject participation: This study was conducted according to the guidelines laid down in the Declaration of Helsinki and all procedures involving human subjects were approved by the National Health Service Local Research Ethics Committee covering each of the postal sectors. Written informed consent was obtained from all participants.
Supplementary Material
To view supplementary material for this article, please visit http://dx.doi.org/10.1017/S1368980015002979


