


The worldwide prevalence of childhood overweight and obesity has increased in recent decades(Reference Wang and Lobstein1, Reference de Onis, Blössner and Borghi2). As a result, CVD risk factors such as lipid disorders, insulin resistance and diabetes are increasingly being diagnosed in children(Reference Daniels, Arnett and Eckel3).
Anthropometric references play an important role in identifying children who are overweight or obese, or at risk of becoming so. In 2007, the WHO released growth reference data for school-aged children and adolescents aged 5–19 years (hereafter referred to as ‘the WHO reference’)(Reference de Onis, Onyango and Borghi4). The new WHO reference is based on a reconstruction of the US National Center for Health Statistics 1977 reference curves using the original sample (a non-obese sample with expected heights), supplemented with data from the pre-school WHO Child Growth Standards(Reference de Onis, Onyango and Borghi4). The resulting WHO curves, recommended for both clinical and epidemiological use, are widely used by country programmes and researchers around the world to define childhood overweight and obesity(Reference de Onis and Lobstein5, Reference Rolland-Cachera6).
The WHO reference BMI-for-age curves at 19 years closely coincide with adult overweight (BMI = 25·0 kg/m2) at +1 sd and adult obesity (BMI = 30·0 kg/m2) at +2 sd. These standard deviation classifications have been extended to 5 years to define the cut-off thresholds for overweight and obesity in children aged 5–19 years(Reference de Onis and Lobstein5). The objective of the present study was to assess the association between several CVD risk factors and BMI status using the WHO cut-offs to define overweight and obesity. Assessing these associations will help determine if the WHO cut-offs that are being broadly used are clinically and biologically meaningful and, thus, useful in identifying individual children and populations in need of CVD-prevention strategies.
Methods
Study design and participants
A prospective study was conducted among 149 schoolchildren and adolescents aged 8–18 years (ninety-nine boys and fifty girls) attending primary paediatric care centres in Valencia, Spain. Ninety-four participants were randomly selected from a sample of children referred from the primary centres to the Pediatric Gastroenterology and Nutrition Unit of the Hospital Clínico Universitario because of overweight and obesity for follow-up. Additionally, fifty-five normal-weight children from the same primary care centres, referred for a functional heart murmur study, were also randomly selected. Children with dysmorphic syndromes and/or endocrinological disorders were excluded. Informed consent from the parent/guardian was obtained in all cases. The study protocol was approved by the Hospital Clínico Universitario of Valencia Committee on Ethical Practice.
Clinical assessment
Each child's weight and height were collected using a standardized technique(Reference Lohman, Roche and Martorell7) and BMI-for-age Z-scores calculated based on the WHO reference(Reference de Onis, Onyango and Borghi4). Children with BMI Z-score between ≥−2 and ≤+1 were classified as normal weight; those with Z-score between >+1 and ≤+2 (equivalent to BMI = 25·0 kg/m2 at 19 years) were considered overweight; and those with Z-score >+2 (equivalent to BMI = 30·0 kg/m2 at 19 years) as obese(Reference de Onis, Onyango and Borghi4, Reference de Onis and Lobstein5).
Blood pressure was measured in all children by the same researcher using the same device (Dinamap® oscillometric method). High values were checked with the auscultatory method and mercury sphygmomanometer. The sleeve size was adjusted to fit arm diameter, and measurements were performed on the right arm at heart level while children sat comfortably. Systolic blood pressure (SBP) and diastolic blood pressure (DBP) were measured on the right arm after a 10 min rest. Three measurements were taken for each child and the average of the three was calculated. Hypertension was defined as average SBP and/or DBP ≥95th percentile for age, sex and height(8).
Biochemical analysis of plasma
In a fasting state, total cholesterol, HDL-cholesterol (HDL-C), LDL-cholesterol (LDL-C), TAG, glucose and uric acid were measured applying enzymatic assays using an automated analyser (Olympus AU5400; Olympus Diagnostics, Nyon, Switzerland). Additionally, insulin was determined by electrochemiluminescence with a modular autoanalyser (Cobas 8000, e602 module; Roche Diagnostics, Basel, Switzerland). The homeostasis model assessment–insulin resistance (HOMA-IR) was calculated as the product of the fasting plasma insulin level (mU/l) and the fasting plasma glucose level (mmol/l), divided by 22·5.
High LDL-C was defined as ≥130 mg/dl(9); low HDL-C as ≤40 mg/dl(Reference Cook, Weitzman and Auinger10); high TAG as ≥110 mg/dl(Reference Cook, Weitzman and Auinger10); high glucose as ≥110 mg/dl(Reference Cook, Weitzman and Auinger10); high insulin as >15 mU/l(Reference Skelton and Rudolph11); and high uric acid as ≥6·7 mg/dl for boys and ≥6·0 mg/dl for girls(Reference Collard12). Because HOMA-IR cut-off points for diagnosis of insulin resistance have not been defined for children and adolescents, values ≥3·6 (≥+1·65 sd or 95th percentile of our control group(Reference Martínez Costa, Núñez Gómez and Montal Navarro13)) were considered as high. Hypertension, low HDL-C, high TAG, high glucose and high insulin were included in analysing the clustering of metabolic risk factors(Reference Bokor, Frelut and Vania14).
Statistical methods
Univariate descriptive statistics were presented as means and standard deviations. The use of Quantile–Quantile plots and Kolmogorov–Smirnov goodness-of-fit tests indicated no significant evidence for deviation from normal distribution for all variables; thus the medians were not reported and all tests carried out were parametric.
To examine associations of metabolic and vascular comorbidities with childhood overweight and obesity, comorbidity variables were compared between the three groups (normal weight, overweight and obesity). Since BMI groups are ordinal variables, the one-way ANOVA procedure with a test of linearity was used for testing the hypothesis that the three means were equal. When there was evidence of differences in means between groups, post hoc multiple comparisons were performed using the Tukey test for the three pairwise comparisons to determine which means differed. To account for a potential confounding role of sex and age in these associations, multivariate analysis, namely general linear model (GLM), was used for the adjustment with each comorbidity variable as the dependent variable and the BMI group as the independent factor controlling simultaneously for age and sex. Only the main effects were evaluated because there were no significant interaction terms. Hosmer–Lemeshow goodness-of-fit tests were used to assess the adequacy of each of these models, i.e. whether they adequately accounted for the relationship between the response variable (each comorbidity variable) and the predictors.
To determine whether high values for comorbidities (or low values for HDL-C) were associated with BMI groups, crude odds ratios (cOR) were calculated for each comorbidity variable. A Mantel–Haenszel χ 2 test for trend was used to determine whether there were trends in proportions when moving from normal weight, to overweight, to obese. Multivariate binary logistic regression was used to compute the adjusted odds ratios (aOR) and their 95 % confidence intervals, controlling for sex and age.
The statistical software packages SPSS version 19·0 and R version 2·10·1 were used for the analyses. P values ≤ 0·05 were considered statistically significant.
Results
Table 1 presents the sample's clinical and biological characteristics. Of the 149 (ninety-nine boys and fifty girls) school-aged children and adolescents, fifty-five (37 %) were classified as having normal weight, thirty-three (22 %) as overweight and sixty-one (41 %) as obese. Age ranged from 8 to 18 years, with no significant mean differences between BMI groups. There were statistically significant linear mean differences between BMI groups in weight, height-for-age Z-score, SBP, HDL-C, TAG, insulin, HOMA-IR and uric acid. With the exception of HDL-C (which, as expected, showed a decreasing trend), LDL-C (non-significant increasing trend) and glucose, there were statistically significant increasing trends for the mean differences of all the biochemical variables across BMI groups, i.e. overweight children had higher values compared with the normal-weight group, and similarly obese children had higher values compared with overweight children (except HDL-C with the reverse). The significant differences in means were all driven by the mean difference between normal weight and obesity and, for some variables (HDL-C, insulin and HOMA-IR), the mean difference between overweight and obesity. Only for HDL-C was the overall difference explained by the difference in mean between normal weight and overweight. After controlling simultaneously for sex and age, the above significant differences in means remained significant.
Table 1 Clinical and biological characteristics (mean and sd) of the sample of 8–18-year-olds according to BMI group using the WHO cut-offs
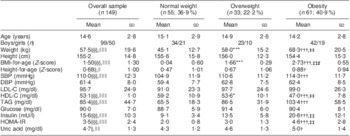
SBP, systolic blood pressure; DBP, diastolic blood pressure; LDL-C, LDL-cholesterol; HDL-C, HDL-cholesterol; HOMA-IR, homeostasis model assessment–insulin resistance.
Mean values were significantly different, normal weight v. overweight: *P < 0·05, **P < 0·01, ***P < 0·001.
Mean values were significantly different, normal weight v. obesity: †P < 0·05, ††P < 0·01, †††P < 0·001.
Mean values were significantly different, overweight v. obesity: ‡P < 0·05, ‡‡P < 0·01, ‡‡‡P < 0·001.
Overall equality of means: §P < 0·05, §§P < 0·01, §§§P < 0·001.
Linearity for overall equality of means: ∥P < 0·05, ∥∥P < 0·01, ∥∥∥P < 0·001.
Table 2 presents prevalence and crude and adjusted odds ratios for the CVD risk factors. The prevalence of high SBP, high BP, high LDL-C, low HDL-C, high TAG, high insulin and high HOMA-IR increased significantly when moving from the normal-weight group to overweight and to obese, as evidenced by the trend P value. There was a non-significant increase in the prevalence of high uric acid. Only two children had high plasma glucose levels and both were obese. Likewise, only one obese child had high DBP.
Table 2 Prevalence, cOR and aOR (adjusted for age and gender) of CVD risk factors among the sample of 8–18-year-olds according to BMI group using the WHO cut-offs, with the normal-weight group as the reference (OR = 1·00)
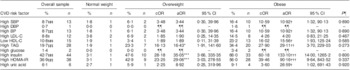
cOR, crude odds ratio; aOR, adjusted odds ratio; SBP, systolic blood pressure; DBP, diastolic blood pressure; BP, blood pressure; LDL-C, LDL-cholesterol; HDL-C, HDL-cholesterol; HOMA-IR, homeostasis model assessment–insulin resistance.
Adjusted odds were significantly different, normal weight v. overweight: *P < 0·05, **P < 0·01, ***P < 0·001.
Adjusted odds were significantly different, normal weight v. obesity: †P < 0·05, ††P < 0·01, †††P < 0·001.
Mantel–Haenszel's χ 2 test for trend in the proportions: ‡P < 0·05, ‡‡P < 0·01, ‡‡‡P < 0·001.
¶P for Hosmer–Lemeshow goodness-of-fit test (values greater than 0·05 indicate the logistic regression models were considered adequate, i.e. fitted the data well).
¶¶Not available due to zero count.
Compared with normal-weight children (the reference group), the odds ratios for all of the CVD risk factors were greater than one (Table 2). The probability of having risk factors increased in overweight children compared with the normal-weight group, and in obese children compared with the overweight group. Obese children were significantly 10·6 times more likely than normal-weight children to have hypertension. cOR for other associations were 60·2 (high insulin), 39·5 (high HOMA-IR), 27·9 (high TAG), 16·0 (low HDL-C), 4·3 (high LDL-C) and 3·6 (high uric acid). Overweight children were 3·5 times more likely than normal-weight children to have hypertension, high insulin (cOR = 28·2), high HOMA-IR (cOR = 23·3) and high TAG (cOR = 16·1), with cOR significantly greater than one compared with the reference group. Except for HOMA-IR, uric acid and insulin, the cOR and aOR were very similar.
The clustering of cardiometabolic risk factors (hypertension, low HDL-C, high TAG, high glucose and high insulin) is presented in Table 3. A total of 101 children had results for all variables required for this analysis. The great majority (94 %) of children in the normal-weight group had no risk factors, while only 43 % and 8 % of the overweight and obese children, respectively, were free from any risk factor. Overall, nearly 92 % of the obese children had one or more CVD risk factors, compared with 57 % of the overweight children and 6 % of the normal-weight children. None of the children had more than three risk factors. There was a significant positive trend association between the number of risk factors and BMI group (P < 0·001), i.e. when moving from normal weight to overweight to obese, the number of risk factors increased.
Table 3 Clustering of metabolic risk factors among the sample of 8–18-year-olds according to BMI group using the WHO cut-offs
¶Hypertension, low HDL-cholesterol, high TAG, high glucose and high insulin.
¶¶None of the children had more than three risk factors.
Discussion
The results of our study indicate that obese and overweight school-aged children and adolescents as defined by the WHO reference BMI-for-age cut-offs are at substantially increased risk for adverse levels of several CVD risk factors. Obese children were several times more likely than normal-weight children to have hypertension, high insulin, high HOMA-IR, high TAG, low HDL-C, high LDL-C and high uric acid. Similarly, children in the overweight category were at higher risk of having hypertension, high insulin, high HOMA-IR and high TAG, compared with normal-weight children. The WHO BMI cut-offs at 19 years closely coincide with the definitions for adult overweight (BMI = 25·0 kg/m2) at +1 sd and adult obesity (BMI = 30·0 kg/m2) at +2 sd, which were derived on the basis of associations with mortality(15). As there were no similar associations with functional outcomes in the school age and adolescence periods, the BMI cut-offs at 19 years where tracked back along the +1 sd and +2 sd lines to age 5 years(Reference de Onis, Onyango and Borghi4). These results provide evidence that the WHO cut-offs for childhood overweight and obesity are well suited to identifying children with metabolic and vascular risk.
Results presented in the current paper apply to children aged 8–18 years. In younger children, it is entirely possible that a given percentile represents varying levels of risk given the rapid growth and physiological changes that characterize early childhood. In effect, the terminology used by WHO for overweight and obesity in younger children (0–5 years) is different from that used for school-aged children and adolescents. In children of pre-school age, those above +1 sd are described as being ‘at risk of overweight’, above +2 sd as overweight and above +3 sd as obese(Reference de Onis and Lobstein5, 16). WHO opted for a cautious approach because young children are still growing and so far there are few data on the functional significance of the cut-offs for the upper end of the BMI-for-age distribution at such young ages(Reference Corvalán, Uauy and Kain17). Caution is all the more important given the risk for very young children, in light of their nutrient requirements for growth and development, of being placed on restrictive diets. Until more evidence becomes available, clinicians might prefer to avoid classifying a child in this age range (0–5 years) and focus instead on the individual growth trajectory and the clinical assessment. Clinicians can also use more proximate measures of body fat such as the triceps and subscapular skinfolds for which standards are now available(18).
The strong association – as depicted by the high OR – between obesity and overweight and adverse levels of SBP, HOMA-IR, fasting insulin, TAG and HDL-C is striking. Compelling evidence exists that the atherosclerotic process begins in childhood and progresses slowly into adulthood, at which time it leads frequently to CHD, a major cause of death worldwide(9). Compared with normal-weight controls, obese children and adolescents have shown a significant increase in several indices of arterial wall stiffness in the common carotid artery, indicating the beginning of vascular dysfunction. Moreover, the same study revealed that BMI, SBP and TAG were positively correlated with these arterial parameters(Reference Núñez, Martínez-Costa and Sánchez-Zahonero19). Obese and overweight children are also at increased risk of developing non-alcoholic fatty liver disease which is associated with progressive liver disease, cirrhosis and the need for transplantation, and may also contribute to CVD through the release of pro-inflammatory mediators that damage the endothelium(Reference Cheung and Kelly20). This is yet another urgent reason to address the global time bomb of childhood obesity.
Relatively little is known about the clustering of CVD risk factors among children and adolescents, largely due to the disparity between different cut-offs used to define adverse levels(Reference Bokor, Frelut and Vania14). Previous analyses such as those from the Bogalusa Heart Study(Reference Freedman, Dietz and Srinivasan21) and other populations(Reference Chu, Rimm and Wang22) found that clustering of CVD risk factors was highly prevalent in obese children. In our study, as many as 40 % of obese children had two or three risk factors. As the number of CVD risk factors increases, so does the severity of asymptomatic coronary and aortic atherosclerosis in children and young adults(Reference Berenson, Srinivasan and Bao23). Therefore, the use of the WHO cut-offs for childhood obesity as a screening tool for risk factor clustering may be particularly useful in the early identification of children likely to develop CVD.
Understanding how different cut-offs (e.g. WHO, International Obesity Taskforce (IOTF) or others) affect identification of adverse cardiometabolic risk profiles is essential for appropriately identifying children with cardiometabolic abnormalities. Recent research supports our results and demonstrates that the WHO-defined classification of overweight is associated with a range of cardiometabolic risk factors in adolescents, including carotid artery stiffness as an early marker of vascular lesions(Reference Núñez, Martínez-Costa and Sánchez-Zahonero19, Reference Kakinami, Henderson and Delvin24). The skewness of the IOTF and WHO set of centiles is very similar, but the IOTF overweight cut-offs are higher than those of the WHO because their equivalent standard deviation scores are 1·24 (girls) and 1·31 (boys)(Reference Cole and Lobstein25) as against the WHO's standard deviation score of 1·0 for boys and girls(Reference de Onis, Onyango and Borghi4). This results in the IOTF cut-offs missing a large number of children and adolescents who present unfavourable levels of fasting lipids, glucose and insulin, and SBP and DBP. Other reasons for concern with the newly proposed IOTF cut-offs include the improbability that over 15 % of a sample of Chinese children aged 2–5 years would be morbidly obese(Reference Cole and Lobstein25).
Our study has some limitations. The population is drawn from paediatric care centres, the age range is wide (high BMI at 8 years may not have the same metabolic impact as at 18 years) and results are not necessarily applicable elsewhere (Latin population). Notwithstanding these constraints, a recent Canadian study based on a large population-representative sample of North American children aged 9–16 years(Reference Kakinami, Henderson and Delvin24) reported similar associations to those presented herein. Kakinami et al.'s study and ours, based on different populations and study designs, should reassure users of the WHO cut-offs that children and adolescents classified as overweight and/or obese on this basis indeed have higher metabolic and vascular risks.
Another weakness of the present study concerns the criteria for defining high levels of the biochemical variables (i.e. total cholesterol, HDL-cholesterol, LDL-cholesterol, TAG, glucose, insulin and uric acid) for the age groups concerned. The cut-offs for these variables in current use are largely adapted from adult definitions and do not necessarily apply to children(Reference Bokor, Frelut and Vania14). We used the cut-offs more widely accepted; however, because of the age- and sex-dependent changes during childhood and adolescence, there is a need to develop unified childhood-specific criteria for defining high levels of lipids, glucose, insulin, HOMA-IR and uric acid, as well as to reach consensus on the definition of ‘metabolic syndrome’ in children and adolescents. Unified classification criteria will help achieve comparable study results and avoid the likelihood of different diagnoses.
Conclusions
Obesity and overweight in school-aged children and adolescents, defined using the WHO BMI-for-age cut-offs, identify children with higher metabolic and vascular risk. These cut-offs are clinically meaningful and thus valuable in identifying individual children and populations in need of CVD-prevention strategies. Our findings emphasize the importance of prevention of overweight and obesity in children and adolescents to reduce cardiovascular risk.
Acknowledgements
Source of funding: This research received no specific grant from any funding agency in the public, commercial or not-for-profit sector. Conflicts of interest: No author had a personal or financial conflict of interest. Authors’ contributions: M.d.O. conceptualized the paper, guided the analyses and wrote the manuscript. G.N.-T. implemented the analyses and wrote the statistical methods. C.M.-C., F.N. and J.B. were co-responsible for study design, patient recruitment and provided clinical expertise. A.M. was involved in data collection. All authors reviewed different drafts of the manuscript, contributed to the final paper and approved the final version.


