


In Europe, approximately 3–9 % of women who enter pregnancy are underweight and 30–37 % are overweight or obese( Reference Zeitlin, Mohangoo and Delnord 1 ). Being underweight or overweight during pregnancy is associated with several health risks for both mother and child. Maternal overweight and obesity is associated with a higher risk of multiple adverse pregnancy conditions such as pre-eclampsia, gestational diabetes, preterm delivery, neural tube defects and congenital anomalies( Reference Bartsch, Medcalf and Park 2 – Reference Rasmussen, Chu and Kim 4 ). Being underweight during pregnancy is associated with a higher risk of preterm delivery, small for gestational age and a low birth weight( Reference Rahman, Abe and Kanda 5 ).
A low micronutrient status during pregnancy can lead to similar adverse pregnancy outcomes and might explain part of the relationship between weight status and adverse pregnancy outcomes( Reference Wu, Imhoff-Kunsch and Girard 6 ). Studies in Western countries have indicated a J-shaped association between maternal weight status and micronutrient status in non-pregnant women of childbearing age: underweight as well as overweight and obese women have lower levels of several micronutrients compared with women with normal weight( Reference Kimmons, Blanck and Tohill 7 – Reference Tinker, Hamner and Berry 11 ). In developed countries, whereas a lower micronutrient status in underweight women might be due to inadequate food intake and unhealthy eating habits( Reference Wronka, Suliga and Pawlinska-Chmara 12 ), in overweight and obese individuals the cause is probably multifactorial, for example both poor diet quality and biological factors related to obesity (such as chronic low-grade inflammation)( Reference Garcia, Long and Rosado 13 , Reference Laraia, Bodnar and Siega-Riz 14 ).
Folate, Fe and vitamin B12 are important micronutrients during pregnancy; moreover, because the requirements for these nutrients increase considerably during pregnancy, pregnant women have a higher risk of deficiencies than non-pregnant individuals( Reference Wu, Imhoff-Kunsch and Girard 6 , Reference Hermoso, Vollhardt and Bergmann 15 ). Deficiency of each of these nutrients is associated with several short- and long-term health risks for both mother and child( Reference Berti, Biesalski and Gartner 16 ). A low maternal folate status is known to increase the risk of neural tube defects, especially in combination with a low vitamin B12 status( Reference Berti, Biesalski and Gartner 16 ). In the long term, maternal folate and vitamin B12 deficiency during pregnancy is associated with a higher heart rate in the offspring at age 5 years and an increased risk of insulin resistance at age 6 years( Reference Krikke, Grooten and Vrijkotte 17 , Reference Yajnik, Deshpande and Jackson 18 ). A low maternal Fe status during pregnancy is associated with an increased risk of small-for-gestational-age infants and preterm delivery( Reference Scholl, Hediger and Fischer 19 – Reference Alwan, Cade and McArdle 21 ). In the long term, maternal Fe deficiency is associated with delayed neurocognitive development during childhood, which can persist into adulthood( Reference Radlowski and Johnson 22 ).
While several studies have found an association between weight status and folate, Fe and vitamin B12 in non-pregnant women, few studies have focused on this association during pregnancy. A study in a white British pregnant population found that a higher pre-pregnancy BMI (pBMI) was associated with lower folate levels at 28 weeks of gestation(23). However, a study from the USA found lower folate levels at 20 weeks of gestation for overweight women but not for obese women( Reference Tomedi, Chang and Newby 24 ). Furthermore, two studies from Spain and the USA found that a higher pBMI is associated with a lower status of Fe at 24, 26 and 34 weeks of gestation( Reference Cao, Pressman and Cooper 25 , Reference Garcia-Valdes, Campoy and Hayes 26 ). Additionally, a study in a Chinese pregnant population found that a higher pBMI is associated with a lower status of the Fe storage protein ferritin at 20 weeks of gestation; however, this association has not been confirmed in Western pregnant populations( Reference Cao, Pressman and Cooper 25 – Reference Jones, Zhao and Jiang 27 ).
To date, most studies have focused on micronutrient status in the last trimester of pregnancy, while the first trimester of pregnancy is the most critical period for the development of deficiency-related health risks during pregnancy( Reference Wu, Imhoff-Kunsch and Girard 6 ). In addition, no studies have investigated the nutritional status of pregnant women who are underweight. Therefore, uncertainty still exists about the association between weight status and micronutrient status during early pregnancy.
The present study investigated the association between pre-pregnancy weight status and folate, Fe, ferritin and vitamin B12 status, and the risk for deficiencies in these nutrients, in a large cohort of women during early pregnancy.
Methods
Study design
The Amsterdam Born Children and their Development (ABCD) study is a prospective observational cohort study that aims to investigate the associations between maternal lifestyle, medical, dietary and environmental conditions during pregnancy and their children’s health at birth and later in life( Reference van Eijsden, Vrijkotte and Gemke 28 ). In 2003 and 2004, all pregnant women in Amsterdam were invited to participate in the ABCD study during their first appointment at their obstetric caregiver( Reference van Eijsden, Vrijkotte and Gemke 28 ). Within two weeks, a written informed consent sheet and a pregnancy questionnaire about sociodemographic characteristics, obstetric history, lifestyle, medical conditions and psychosocial conditions were sent to the women. In addition, the women were invited to participate in the ABCD biomarker study. Three months after birth, all mothers who filled in the pregnancy questionnaire were followed-up with an infant questionnaire to obtain information on the course of the pregnancy and delivery, in addition to the health and development of the baby( Reference van Eijsden, Vrijkotte and Gemke 28 ).
Study sample
In the present study, women were included when data were available on their weight status and at least one valid nutrient measurement. Excluded were twin pregnancies and women with pre-existent and gestational diabetes, since these conditions can influence the nutrient status of women( Reference Krishnaveni, Hill and Veena 29 , Reference Simcox and McClain 30 ). The final study sample consisted of 4243 pregnant women (Fig. 1).
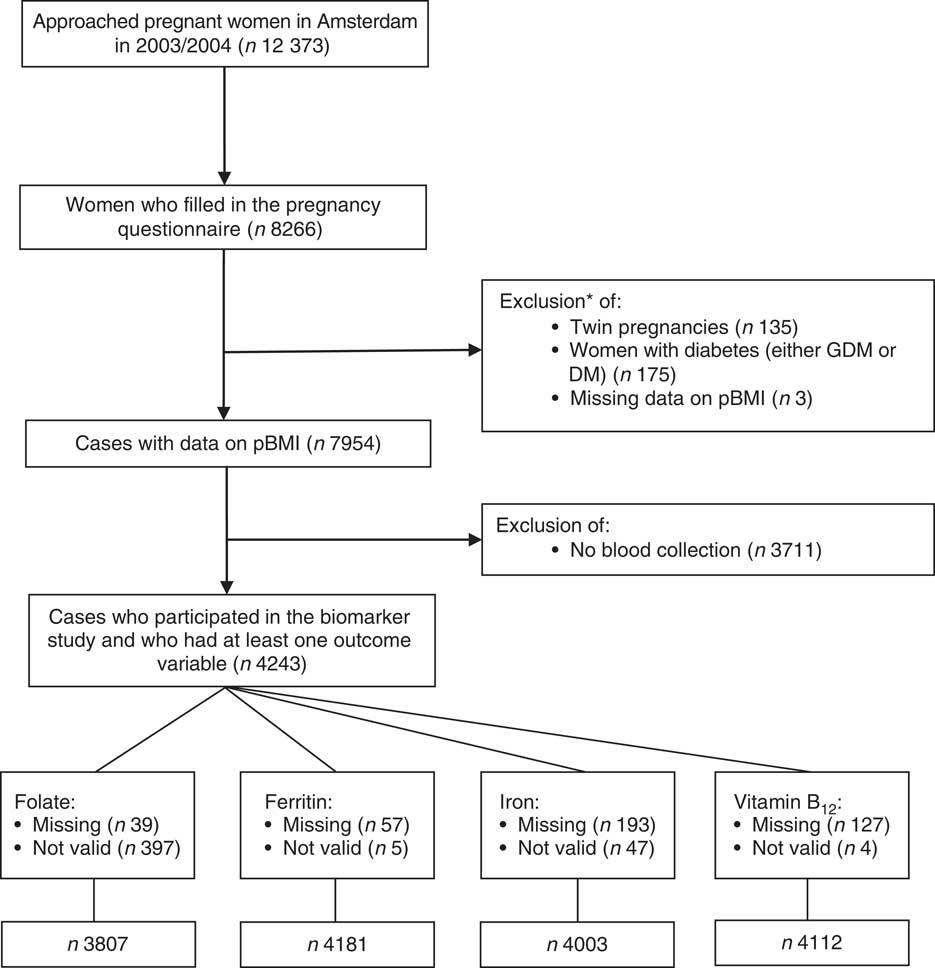
Fig. 1 Flowchart of the study sample. *The sum of the excluded cases is greater than the total excluded cases because of overlap in the excluded variables (pBMI, pre-pregnancy BMI; DM, diabetes mellitus; GDM, gestational diabetes mellitus)
Measurements
Weight status was determined by pBMI. The variable pBMI was computed using self-reported pre-pregnancy weight and height of the participants, obtained from the pregnancy questionnaire. The variable was considered continuous for explorative analyses and divided into four categories for additional analyses: underweight (BMI <18·5 kg/m2), normal weight (BMI=18·5–24·9 kg/m2), overweight (BMI=25·0–29·9 kg/m2) and obesity (BMI ≥30·0 kg/m2)( 31 ).
Non-fasting blood samples were taken during early pregnancy (median 13 weeks, interquartile range (IQR) 12–15 weeks), during the routine blood collection for screening purposes at the first antenatal check-up. The blood samples were collected in a 10 ml EDTA (K2) Vacutainer® (Becton and Dickson BV, Alphen aan de Rijn, the Netherlands) for the preparation of plasma and in a 9 ml evacuated tube (Vacuette®; Breiner BV, Alphen aan de Rijn, the Netherlands) for the preparation of serum. After blood collection, the blood samples were sent to the Regional Laboratory of Amsterdam, by courier or by overnight mail, for further processing. This process did not influence the validity of specific biomarkers( Reference van Eijsden, van der Wal and Hornstra 32 ). At the laboratory, plasma and serum were prepared by centrifugation and then stored as 1 ml aliquots at −80 °C until analysis at the laboratory.
The analysis of vitamin B12 and Fe status in serum was performed by the laboratory of the National Institute for Public Health and the Environment (RIVM, Bilthoven, the Netherlands). The analyses of both vitamin B12 and Fe were performed in the second half of 2005, a median of 24·5 (IQR 21·1–28·4) months after storage. For vitamin B12 status, an immunoassay with chemiluminescence detection on the Access Immunoassay System (Beckman Coulter, Woerden, the Netherlands) was used( Reference Goedhart, van der Wal and van Eijsden 33 ). The inter-assay CV for vitamin B12 was 7·8 % for low values and 7·6 % for high values. The upper detection limit was 1500 pg/ml. The reliability of the measurements analysed at RIVM was determined by the HIL index: when a serum specimen contains Hb (haemolysis, H), bilirubin (icterus, I) or lipids (lipoedema, L), the test could be negatively affected. The vitamin B12 data were considered unreliable at values of H>1400, I>30 and/or L>250. For assessment of serum Fe, in vitro colorimetric assay on the Hitachi 912 Analyser (Roche Diagnostics, Mannheim, Germany) was used. The inter-assay CV for serum Fe was 1·5 %. Data of serum Fe were considered unreliable at values of H>80, I>60 and/or L>100.
The analyses of folate and ferritin status in serum were performed in the Medical Laboratory Dr. Stein & Collegae (Maastricht, the Netherlands)( Reference Goedhart, van der Wal and van Eijsden 33 ). These analyses were performed at a median of 3·6 (IQR 3·1–4·1) months after storage of the sample. Both nutrients were determined by performing an immunoassay with chemiluminescence detection on the Advia Centaur System (Bayer Group, Mijdrecht, the Netherlands). For folate, the inter-assay CV was 6·1 % for low values and 5·3 % for high values; the upper and lower detection limits were 54·4 and 0·8 nmol/l, respectively( Reference Krikke, Grooten and Vrijkotte 17 , Reference Goedhart, van der Wal and van Eijsden 33 ). For ferritin, the inter-assay CV was 7·9 % for low values and 2·7 % for high values. All samples were within detection limit. All nutrients with measurements that were above the HIL-index criteria and/or were above/below the detection limits were excluded (Fig. 1).
Covariates
Information on the use of supplemental Fe, vitamin B12 and folate (yes, no) was extracted from self-reported information in the infant questionnaire. Information on potential confounding variables was obtained from the pregnancy questionnaire; these included maternal age (years), education after primary school (years), smoking behaviour in early pregnancy (no smoking, <1, 1–5 or >5 cigarettes/d), alcohol intake in early pregnancy (yes, no), parity (nulliparous, multiparous), nausea during pregnancy (yes, no), weight gain during early pregnancy (<0·3 kg/month, 0·3–1·0 kg/month or >1·0 kg/month) and ethnicity, based on country of birth of the pregnant woman (Dutch, African, Moroccan, Turkish, other Western or other non-Western).
C-reactive protein levels were determined in serum at the Medical Laboratory Dr. Stein & Collegae. Samples were analysed at a median of 3·6 (IQR 3·1–4·1) months after storage of the sample. C-reactive protein was determined by high-sensitivity assay (Dade-Behring, Leusden, the Netherlands). The inter-assay CV was 5·2 % for low values and 2·6 % for high values; the lower detection limit was 0·5 mg/l.
Statistical analyses
First, the demographics of the study population were determined for the whole sample, as well as for each separate pBMI category. Differences between the pBMI groups were tested for significance by performing a one-way ANOVA or a χ 2 test. After one-way ANOVA, a post hoc test was performed (reference category: normal weight): the Bonferroni post hoc test when the variances were equally distributed and the Games–Howell post hoc test when the variances were unequally distributed. In addition, a non-response analysis was conducted to compare the response group (non-diabetic, singleton pregnancies) with the non-response group (non-diabetic, singleton pregnancies and no participation the ABCD biomarker study) on demographic characteristics. The demographic characteristics in these two groups were tested by the independent t test or the χ 2 test.
Next, all data on nutrient status were standardized for the gestational age at blood sampling moment, because the week of pregnancy could influence nutrient status( Reference Zhang, Yuan and Liu 34 ). All serum micronutrient levels were calculated back to the median of 13 weeks. Ferritin and vitamin B12 levels were natural log transformed for all further analyses to correct for their skewed distribution. For the interpretation of the log-transformed data, results were back-transformed by taking the exponential of the log-transformed regression coefficients.
To explore the association between pBMI (continuous) and nutrient status, charts for each nutrient were generated by using restricted cubic spline modelling. These charts were generated both with and without adjustment for maternal age, education, parity, smoking during pregnancy, alcohol use during pregnancy, nausea during pregnancy, weight gain during pregnancy and ethnicity. An ANOVA was performed to check for linearity. If non-linearity was observed, a likelihood ratio test was performed to test whether this non-linear model better fitted the association than the linear model.
Next, descriptive analyses were performed on the nutrient status (mean and sd/median and IQR) and, for each nutrient, we calculated the percentage of women who were deficient. A nutrient status below the following values was considered deficient: serum folate <10·0 nmol/l and ferritin <15·0 μg/l, according to the WHO cut-off values for folate and ferritin( 35 , 36 ). WHO cut-off values for Fe and vitamin B12 were not available and therefore reference values for non-pregnant women from the medical laboratory in the Academic Medical Center (Amsterdam, the Netherlands) were used( 37 ): Fe<11·0 μmol/l and vitamin B12<203·3 pg/ml.
Linear regression modelling was used to assess the association between pBMI (categorical, reference category: normal weight) and each nutrient level (model 1). The model was then adjusted for maternal age, education, smoking during pregnancy, alcohol use during pregnancy, parity, nausea during pregnancy, weight gain during pregnancy and ethnicity (model 2).
Logistic regression modelling was performed to assess the association between pBMI (categorical, reference category: normal weight) and nutrient deficiency per nutrient (yes, no). This model was also adjusted for all covariates in model 2.
Two sensitivity analyses were performed. The first investigated the abovementioned associations in a more homogeneous sample including women of Dutch ethnicity only; the second included only those women who did not use supplements during pregnancy.
Statistical analyses were performed using the statistical software packages IBM SPSS Statistics version 22, R version 3.2.3 and R-studio version 0.99.891. P<0·05 was considered statistically significant.
Results
Population characteristics
Table 1 presents the characteristics of the study population. Women who were underweight were significantly younger, had fewer years of education, were less likely to be Dutch, and had less weight gain during pregnancy compared with women with a normal weight. Overweight women were younger than normal-weight women, and both overweight and obese women had fewer years of education, were less likely to be Dutch, and drank less alcohol during pregnancy compared with women with a normal weight. Overweight and obese women were more likely to have hypertension, had more weight gain and more nausea during pregnancy, and were less likely to use folate supplements. In addition, overweight and obese women had higher C-reactive protein levels compared with normal-weight women.
Table 1 Characteristics of the study population according to category of pre-pregnancy BMI (pBMI): women with singleton pregnancies without diabetes (n 4243), the Amsterdam Born Children and their Development (ABCD) study, the Netherlands, 2003–2004

T1, first trimester of pregnancy.
Data presented are mean and sd for continuous variables or n and % for dichotomous and categorical variables. P values for differences between pBMI groups were determined by performing a one-way ANOVA for continuous variables or a χ 2 test for dichotomous and categorical variables; after one-way ANOVA, a post hoc test was performed using normal weight as the reference category: the Bonferroni post hoc test when the variances were equally distributed or the Games–Howell post hoc test when the variances were unequally distributed.
*P<0·05, ***P<0·001.
† Median and interquartile range are given because of skewed distribution of the variable.
The non-response analysis showed that, compared with those who did not participate in the biomarker study, the included women were significantly more likely to be Dutch and nulliparous, have more years of education, a lower pBMI, and more often use alcohol during pregnancy (see online supplementary material, Table S1).
Maternal micronutrient status
Restricted cubic spline modelling showed a non-linear association for pBMI (continuous) and serum folate in the non-adjusted model (Fig. 2(a)). However, after correcting for covariates, the non-linear model did not show a significantly better fit than the linear model (Fig. 2(e)). Restricted cubic spline modelling also showed a non-linear association between pBMI and serum Fe in both the non-adjusted and the adjusted model (Fig. 2(c) and 2(g)). These non-linear models showed a significantly better fit than a linear model. Associations between pBMI and ferritin and vitamin B12 were linear, also after correcting for covariates (Fig. 2(b), 2(d), 2(f) and 2(h)).
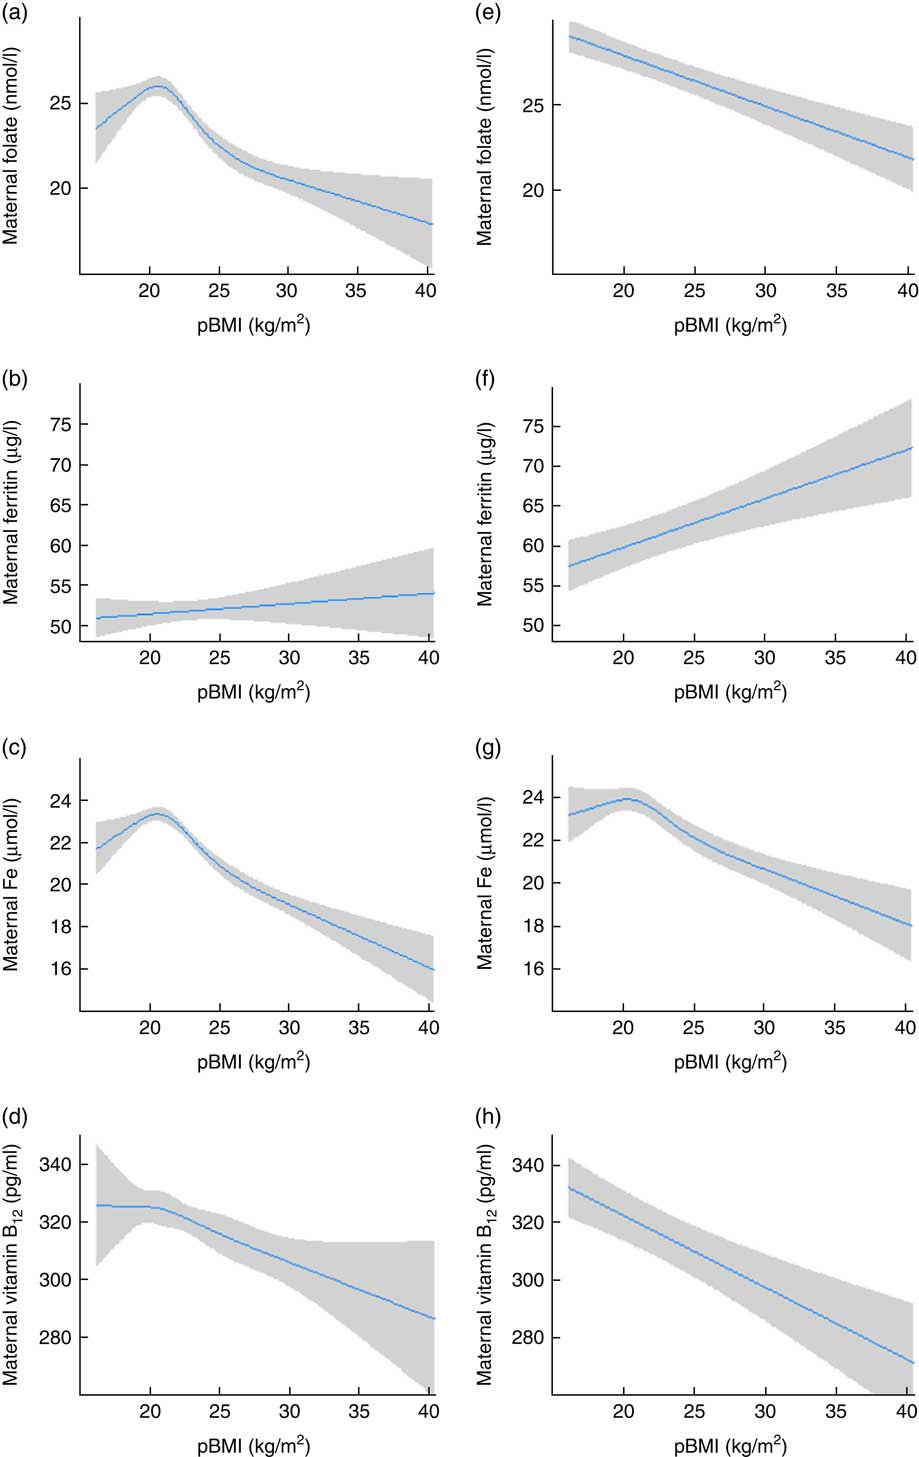
Fig. 2 (colour online) Association between pre-pregnancy BMI (pBMI) and maternal nutrient concentration in early pregnancy among women with singleton pregnancies without diabetes (n 4243), the Amsterdam Born Children and their Development (ABCD) study, the Netherlands, 2003–2004. Left panel: association between pBMI and maternal folate (a), ferritin (b), iron (c) and vitamin B12 (d), standardized for gestational age at blood sampling moment. Right panel: association between pBMI and maternal folate (e), ferritin (f), iron (g) and vitamin B12 (h), standardized for gestational age at blood sampling moment, and adjusted for maternal age, education, parity, smoking during pregnancy, alcohol use during pregnancy, nausea during pregnancy, weight gain during pregnancy and ethnicity. Restricted cubic spline models, with 95 % CI represented by grey shading
Table 2 presents an overview of the micronutrient concentrations and prevalences of deficiency according to the pBMI categories. Of all women, 8·8 % were folate deficient and 13·8 % were vitamin B12 deficient. For Fe status, 10·6 % of all women were ferritin deficient and 6·1 % were serum Fe deficient. Micronutrient deficiencies were more prevalent in overweight and obese women than in normal-weight women, with the highest prevalence in obese women.
Table 2 Mean/median levels and percentage deficiency for folate, ferritin, iron and vitamin B12 status in early pregnancy, according to category of pre-pregnancy BMI, among women with singleton pregnancies without diabetes (n 4243), the Amsterdam Born Children and their Development (ABCD) study, the Netherlands, 2003–2004

IQR, interquartile range.
All values are standardized for gestational age at blood sampling moment (90 d).
† Median and IQR are given because of skewed distribution of the variable.
Associations between weight status and maternal micronutrient status
Table 3 presents the results from the linear and logistic regression modelling analyses. After correction for covariates, women with overweight had significantly lower levels of folate (β=–1·2; 95 % CI −2·2, −0·2 nmol/l) compared with women with normal weight. In addition, obese women had significantly lower levels of folate (β=–2·3; 95 % CI −4·0, −0·7 nmol/l) than women with a normal weight. Overweight and obese women also had higher odds for folate deficiency (OR=1·38; 95 % CI 1·03, 1·85 and OR=2·03; 95 % CI 1·35, 3·06, respectively).
Table 3 Regression models of the association between maternal pre-pregnancy BMI (pBMI) and maternal folate, ferritin, iron and vitamin B12 concentration in early pregnancy among women with singleton pregnancies without diabetes (n 4243), the Amsterdam Born Children and their Development (ABCD) study, the Netherlands, 2003–2004

Model 1: standardized for gestational age at blood sampling moment; Model 2: model 1 and additionally adjusted for maternal age, education, parity, smoking during pregnancy, alcohol use during pregnancy, nausea during pregnancy, weight gain during pregnancy and ethnicity.
*P<0·05, **P<0·01, ***P<0·001.
† Log transformation was performed because of skewed distribution of the variables.
Pre-pregnancy obesity showed a significant association (9 %; 95 % CI 6, 32 %) with increase of ferritin levels compared with women with normal weight. Underweight, overweight and obese women did not have significantly different odds for deficiency compared with normal-weight women.
After adjustment for covariates, overweight women had significantly lower serum Fe levels (β=−1·7; 95 % CI −2·3, −1·1 μmol/l), and obese women had significantly lower Fe levels (β=−3·6; 95 % CI −4·7, −2·6 μmol/l), compared with women with normal weight. Women with overweight and obesity had significantly higher odds for serum Fe deficiency (OR=1·45; 95 % CI 1·02, 2·07 and OR=3·26; 95 % CI 2·09, 5·08, respectively).
Compared with normal-weight women, vitamin B12 levels were 6 % lower (95 % CI −9, −3 %) in women with overweight and 15 % lower (95 % CI −19, −10 %) in obese women. Overweight and obese women had higher odds for a vitamin B12 deficiency (OR=1·38; 95 % CI 1·08, 1·77 and OR=2·05; 95 % CI 1·41, 2·99, respectively).
The results from the sensitivity analyses on the Dutch population (see online supplementary material, Table S2) and the non-supplement using population (Table S3) showed values similar to those reported in Table 3. However, in both sensitivity analyses, the association between pBMI and folate lost significance after adjustment for the covariates.
Discussion
The present study shows that women with pre-pregnancy overweight and obesity both have significantly lower serum folate, Fe and vitamin B12 levels during early pregnancy compared with women with normal weight. The prevalence of deficiency among pregnant women with pre-pregnancy obesity was 21·8 % for folate, 19·6 % for serum Fe and 22·8 % for vitamin B12, while in women with normal weight the corresponding prevalence was 7·0, 4·6 and 12·4 %, respectively. This resulted in two to three times higher odds for deficiency of these nutrients in women with obesity compared with normal-weight women. Although women with underweight had lower micronutrient levels and deficiencies were more prevalent than in women with a normal weight, these differences were not significant.
Our results with respect to folate are in line with those of previous studies. A study in a white British pregnant population found that an increase in pBMI was linearly associated with a decrease in serum folate( Reference Knight, Shields and Brook 23 ). A small study in a US population found lower folate levels in overweight and obese women compared with normal-weight women; however, this difference was significantly lower only in overweight women( Reference Tomedi, Chang and Newby 24 ). This loss of significance might be due to the relatively small number of obese women (n 36) included in that study.
In line with our results, a study among pregnant adolescents in the USA found significantly lower levels of serum Fe in obese women, but no significant association between weight status and ferritin levels( Reference Cao, Pressman and Cooper 25 ). A small study in a Spanish pregnant population found lower (but non-significant) serum Fe levels in obese women( Reference Garcia-Valdes, Campoy and Hayes 26 ).
In the present study, the lower levels of vitamin B12 in overweight and obese women is in agreement with two other studies reporting lower vitamin B12 levels in overweight and obese pregnant women( Reference Knight, Shields and Brook 23 , Reference Krishnaveni, Hill and Veena 29 ). To our knowledge, however, no studies in developed countries have investigated the association between underweight pBMI and folate, ferritin, Fe and/or vitamin B12 status.
Although both serum Fe and ferritin are markers for Fe status, they showed different associations with weight status. This difference might be explained by the response of ferritin to inflammation in obese individuals( Reference Nikonorov, Skalnaya and Tinkov 38 ). Ferritin is a Fe-storing protein, with serum ferritin regarded as a measurement of total body Fe store( Reference Kell and Pretorius 39 ). However, independently from Fe status, serum ferritin is also raised by inflammation in the body, as ferritin is an acute-phase protein( Reference Kell and Pretorius 39 ). Adipose tissue produces cytokines, causing a chronic low-grade inflammation in obese individuals, which may have caused the higher ferritin levels in obese individuals compared with normal-weight women( Reference Kroot, Tjalsma and Fleming 40 ). Therefore, ferritin might not be a reliable indicator for Fe status in obese pregnant individuals.
The underlying mechanism of the relationship between pBMI and micronutrient status is not completely understood. A lower dietary intake of micronutrients before and during pregnancy, as well as biological mechanisms, may play a role. Two studies in US populations found that the diet of obese pregnant women had a lower quality compared with the diet of normal-weight women( Reference Shin, Lee and Song 41 , Reference Carmichael, Yang and Gilboa 42 ). Compared with other pBMI categories, obese pregnant women consumed less whole fruits and more empty calories, such as solid fats, alcohol and added sugars( Reference Shin, Lee and Song 41 ). Furthermore, low use of supplements was found in overweight and obese women in our study, and in other studies( Reference Shin, Lee and Song 41 , Reference Aronsson, Vehik and Yang 43 ). This may be an important determinant of the lower micronutrient status found in this group. However, in our sensitivity analysis in the non-supplement using population, we still found associations similar to those in the total population. This indicates that lower supplement use did not explain the lower micronutrient levels and increased odds of deficiency in women with overweight and obesity.
Besides diet quality, biological mechanisms may explain part of the association between weight status and serum Fe. The Fe-regulating hormone hepcidin is thought to play an important role( Reference Nikonorov, Skalnaya and Tinkov 38 , Reference Krause, Neitz and Magert 44 , Reference Pigeon, Ilyin and Courselaud 45 ). Hepcidin expression is enhanced due to chronic inflammation in adipose tissue, a characteristic of obesity, and may be increased in obese women( Reference Kroot, Tjalsma and Fleming 40 ). Elevated levels of hepcidin reduce intestinal Fe absorption and macrophage release of Fe, leading to a lower availability of Fe( Reference Kroot, Tjalsma and Fleming 40 ).
Biological mechanisms may also play a role in the association between weight status and serum folate. While obese pregnant women have lower serum folate levels than normal-weight women (in the present study and in others( Reference Knight, Shields and Brook 23 , Reference Tomedi, Chang and Newby 24 )), higher levels of erythrocyte folate are reported in this group( Reference Shen, Chaudhry and MacFarlane 46 ). Furthermore, a study among pregnant women showed no difference in absorption of folate between obese and normal-weight women( Reference da Silva, Hausman and Kauwell 47 ). Therefore, it is hypothesized that folate is distributed differently in obese women after uptake, storing more folate in erythrocytes instead of serum( Reference Tinker, Hamner and Berry 11 , Reference Shen, Chaudhry and MacFarlane 46 ). Especially in the first trimester of pregnancy, nutrients are transferred from maternal serum to the embryo, which might indicate a lower bioavailability of folate for the embryo in obese women( Reference Shen, Chaudhry and MacFarlane 46 , Reference Sandovici, Hoelle and Angiolini 48 ).
Strengths of the present study are the large number of participants and the collection of data on various variables, which allowed us to correct for several potential confounding covariates. Furthermore, the moment of blood sampling took place early in pregnancy, which is the most critical period for the risks of micronutrient deficiencies( Reference Wu, Imhoff-Kunsch and Girard 6 ). A limitation was that only half of the participants in the ABCD study chose to participate in the ABCD biomarker study, which could affect the generalizability of the present study. The non-response analysis showed that women who participated had a lower BMI, more years of education, used more alcohol during pregnancy and were more likely to be Dutch. Therefore, individuals at higher risk for micronutrient deficiency may be under-represented in the present study sample, which may have underestimated the effect sizes in the results. Moreover, pBMI was determined by self-reported weight and height of the participants. Participants tend to overestimate their height and underestimate their weight, which could have led to an underestimation of pBMI( Reference Stewart, Jackson and Ford 49 ). However, Shin et al. found that self-reported weight and height was a valid determination of the actual BMI before pregnancy( Reference Shin, Chung and Weatherspoon 50 ). Furthermore, we used non-pregnancy reference values as cut-off values to define micronutrient deficiency. However, due to the metabolic and physiological changes during pregnancy, micronutrient levels might deviate from those in non-pregnant women, possibly making the measurements less reliable( Reference Wheeler 51 ). Therefore, in the present study, the deficiency prevalences should be interpreted with caution. Currently, due to the absence of guidelines for optimal blood values for folate, Fe and vitamin B12 during pregnancy, cut-off values need to be established for the detection of deficiency during pregnancy.
Conclusion
In conclusion, the present study results suggest that women who are overweight or obese before pregnancy have a lower serum folate, Fe and vitamin B12 status in early pregnancy compared with women with pre-pregnancy normal weight. Furthermore, our results indicate that women who are obese before pregnancy are more likely to be folate deficient, Fe deficient or vitamin B12 deficient during pregnancy. Further research is needed to confirm these associations and to explore the causality and underlying mechanisms. This is necessary for the development of effective interventions or dietary recommendations for overweight and/or obese women in reproductive age, to prevent nutrient deficiencies before and during pregnancy.
Acknowledgments
Acknowledgements: The authors thank the participating mothers and their children, and all other persons who contributed to the ABCD study: obstetric care providers, primary schools, students and youth health-care centres in Amsterdam, the Netherlands. Financial support: This work was supported by the Netherlands Organization for Health Research and Development (ZonMw) (grant number TOP 40-00812-98-11010). ZonMW had no role in the design, analysis or writing of this article. Conflict of interest: None. Authorship: J.M.S. and T.G.M.V. developed the concept of the present study as part of the ABCD study. J.M.S. conducted the analyses. All co-authors contributed to interpreting the results and writing the manuscript, and all have read and approved the final version. Ethics of human subject participation: The ABCD study was approved by the Central Committee on Research Involving Human Subjects in the Netherlands, the Medical Ethical Committees of the participating hospitals, and the Registration Committee of the Municipality of Amsterdam.
Supplementary material
To view supplementary material for this article, please visit https://doi.org/10.1017/S1368980018000459


